 搜索
搜索
-
Abstract:
Powered two-wheelers (PTWs) are considered as one of the risky means of transport as it is vulnerable to road crashes, which may lead to fatal injuries. Crash data revealed that the number of deaths caused by PTWs is significantly higher than any other road users. Literature reports that one of the major causes of high PTW crashes is the riding behavior of the users. Therefore, the present paper reviews existing literature related to factors affecting riding behavior. Several factors with different levels of influence on PTW riding behavior are explored in the paper. Further, safety strategies to improve PTW safety have been reported in the study by categorizing it based on risk factors, i.e., riding behavior, vehicle technology, and road infrastructure. The paper concludes with some of the major findings, i) riding behavior plays an essential role in improving PTW safety, ii) numerous research stated that riding behavior can be improved by enforcement and providing feedback about their riding behavior by profiling them into different categories, and iii) segregation of PTW traffic from other road users is reported to be an effective solution for increasing PTW safety in some developing countries. While a considerable amount of research related to riding behavior and PTW safety has been done, studies related to the impact of riding feedback on PTW riding behavior are scant. Further, it is suggested that future research should focus on the feasibility of advanced traffic management strategies, such as the segregation of PTWs from main traffic to reduce the conflict between vehicles.
-
1. Introduction
1.1 Overview
Road crashes are the 8th leading cause of death, and more than 50% of people killed in road crashes worldwide are vulnerable road users, which include pedestrians, cyclists, and powered two-wheeler (PTW) riders. PTW crashes are a widespread issue globally and present a substantial risk of injury and death. Across the world, PTW users are involved in 21% of road crashes. By region, the prevalence varies: in the Americas, it's 28%; in Europe, it's 16%; in the Eastern Mediterranean, it's 9%; in Africa, it's 18%; in the South-East Asia region, it's 48%; and in the Western Pacific, it's 16% (WHO, 2023). In developing countries, the share of PTW in total road traffic is high compared to developed countries. For example, the United States has the lowest percentage share of PTW, i.e., 3.34%, whereas Indonesia has the highest PTW share, i.e., 81.33% (MoRT & H, 2017). In developing countries, the share of PTW in total registered vehicles ranges from 47% (in Malaysia) to 79.90% (in India) (MoRT & H, 2017). This high proportion of PTW traffic also means that the probability of it being involved as one of the users in a road crash is high in these countries. In India, 45.1% of road crash deaths were reported having PTW as one of the road users involved in road crashes (MoRT & H, 2021), which is very high as compared to other road users, as presented in Fig. 1.
![]() Figure 1. Road crashes, fatalities, and injuries by type of impacting vehicle in India (MoRT & H, 2021).
Figure 1. Road crashes, fatalities, and injuries by type of impacting vehicle in India (MoRT & H, 2021).PTW is a popular means of transport in developing countries as it provides flexibility in maneuvering and parking and is a cheap mode of transportation. The riding style and crash characteristics of PTWs are different from the other road users. PTW riders have a higher risk of injury due to their lack of protection compared to passenger cars, which can lead to a severe crash in the event of crashes above a certain speed (Elliott et al., 2003; Rifactt et al., 2012; Yannis et al., 2005). Recent studies show that the execution of road safety regulations, improvement in the quality of enforcement, and advancement in technology may affect PTW safety and help reduce PTW crashes (Law et al., 2009; Pallacci et al., 2019; Paulozzi et al., 2007).
1.2 Review objectives
It is apparent from the statistics mentioned above that PTW safety has become a major problem for both developed and developing countries. However, existing literature related to PTW safety and riding behavior is still not vast compared to other road users (passenger cars, etc.) and lacks a combined contemplation of the various related factors. Therefore, there is a distinct need for further research with respect to PTWs. Considering that existing studies reviewing PTW riding behavior and safety strategies are very few, the present study aims to provide an extensive overview of riding behavior and safety. This paper delves into the existing literature to assess the prevalence of common risky driving behaviours like speeding, use of safety equipment, stunt performance, distractions, and drink driving. A great variety of identified risk factors were examined in the review to present a complete overview of influential factors.
Moreover, in comparison to existing related reviews (Farid and Ksaibati, 2021; Lin and Kraus, 2009; Theofilatos and Yannis, 2015; Vlahogianni et al., 2012), which mainly review the factors affecting PTW riding behavior, this paper also provides an overview of PTW safety strategies in order to outline the research gaps and propose future research directions regarding PTW safety. The paper discusses potential safety strategies focusing on improving riding behavior, enhancing vehicle technology, and upgrading road infrastructure. Riding behavior improvement strategies encompass education, enforcement, rider behavior feedback, rider profiling, and eco-riding training, as well as usage-based insurance schemes like pay as you drive (PAYD) and pay how you drive (PHYD). Vehicle technology improvement strategies entail adopting advanced braking systems, daytime running light (DRL) installations, and audible warning systems to enhance driving behavior. Road infrastructure improvement strategies include the implementation of self-explaining roads, forgiving roads, and traffic segregation measures. Therefore, the present study reviews literature related to PTW riding behavior, its safety, and strategies to improve the same. The following objectives will be covered in this paper.
• Provide insight into data collection methods for collecting riding behavior data.
• Exploring existing methodologies adopted by researchers to analyze riding behavior data.
• Provide an in-depth understanding of different factors affecting riding behavior by reviewing related studies.
• Report strategies to improve PTW safety based on critical risk factors, i.e., rider, vehicle, and road infrastructure.
The paper has been divided into five different sections. The subsequent section (Section 2) provides an overview of different methods present in the literature for analyzing riding behavior. In Section 3, various factors affecting riding behavior have been discussed, along with their influence on riding performance. Further, Section 4 presents different strategies to improve PTW safety, which means either crash prevention or increased protection from injuries for PTW riders. Finally, a conclusion of significant findings from the literature review is presented, along with future research directions.
1.3 Review methodology
Our literature review focused on the most recent and authenticated studies that have been published in the last three decades (year 1990–2020) related to PTW riding behavior and safety. A comprehensive search was carried out through online search engines: Google Scholar, sciencedirect, and tandfonline. Keywords for the search included rider behavior, PTW safety, motorcycle, naturalistic riding studies, motorcycle rider behavior questionnaire, and so on (Table 1). Further, backward referencing was done to find additional literature on PTW riding behavior and safety, which was missed in initial searches. In this evaluation, studies have to confirm the following selection benchmarks (Ⅰ) focus on the PTW rider behavior only, (Ⅱ) related to PTW safety strategies, and (Ⅲ) peer-review by journal articles, books, conference proceedings, or reports. After reading the abstract, 138 documents, which consisted of 119 research articles, 5 reports, and 14 conference proceedings, are finalized for the present review paper. From our literature review, it has been observed that the number of research papers published related to PTW riding behavior and PTW safety has been increasing decade by decade (Fig. 2). Most of the documents are published in Accident Analysis & Prevention followed by Transportation Research Part F (Table 2).
Table 1. Topic-wise keywords and inclusion and exclusion criteria for searching studies.Topic Combination of keywords Inclusion and exclusion criteria Number of selected studies for review* Data collection and analysis methods for riding behavior Rider self-reported data-based studies • Motorcycle rider behavior questionnaire
• Self-reported riding behavior
• Motorized two-wheeler
• Behavioral factors
• Motorcycle riders, etc.• Studies related to rider's self-reported riding behavior, psychology, and personality traits are only included. 29 Simulator based studies • Riding behavior
• Motorcycle rider simulator, etc.• Studies in which riding behavior was analyzed using a motorcycle simulator are only considered for the review.
• Studies that describe the type of simulators are not considered for the review.11 Naturalistic riding studies • Riding behavior
• Naturalistic riding studies
• On-site data, etc.• Studies analyzing riding behavior in a naturalistic environment are only included in the present paper. 22 Factors affecting powered two-wheeler riding behavior Human factors • Riding behavior
• Personality
• Riding experience
• Rider education
• Perception
• Human characteristics, etc.• Studies which discuss the effect of rider's demographic characteristics (age, gender, marital status, etc.), psychology (attitude), riding characteristics (riding mileage, riding experience, riding skills, helmet use, etc.), education level, and emotions on the riding behavior are only reviewed in this section. 16 Vehicle factors • Risky driving behavior
• Vehicle power
• Motorcycle type
• Motorcycle characteristics, etc.• In this section, the studies related to vehicle factors that affect PTW riding behavior have been discussed, except the studies related to vehicle factors that affect PTW stability and handling performances. 9 Road infrastructure factors • Behavior
• Road characteristics
• Intersection type, etc.• In this section, studies related to road environment such as road geometry, road type, intersection type, traffic conditions, etc., factors that affect riding behavior are reviewed. 20 Distraction • Rider distraction
• Mobile phone
• Drinking riding, etc.• Studies related to PTW rider distraction are reviewed in this section. 20 Enforcement • Enforcement camera
• Helmet use behavior, etc.• Enforcement-related studies are included in this section 8 Strategies for improvement of powered two-wheeler safety Strategies based on riding behavior improvement • Risky riding behavior
• Rider training
• Rider education
• Rider profiling
• Riding behavior feedback, etc.• Studies that explain the strategies for the improvement of riding behavior are reviewed. 15 Strategies based on vehicle technologies improvement • Motorcycle accidents
• Braking system
• Daylight running time
• Warning system
• Airbags, etc.• Studies related to recent advancement in-vehicle technologies which enhance the PTW rider's safety and reduce the crash risk are reviewed in this section. 14 Strategies based on road infrastructure and traffic management • Motorcycle accidents
• Road characteristics
• Segregation of traffic• Studies related to improvement in road infrastructure and traffic management strategies that enhance the PTW rider's safety and reduce the crash risk are reviewed in this section. 13 Note: * some studies are commonly reviewed for more than one topic. Table 2. Number of published articles about PTW riding behavior and safety.Type of article Number of papers Reports 5 Conference 14 Research paper Accident Analysis & Prevention 43 Transportation Research Part F 17 Traffic Injury Prevention 7 Safety Science 5 Transportation Research Record 4 Journal of Safety Research 4 IATSS 4 Others 35 2. Data collection and analysis methods for riding behavior
From the literature review, it has been found that three main methods are reported to collect the riding behavior data, i.e., self-reported data, simulator-based studies, and naturalistic driving studies. The reported methods are fundamentally different in their approach, and each method has its merits and demerits. In this section, all three of these methods are discussed.
2.1 Rider self-reported data-based studies
The self-reported survey has become a supportive tool for examining riding behavior worldwide (Bui et al., 2020) because of the infeasibility of other data collection methods, such as direct observation and police records. Self-reporting is a method in which riders are asked about their feeling, attitudes, and beliefs to understand the rider's behavior while riding. These data are collected through questionnaires, interviews, or polls without any interference from the respondent. The self-reporting of riding behavior acts as a useful tool in such cases when collecting riding data by direct observations and official records is not possible (Sakashita et al., 2014). In past studies, the self-reported method has been used commonly to understand riding behavior (Dandona et al., 2006; Elliott et al., 2007; Rathinam et al., 2007). Mannering and Grodsky (1995) conducted a survey to understand the PTW rider's self-assessment of risk by floating a questionnaire. Lin et al. (2004) conducted a study using a self-reported questionnaire survey to investigate the effect of crash experience on the risk-taking behavior of riders. The survey questionnaire consisted of three sections: rider's characteristics, crashes experienced by participants over the study period, and risk-taking behavior. Elliott et al. (2007) developed a motorcycle rider behavior questionnaire (MRBQ); a 43-item questionnaire pool was used to understand riding behavior. The MRBQ provides a report of how a rider reacts in various traffic situations, such as overtaking, negotiating a curve, etc. It is applied to identify the behaviors that increase the probability of PTW crashes. The participants were also questioned to report their demographic and past crash information. All the items were subjected to exploratory factor analysis to categorize the riding behavior in different factors, and the 5-factor solution was adopted using the scree plot method. The factor solution represents the correlations between the items (questions) and the factors (i.e., a broad category of aberrant riding behavior) and clusters the correlating items in a single factor. It was reported in the study that riders with higher riding mileage and young age riders are associated with higher crash risk, and traffic error behavior was the leading cause of all crashes (Elliott et al., 2007).
Subsequent to the MRBQ's development, researchers have adapted and expanded it, proposing various factor structures tailored to different geographical conditions and sample sizes. For instance, Sakashita et al. (2014) proposed a four-factor structure for Australian novice riders, consolidating unintentional mistakes and handling lapses into a single "Error" factor, whereas the original MRBQ by Elliott et al. (2007) had separate "Traffic Error" and "Control Error" factors for these elements. Numerous studies have explored relationships between demographic characteristics, riding behaviors, and past accident involvement using regression techniques. Riding exposure, measured in riding hours per week, and age emerged as significant demographic factors affecting PTW riders' crash risk. Past research indicates that crash risk rises with increased riding exposure but decreases with age (Elliott et al., 2007; Özkan et al., 2012). Using the MRBQ, several studies found high associations between errors, speed violations, and crash risk (Elliott et al., 2007; Sakashita et al., 2014; Vlahogianni et al., 2012). Özkan et al. (2012) identified stunt performance as a primary predictor of active accidents and traffic offenses among Turkish riders. Similarly, Stephens et al. (2017) reported stunts as a unique factor linked to crash involvement among Australian riders.
Most MRBQ studies have been conducted in developed countries like Australia (Sakashita et al., 2014; Stephens et al., 2017), Slovenia, and the United Kingdom (Elliott et al., 2007), or in regions where PTWs are used primarily for leisure, such as Iran, and Turkey (Özkan et al., 2012). Consequently, there's a necessity to validate and adapt the MRBQ for developing countries with a high dependency on PTWs. Recent studies have begun addressing this gap by investigating PTW rider behavior in developing countries like Thailand and Vietnam (Bui et al., 2020). However, inconsistencies in results across these studies underscore the need for revising and validating the MRBQ to ensure its applicability across diverse cultural and geographical contexts. The available literature related to MRBQ is summarized in Table 3.
Table 3. Summary of literature related to MRBQ studies.Location Reference Questionnaire structure Factor structure Result Items in MRBQ Demographic characteristics Other data United Kingdom Elliott et al. (2007) 43 Age, gender, riding experience (yr.), and riding mileage (km per yr.) Self-reported crash data 5 factors (traffic errors, speed violations, stunts, safety equipment, and control errors) • Crash risk increases with rider exposure and decreases with age and experience.
• In the case of all crashes, traffic errors are the main predictor of crash risk.
• In the case of blame crashes, speed violations and control errors are significantly related to crash risk.Netherland Steg and van Brussel (2009) 43 Age, gender, riding experience (yr.), riding mileage (km per week) Self-reported crash data 3 factors (errors, lapse, violation) • All three factors do not significantly predict the crash involvement of riders.
• Demographic characteristics of riders such as age, gender, riding experience, and riding mileage also do not significantly affect the crash involvement.Taiwan, China Cheng and Ng (2010) 19 Age, gender, riding experience (yr.), riding mileage (km per yr.), and education level Self-reported crash data 2 factors (aggressive violation, ordinary violation) • Aggressive violations of riders are strongly associated with overtaking, whereas ordinary violations are associated with speeding and reckless driving.
• Riders having past crash records are more likely to perform risky riding behaviors.Turkey Özkan et al. (2012) 43 Age, gender, riding experience (yr.), riding mileage (km per yr.), and education level Self-reported crash data, self-reported offences data 5 factors (traffic errors, speed violations, stunts, safety equipment, and control errors) • Crash involvement increases with rider mileage and decreases with age.
• Stunts are the main predictor of active crashes and offenses.
• Speed violation is also related to offenses.Australia Sakashita et al. (2014) 43 Age, gender, riding experience (yr.), riding exposure (hours per week.) Self-reported crash data, police-reported crash and offense data 4 factors (errors, speed violation, stunts, and protective gear) • Stunts are a significant predictor of police-recorded crashes.
• Speed violations and errors are significantly related to the self-reported crash and near-crash involvement.
• Protective gear is significantly related to police-recorded offenses.Australia Stephens et al. (2017) 29 Age, gender, riding experience (yr.), riding exposure (hours per week), marital status, and employment level Self-reported crash data, self-reported traffic violation data 5 factors (traffic errors, speed violations, stunts, protective gear, and control errors) • Stunts are the main predictor of crash involvement.
• Speed violations and control errors are significantly related to near-crash involvement.
• Male riders are more likely to perform speed violations and stunts as compared to female riders.MRBQ is used to explore the different types of behavior performed by riders. Further, to investigate the psychological factors affecting riding behavior, several behavioral decision theories, such as the health
Belief model (HBM), the theory of reasoned action (TRA), the theory of planned behavior (TPB), and an extended theory of planned behavior have been reported in the literature (Chen and Chen, 2011; Chorlton et al., 2012; Nguyen et al., 2020; Özkan et al., 2012; Susilo et al., 2015; Tunnicliff et al., 2012; Watson et al., 2007). The HBM was developed in the 1950s to understand people's beliefs about preventive disease initiatives (Janz and Becker, 1984). HBM essentially consists of two main components, i.e., threat perception and behavioral evaluation. Threat perception further contains two sub-components, which are perceived susceptibility and anticipated severity; the behavioral evaluation model also has two sub-components, viz., perceived benefits and perceived barriers (Janz and Becker, 1984). Further, two more components were added to HBM, i.e., cues to action and health motivation (Özkan et al., 2012). One of the earliest studies carried out by Rutter et al. (1995) and Rutter and Quine (1996) used the HBM to examine the psychological factors associated with riding behavior. Özkan et al. (2012) studied the factors affecting riding behavior using HBM and reported that each component of HBM was significantly associated with a different type of riding behavior. The HBM was based on health beliefs, whereas some researchers postulate that intentions are the most proximal determinant of behavior (Ajzen and Fishbein, 1980). Therefore, the Theory of Reasoned Action (TRA) was developed based on intensions to action (attitudinal and normative beliefs). Riders consider the consequences of their action while riding through a reasoned process, which ultimately expresses the intention and riding behavior governed by intentions (Watson et al., 2007). Rutter et al. (1992) studied the riding behavior based on the TRA theory using a postal survey. The self-reported behavior of riders was categorized into three main categories: law-breaking, carelessness, and safety equipment and training, and it was reported that the attitudinal beliefs were significantly associated with these behaviors, whereas normative beliefs were not. Further, in another study, Rutter et al. (1995) observed that behavioral belief (being a safe rider) was negatively associated with law-breaking behavior, while normative belief (taking care) was positively associated with law-breaking behavior. TRA components are a good predictor for the actions, which underline individual volition control (Ajzen and Fishbein, 1980; Fishbein and Ajzen, 1975; Fishbein, 1979). However, some other factors which are outside the individual's volition control may also affect riding behavior. Therefore, to take into account such factors, which include perceived control over the action, the theory of planned behavior (TBP) was formulated (Ajzen, 1985).
The TPB incorporated a new determinant of intention, i.e., perceived behavioral control (PBC), which includes factors that are perceived to be not entirely under the individual's volition control and are produced from control beliefs. Studies revealed that the TPB factors successfully predict traffic violations such as speeding (Özkan et al., 2012; Steg and van Brussel, 2009; Watson et al., 2007), red-light running (Satiennam et al., 2018), and mobile phone use (Widyanti et al., 2020). However, many researchers argued that subjective norms used in TBP are weak in predicting people's intentions, and therefore, the norms were re-conceptualized to predict other social influences effectively (Terry et al., 1999; Terry and Hogg, 1996). Some studies nominated specific groups (e.g., other drivers) as normative belief representatives to strengthen the subjective norm component (Gordon and Hunt, 1998; Haglund and Aberg, 2000; Parker et al., 1992) whereas other studies have extended the TPB by adding social influencing components such as group norms (Terry and Hogg, 1996). In addition to social influences, self-identity influences (e.g., a wife, a mother) and personal influences like sensation seeking and aggression were also added to the TPB model to predict the psychological factors which affect riding behavior correctly (Chen and Chen, 2011; Elliott, 2010; Tunnicliff et al., 2012).
2.2 Simulator based studies
It is essential to capture the rider's action in actual road conditions to identify the factors which affect the riding behavior. However, it is not always possible to capture riding behavior in real conditions, especially in a situation that could compromise other road user's safety. As a result, simulators have been invented and continued to be improved as research tools. Simulators provide an artificial environment in which riders can experience the natural environment's features (Stedmon et al., 2009). Honda developed the first riding simulator for riders training to obtain a motorcycle license for the Japanese government (Yamasaki et al., 1998). Riding simulators can be categorized into three different types based on the configuration: reduced motion simulators, parallel platform-based simulators, and serial platform-based simulators (Nehaoua et al., 2011; Vu et al., 2020). Riding simulators have been used in an extensive range of research to understand the rider's behavior in complex situations (Irwin et al., 2017). Studies evaluating riding behavior using a simulator focused on hazard perception and responses (Liu et al., 2009; Nugent et al., 2019), speed or lane positioning (Crundall et al., 2008, 2012; Di Stasi et al., 2011; Sager et al., 2014), drinking riding (Filtness et al., 2013; Vu et al., 2020), visual distraction (Grahn and Kujala, 2018), braking behavior (Grottoli et al., 2020; Lenkeit et al., 2011), response to different warning systems (Huth et al., 2012), rider's workload assessment (Will and Schmidt, 2015) and sensation-seeking behavior (Gianfranchi et al., 2017). Liu et al. (2009) compared the hazard perception abilities of experienced and inexperienced riders using the Honda riding simulator. In this study, three response variables (crash, rider performance after the hazardous event, and rider speed near hazard locations) were evaluated. Further, it has been concluded that the experienced riders showed more excellent responses to hazards compared to inexperienced or novice riders.
Similarly, Di Stasi et al. (2011) conducted a study on riders' hazard perception to examine the impact of experience and training. The study analyzed performance data, including crashes, speed, and steering wheel behavior, along with eye movement data. The study revealed that the experience and training had a positive impact on rider response to a hazard situation. Similar findings were also reported by Crundall et al. (2014). Nugent et al. (2019) studied the steer responses of riders to unexpected collision hazards using a simulator. The study stated that the results provide a worthy representation of realistic rider inputs in response to the unexpected appearance of a collision hazard. In line with the previous studies, Crundall et al. (2012) also assessed the riding behavior while negotiating bends to assess the influence of experience. It has been reported that all riders decreased their speed to avoid the hazard. Experienced riders follow the racing line while negotiating a curve. As a result, they have to make severe changes in their position in response to hazards.
In contrast, advanced riders choose the safest road position that results in them not needing to change their position to avoid a collision. Novice riders behave the same as an experienced rider in the case of left-hand bend and the same as advance riders in the case of right-hand bend. Numerous studies have evaluated riding performance and hazard response while under the influence of alcohol using simulators. These studies have found that as blood alcohol concentration (BAC) levels increase, the mean speed of riders, brake reaction time, acceleration at green traffic lights, deceleration at red traffic lights, and frequency of lane changes also increase, while the average lateral overtaking distance decreases (Filtness et al., 2013; Vu et al., 2020). Studies also observed psychological factors such as sensation-seeking and decision-making, which alter the riding style with the help of a riding simulator. It has been found that lousy decision-makers with higher sensation-seeking scores are more likely to perform risky riding behaviors (Gianfranchi et al., 2017).
2.3 Naturalistic riding studies
Naturalistic driving studies (NDS) are commonly used as a research method to understand driver behavior in natural conditions, i.e., in an unobtrusive driving environment, without any experimental control influencing driver's behavior. The NDS allows researchers to perceive driver behavior with high accuracy and validity (Foss and Goodwin, 2014; Neale et al., 2005) and helps in advanced understanding of driver behavior in various situations (Dingus et al., 2006). Several types of large-scale NDS, such as the 100-Car Naturalistic Driving Study, SHRP2, or Ozcandrive, have been conducted to understand the behavior of passenger car drivers. However, fewer studies have been performed to understand the naturalistic behavior of PTW riders as compared to car drivers (Will et al., 2020). The motorcycle safety foundation conducted the first large-scale naturalistic riding study (NRS) in the United States of America. In this study, 100 instrumented motorcycles were used to collect video and vehicle dynamics data to understand the crash risk and to identify factors such as environmental, technical, and behavioral factors that affect the motorcycle crash risk (Williams et al., 2016). Likewise, a European naturalistic riding study was conducted with similar objectives to recognize the risky situations in the case of novice riders (Aupetit et al., 2016). Espié et al. (2013) discussed the challenges and advantages of NRS. They reported that the NRS requires special preparation due to the less space available for mounting equipment and the impact of environmental situations such as rainfall and highly dynamic movements. In Past studies, various devices such as the global positioning system (Yuen et al., 2014), accelerometer (Williams et al., 2016), speed detector devices (Kumphong et al., 2019; Vavryn and Winkelbauer, 2004), video cameras (Barmpounakis et al., 2014; Jensupakarn and Kanitpong, 2018; Manan et al., 2017; Patil and Sangole, 2016), and radar/LiDAR sensors (Creaser et al., 2009; Satiennam et al., 2020) have been used by researchers to analyze the naturalistic riding behavior of riders. These devices continuously collect extensive data from the PTW user, vehicle, and surroundings to observe the rider's behavior. However, the rider might change their behavior in the presence of these devices on the vehicle as they are aware that their actions are being detected. It is also claimed that riders overlook that their actions are being recorded after some time (Regan et al., 2013). In most naturalistic riding studies, only GPS or video cameras are used to study a specific riding behavior parameter. However, to understand accurately the factors affecting rider behavior, highly instrumented PTW has to be used.
2.3.1 Instruments used for collecting naturalistic riding data
2.3.1.1 Video camera
Video cameras are used to collect naturalistic riding data of riders and to understand the interaction behavior of PTW riders with the surroundings. In most of the NRS, video cameras were installed on-site to collect data like the presence of companion passengers (Patil and Sangole, 2016), traffic violations (Chen et al., 2015; Jensupakarn and Kanitpong, 2018), speed data (Manan et al., 2017), helmet usage, headlight usage, and turning movement at the access point (Manan and Varhelyi, 2015). Some studies used the PTW equipped with video cameras to collect surrounding information like road characteristics, riding maneuvers, interaction with other vehicles, and special events (Will et al., 2020). In the large-scale naturalistic riding study "2-wheeler behavior and safety (2-BE-SAFE)", two video cameras were installed to capture the frontal environment (requiring a minimum 90° field of view) and the rider's face (Vlahogianni et al., 2011). In contrast, five-color cameras (forward, rear, right side, left side, and rider face) were used in the MSF 100 naturalistic riding study. Fig. 3 presents a typical layout of the camera setup used in the MSF100 naturalistic riding study.
![]() Figure 3. Layout of camera setup used in MSF100 naturalistic riding study (Williams et al., 2016).
Figure 3. Layout of camera setup used in MSF100 naturalistic riding study (Williams et al., 2016).2.3.1.2 Global positioning system (GPS)
Global positioning system (GPS) is a specialized satellite-based radio navigation system used to track the vehicle location in real-time concerning mapping. GPS devices have been used to get data such as riding mileage, speed, lateral movement, and curve radius (Creaser et al., 2009; Yuen et al., 2014, 2015). In past studies, different types of GPS devices have been used to collect naturalistic data, ranging from hand-held mobile devices (Manzoni et al., 2010) to highly accurate tools like V-box (Neale et al., 2016). Fig. 4 presents a typical GPS communication process.
2.3.1.3 On-board diagnostic logger
On-board diagnostics (OBD) loggers are the devices used to log data from the vehicle which collect data regarding vehicle dynamics (e.g., speed, acceleration, turn rates, and lean angle) and vehicle handling (e.g., clutch lever position and usage of indicator) (Will et al., 2020). These loggers record data from the vehicle's control area network (CAN) system, attached to the vehicle's engine control unit (ECU), and recording starts automatically with engine ignition. OBD loggers are commonly used in cars because of the availability of the CAN bus system. Unfortunately, the implementation level of the CAN bus system in PTW is not that high (Toman et al., 2020). However, some higher-class PTW manufacturers are also providing CAN bus systems in PTW.
2.3.1.4 Sensor
OBD sensors record data via vehicle CAN bus, but most of the PTWs do not come with the CAN bus system. Therefore, researchers have used a variety of independent sensors, including accelerometer, inertial measurement unit (IMU), and radar/LiDAR sensors to collect naturalistic riding data (Creaser et al., 2009; Espié et al., 2013; Satiennam et al., 2020; Walton and Buchanan, 2012; Yuen et al., 2014, 2015). In past studies, sensors, such as steering, throttle activation, and brake reaction, have been used to measure the data. Additionally, an inertial measurement unit (IMU) has also been used by researchers to record the acceleration and rotation of PTW in three axes (Creaser et al., 2009; Espié et al., 2013; Yuen et al., 2015). IMU consists of an accelerometer and gyroscope, which can measure acceleration in three axes along with the angular rate, angular altitude, and yaw rate (Boubezoul et al., 2019).
Researchers used the ultrasonic distance sensor to measure the rider's lateral position and headway between the front vehicle and PTW during the overtaking maneuver (Ibrahim et al., 2018). In the 2-BE-SAFE study, one IMU unit and several sensors were mounted on PTW to measure the throttle position, 3-axis acceleration, 3-axis rotation (roll, pitch, and yaw), handlebar rotation, and brake lever activations (Phan et al., 2010). In this study, sensors were mounted on the front-wheel, rear-wheel, under the saddle, and under the panel to record the brake pressure, throttle position, and steering angle. Apart from these sensors, which were mounted on PTW, various researchers have used different devices with an in-built sensor such as radar gun, light beam, and infrared traffic beams. These devices are typically installed at the study site rather than on a vehicle to analyze riding behavior (Kumphong et al., 2019; Vavryn and Winkelbauer, 2004; Walton and Buchanan, 2012).
2.3.2 Riding behavior analysis
Researchers adopted various methods for analyzing riding behavior in the naturalistic environment, which can be categorized based on the installation of data collection devices, i.e., vehicle-based and on-site studies. The onsite devices capture the aggregated riding behavior, whereas the vehicle-based devices capture individual rider's riding behavior. The methods adopted under the above two categories of analyzing riding behavior have been discussed in the following subsections.
2.3.2.1 On-site studies
In an on-site study, naturalistic riding data is collected on a particular site using devices such as radar guns, infrared beam sensors, and static video cameras installed near the road facility (Chen et al., 2015; Kumphong et al., 2019; Vavryn and Winkelbauer, 2004; Walton and Buchanan, 2012). Understanding the speeding behavior of riders is necessary because speeding is one of the significant factors associated with road crashes. Therefore, researchers have used videography data to examine the speed of riders (Manan et al., 2017; Manan and Varhelyi, 2015). In Thailand, Jensupakarn and Kanitpong (2018) used the binary logit regression model for data extracted from videography data to understand the factors affecting the red-light running behavior of riders at signalized intersections. This study reveals that not only human factors but road infrastructure factors also influence the rider's red-light running behavior. Kumphong et al. (2019) performed a study in Khon Kaen City, Thailand, to examine the change in speeding behavior under the speed enforcement cameras using the radar gun. This study demonstrated that the 85th percentile speed of PTW decreases under the speed enforcement cameras. Researchers also compared the speed of PTWs with other vehicle types while approaching intersections and found that PTWs travel significantly faster than cars and other vehicle types (Walton and Buchanan, 2012). In the urban area of Taoyuan City, Taiwan, China, Chen et al. (2015) also examined the rider's red-light running behavior at the intersection with a pedestrian green signal countdown device (PGSCD). It has been observed that riders violated the red-light with higher speed in case of the intersection with PGSCD as compared to a typical intersection. Patil and Sangole (2016) studied the gap acceptance behavior of Indian riders using videography data at an uncontrolled T-intersection. This study found that the lognormal distribution displays the best fit for the accepted gap distribution curve. This study revealed that the human factor (age, gender) and conflicting vehicle type affect the gap acceptance behavior of riders.
2.3.2.2 Vehicle-based studies
In vehicle-based studies, an instrumented PTW is used to collect naturalistic riding data. Data logger devices are attached to the CAN bus system, which collects data via the vehicle's engine control unit, and some additional sensors and cameras are also mounted on PTW. The instrumented PTW is a key tool as it offers a robust, precise, and consistent way of collecting such PTW riding data in the analysis of riding behavior (Yuen et al., 2014). Yuen et al. (2014, 2015) analyzed the riding behavior on the speed table and at curve entry. Their findings indicated that the speed decreases while approaching the speed table and entering the curve; the inference was an output of the multiple regression models. Also, factors that influence the speed and braking behavior on the speed table and at curve entry were analyzed using structural equation modeling. Will et al. (2020) used data collected from the CAN bus system and video cameras mounted on PTW for riding profiling based on the use of a g-g diagram (combination of lateral and longitudinal acceleration). Additionally, a three-phase approach was implemented, i.e., a pilot study to define setup and check the g-g diagram's feasibility, a controlled main study to define experimental techniques, and a naturalistic riding study. Creaser et al. (2009) used an instrumented PTW equipped with sensors and IMU to measure the riding performance under the influence of alcohol. Study' observations indicated that the effect of alcohol on riding performance would be more evident while performing complex tasks.
3. Factors affecting powered two-wheeler riding behavior
In literature, riding behavior has been recognized as a critical factor associated with PTW crashes (Lin and Kraus, 2009). Riding behavior attributes such as traffic violation, speeding, lane changing behavior, stopping distance, response time, reckless overtaking, and handling errors are dependent on various factors like age, gender, rider experience, education, use of mobile phones while riding, and many more. For ease of understanding, the various factors affecting riding behavior have been classified into different categories, i.e., human factor, vehicle factor, road infrastructure factor, education, and enforcement (Creaser et al., 2009; Di Stasi et al., 2011; Green, 2006; Rutter and Quine, 1996; Susilo et al., 2015; Yoshida and Koyanagi, 2018). In this section, all these factors have been discussed and summarized in Table 4.
Table 4. Summary of the literature on factors affecting PTW driver behavior.Study Location Factor Driver performance parameter Result Jensupakarn and Kanitpong (2018) Thailand Human factor: age and gender Red light running (violation) behavior Younger drivers and male drivers have a higher tendency to violate red light as compared to older drivers. Chang and Yeh (2007) Taiwan, China Human factor: age and gender Safety Check, violation of traffic rules, driving skills, Young and male riders are most likely to disobey the traffic regulations.
Young riders neglect safety checks.
Young male riders have better driving skills than young female riders.Lardelli-Claret et al. (2005) Spain Human factor: age, gender, and driver experience Risk of causing a collision Younger drivers (age < 15), older drivers (age > 74), and male drivers tend to a higher risk of causing a collision.
The use of a helmet decreases the risk of causing a collision.
No significant effect of driver experience on the risk of collision.Rutter and Quine (1996) United Kingdom Human factor: age and driver experience Violation of traffic rules Younger drivers (age < 19) frequently break the rules, and lack of experience is not the leading cause for violation. Watson et al. (2007) Australia Human factor: age and emotion Handling errors Handling errors increases with a tendency to engage in sensation-seeking and aggressive riding and with increasing age. Chen (2009) Taiwan, China Human factor: gender and emotion Speeding and traffic rule violation Drivers with a high score of anger, sensation seeking, and normlessness have an increased tendency to engage in unsafe driving behavior (speeding and rule violation).
Male drivers are more likely to conduct risky riding behaviors than female drivers.Wong et al. (2010) Taiwan, China Human factor: gender and personality traits Risky driving behavior (violation and speeding) Male riders are more likely to engage in risky driving behavior than female riders.
Personality traits like sensation seeking, impatience, and amiability significantly affect driver behavior.Di Stasi et al. (2011) Spain Human factor: education Riding skills Virtual training programs improve the riding skills of riders. Mullin et al. (2000) New Zealand Human factor: age and driver experience Crash risk Younger riders are at a higher crash risk, whereas the impact of driver experience on crash risk is not significant. Goldenbeld et al. (2004) Netherlands Human factor: education and training Safe driving behavior Trained riders drive more safely as compared to non-trained riders. Yoshida and Koyanagi (2018) Cambodia Human factor: education Speed and lane-changing behavior Travel speed decreases, and the frequency of lane changing increases after safety workshops. Truong et al. (2018) Vietnam Human factor: gender Speeding and reckless overtaking Higher instances of speeding, drink driving, and reckless overtaking were observed for male participants. Rathinam et al. (2007) India Human factor: emotion Crash risk Aggressive attitudes and tailgating are associated with higher crash risk. Susilo et al. (2015) Indonesia Human factor: age, gender, and marital status
Enforcement: punishment
Education: campaigningTraffic violation Younger drivers and married drivers are more frequently violate traffic regulations, whereas male drivers are less likely to violate traffic regulations.
Road environmental factors more influence the violation behavior of drivers as compared to human factors and vehicle factors.
Riders do better respect and obey the law after improvement in law enforcement.Green (2006) United States Vehicle factor: braking system Stopping distance Powered two-wheelers equipped with the anti-lock braking system take less distance for stopping during braking events. Manan et al. (2017) Malaysia Vehicle factor: overload Speed Overloaded motorcycles are less likely than those not overloaded to ride with excessive speed. Preusser et al. (1995) United States Distraction: alcohol Ran-off road crash Ran-off road crashes mainly occur under the influence of alcohol. Truong et al. (2019) Vietnam Distraction: mobile phone use Crash risk Crash risk increases with the use of a mobile phone while riding. Kasantikul et al. (2005) Thailand Distraction: alcohol Inattention, speeding Drinking riders are inattentive to the driving task.
Drinking riders drive faster than sober riders.Creaser et al. (2009) United States Distraction: alcohol Response time, vehicle control Drinking drivers demonstrate a longer response time.
The effect of drinking on vehicle control is moderate.Wang et al. (2012) China Road infrastructure factor: road facilities, traffic characteristics Violation behavior Violation behavior of drivers is more influenced by road environmental factors as compared to human factors and vehicle factors. Minh et al. (2005) Vietnam Road infrastructure factor: dedicated lane Passing maneuver During passing maneuvers, the speed of riders was higher while driving in a dedicated two-wheeler lane compared to driving on an undivided road. Ibrahim et al. (2018) Malaysia Road infrastructure factor: lane width, presence of guardrail Overtaking speed, lateral position Lane width and road configuration significantly affect the lateral position of riders.
Road configuration affects the overtaking speed, whereas lane width does not affect the overtaking speed significantly.Dandona et al. (2006) India Enforcement: traffic law enforcement, helmet use, vehicle condition check, Crash risk, violation behavior Crash risk and violation activities can be minimized by implementing effective enforcement policies. 3.1 Human factors
Human factors include rider's demographic characteristics, psychology, riding characteristics, and education level. Several studies have demonstrated that human factors such as age, gender, rider experience, helmet use, education, and emotion are associated with the risk-taking behavior of riders (Chen, 2009; Cheng and Ng, 2010; Goldenbeld et al., 2004; Lardelli-Claret et al., 2005). Petridou and Moustaki (2000) stated that the contribution of human factors in road crashes is 95%. From past studies, it has been observed that rider's demographic factors significantly affect rider's performance. Many studies revealed that younger riders are more likely to be involved in traffic violations and speeding as compared to mid-age and older riders (Jensupakarn and Kanitpong, 2018; Tunnicliff et al., 2012; Yeh and Chang, 2009) because of overconfidence, impatience, and sensation-seeking behavior (Wong et al., 2010). Mannering and Grodsky (1995) reported that riders with age 40 years or older perceive themselves as being more likely to be in the low-risk taking category as compared to other age group riders. In another study, Mullin et al. (2000) found that the younger riders are at higher crash risk and suggested that the license policies should emphasize age rather than rider experience. In terms of gender, it was observed that male riders have a higher tendency to disobey traffic rules than female riders (Chang and Yeh, 2007; Chen, 2009; Wong et al., 2010). Truong et al. (2018) conducted an online survey in Vietnam to collect data regarding risky riding behavior and observed that male participant's involvement in speeding and reckless overtaking is higher as compared to female participants. Lardelli-Claret et al. (2005) observed in a study that younger riders (age < 15), older riders (age > 74), and male riders are at a higher risk of causing a collision. Mannering and Grodsky (1995) observed that female riders are less likely to consider themselves in the high-risk category and reported that the likelihood of perception of crash risk increases with riding experience. Savolainen and Mannering (2007a) studied the rider's injury severity in single- and multi-vehicle crashes and found that female riders and riders with older age are more likely to be involved in injury crashes as a result of their irregular riding behavior.
The review of the literature also shows that the rider's emotional conditions also influence riding behavior (Mehrotra et al., 2016; Venkatesh and Kumar, 2020). It has been examined that risky rider intentions are influenced by aggressive and sensation-seeking behavior (Watson et al., 2007; Wong et al., 2010). Mehrotra et al. (2016) studied the effect of anger on riding behavior by using the self-reported method and found that anger is one of the causes of speeding. In some of the studies, it has been understood that the rider experience does not play a significant role in altering riding behavior (Lardelli-Claret et al., 2005; Mullin et al., 2000; Rutter and Quine, 1996). On the contrary, Haworth and Mulvihill (2005) reported an interesting fact that novice PTW riders should gain experience to reduce crash risk. Yoshida and Koyanagi (2018) examined the effect of training workshops on riding behavior and reported that training workshops improve the ability of the riders to understand the hazard situation, which leads to safe riding behavior, and similar findings were reported by Goldenbeld et al. (2004) and Di Stasi et al. (2011).
3.2 Vehicle factors
Studies report that the types and characteristics of PTW affect road crash severity (Teoh and Campbell, 2010; Vlahogianni et al., 2012). In recent studies, it has been observed that stopping distance may be reduced by improving the braking system of PTW, such as an anti-lock braking system, combined brake system, etc (Green, 2006; Vavryn and Winkelbauer, 2004). Manan et al. (2017) observed the effect of PTW characteristics (PTW type, engine capacity, color, overloaded, etc.) on speeding behavior using MECHROM software. The study determined that PTW with high engine capacity and bright colors are more likely to be associated with excessive speed. Various studies have shown that PTW with high engine capacity has a higher crash risk than PTW with lower engine capacity (Broughton et al., 2009; Teoh and Campbell, 2010; Yannis et al., 2005). Thomson (1980) and Williams and Hoffmann (1979) concluded that headlight increases the visibility and level of conspicuity of PTW to the other vehicles, which finally decreases the crash risk. Vlahogianni et al. (2012) reported that in-vehicle technologies like systems for collision avoidance, electronic stability control, lane departure warning/lane-keeping support, automatic stopping of the vehicle, etc., increase the awareness of PTW riders towards traffic conditions. The red light behavior of PTW riders is associated with a vehicle's gear system. PTW riders with a manual gear system are more likely to run the red light because of higher acceleration capability as compared to riders with an automatic gear system (Jensupakarn and Kanitpong, 2018).
3.3 Road infrastructure factors
Studies show that road infrastructure such as type of road network (Lin et al., 2004), road geometry and roadside facilities (Elliott et al., 2003; Preusser et al., 1995; Sexton et al., 2004), type of intersection (Crundall et al., 2008; De Lapparent, 2006; Haworth and Mulvihill, 2005), lighting facilities (Pai and Saleh, 2007, 2008; Savolainen and Mannering, 2007a; Wanvik, 2009), traffic control measures, traffic condition, and pavement surface condition (Cossalter et al., 2007; Haque et al., 2009; Shankar and Mannering, 1996) are a few of the major influential factors that affect the risk of PTW crash.
The type of road network has a significant impact on the rider's speeding behavior. The mean speed of riders on the primary roads has been found to be higher as compared to other roads (Manan et al., 2017). Manan and Varhelyi (2015) observed the PTW rider behavior on access points on primary roads and reported that PTW riders reduced their speed while entering primary roads. The study also highlighted risky driving behavior like the opposite indirect right turn and low utilization of turning indicators of PTW riders. It has been observed that the distance from the curve entry point influences riding actions, such as a change in speed and brake force while riding on curves (Yuen et al., 2015). Jensupakarn and Kanitpong (2018) reported that factors like vehicle traveling direction, the existence of turning lane, number of lanes, lane width, intersection sight distance, type of traffic signal pole, type of traffic signal operation, length of the yellow time interval, approaching speed, distance from intersection warning sign to stop line, and pavement roughness significantly affects the red light running behavior of PTW riders. Wang et al., 2018a, Wang et al., 2018b examined the factors affecting PTW crash risk while negotiating horizontal curves and found that the availability of proper road marking and warning systems on curves decreases the PTW crash risk. Schneider et al. (2010) demonstrated that the radius and length of each horizontal curve, shoulder width, and annual average daily traffic considerably affect the frequency of motorcycle crashes.
Evidence exists that the highest proportion of PTW crashes occurred at intersections (Pai and Saleh, 2007, 2008; Yannis et al., 2012). Walton and Buchanan (2012) observed that PTW riders travel 10% faster and have smaller headways than other vehicles while approaching intersections. Patil and Sangole (2016) investigated the PTW rider's gap acceptance behavior at T-intersections and found that the PTW riders accept shorter critical gaps as compared to other drivers. The study also revealed that the critical gap values are less for major road right-turnings than for minor road right-turnings. The researcher investigated PTW rider's red-light violation (RLV) behavior at pedestrian green signal countdown device (PGSCD) intersections and indicated that riders frequently violate the red light with higher speeds at PGSCD intersections than at typical intersections (Chen et al., 2015). Yuen et al. (2014) examined PTW riding behavior on the speed table and concluded that riders reduce their speed before reaching the speed table and achieve minimum speed at a point 10 m after the speed table. This study also revealed that the riders are more likely to apply the rear brake than the front brake while approaching the speed table.
3.4 Distraction
Several studies have reported distraction to have an impact on driver safety worldwide. According to the literature, distraction can be defined as the diversion of attention away from activities critical for safe driving/riding toward a competing action (Regan et al., 2008). Several activities such as mobile phone use (De Gruyter et al., 2017; Grahn and Kujala, 2018; Nguyen et al., 2020; Truong et al., 2018; Widyanti et al., 2020), intoxication (Filtness et al., 2013; Papadimitriou et al., 2014), and presence of pillion riders (Quddus et al., 2002), etc., are reported in the literature which distracts the PTW rider. These activities distract the attention of the rider from riding the vehicle. Strayer et al. (2014) categorized rider distraction into three categories: visual distraction (looking at a co-passenger or mobile phone), visual-manual distraction (texting, using an infotainment system), and cognitive distraction (talking on a mobile phone/co-passenger).
Numerous studies have shown that frequent use of mobile phones while riding is related to higher crash risk (Truong et al., 2019). Nguyen et al. (2020) reported the use of mobile phones as one of the common risky riding behaviors in Vietnam. Texting and searching for information on the mobile phone are more tedious tasks as compared to talking on the mobile phone, which leads to higher chances of involvement in a crash (De Gruyter et al., 2017). In a study, Grahn and Kujala (2018) compared the visual distraction effect of in-vehicle activities performed on a mobile phone and a head-up display mounted on the helmet, it was reported that the use of a mobile phone distracts the rider more as compared to a head-up display.
Drinking riding is a common factor associated with PTW crashes (Preusser et al., 1995); it also increases the crash risk of PTW riders (Lin et al., 2003). Existing studies reported that alcohol consumption decreases the rider's skill (Kasantikul et al., 2005; Soderstrom et al., 1993), and drunk riders take more time to respond, which leads to task performance error, which may lead to a crash (Creaser et al., 2009). Further, it was revealed that PTW riders are more fragile to the effects of alcohol than car drivers while riding (Lin and Kraus, 2009). These results are also supported by the fact that PTW riders are associated with crashes at lower alcohol consumption than car drivers (Voas et al., 2007). Lardelli-Claret et al. (2005) found that drinking riding is significantly associated with the risk of causing a collision. Filtness et al. (2013) studied the effect of alcohol on the PTW rider's performance in the simulated environment. They reported that alcohol consumption decreases the rider's skill, increases the response time, and does not affect the visual scanning (proportion of total glance time focused on the speedometer). In another simulator-based study, Vu et al. (2020) observed the rider's performance under the influence of alcohol and found that the average speed increases, average lateral overtaking distance decreases, lane change become more frequent, and brake reaction time lengthened considerably with the increase in the blood-alcohol-concentration level.
Few studies reported that pillion riders also cause a distraction to PTW riders. A survey by Quddus et al. (2002) highlighted that carrying a pillion rider increases the risk of a crash. However, another study by Lardelli-Claret et al. (2005) reported results that were contrary. Moskal et al. (2012) found that the effect of pillion rider presence on PTW riders depends on PTW type. Some studies show the positive impact of the company of pillion riders on PTW riding behavior. Jensupakarn and Kanitpong (2018) observed that PTW riders are less likely to violate the red light in the presence of a pillion rider.
3.5 Enforcement
Enforcement modifies the behavior of riders as a result of the process of investigation, action, and discipline. Studies suggested that enforcement is required to moderate risky riding behavior like mobile phone use, drinking riding, speeding, and traffic violations of PTW riders (Steg and van Brussel, 2009; Susilo et al., 2015; Truong et al., 2018; Venkatesh and Kumar, 2020). Kumphong et al. (2019) analyzed the speed behavior of PTW riders under the surveillance of cameras and found a significant reduction in the 85th percentile speed of PTW after the fixing of speed enforcement cameras. However, no change was observed in the mean speed. An increment was observed in the percentage of helmet use with the installation of CCTV enforcement cameras (Guzman et al., 2020; Satiennam et al., 2020). French and Gumus (2018) concluded that the ban on texting and calling while riding reduces distraction and increases PTW riders' safety.
4. Strategies for improvement of powered two-wheeler safety
There are various factors that can cause road crashes. These factors can be broadly classified into three categories: i) human error, ii) vehicle condition, and iii) road environment. These factors are the leading cause of crashes, so the strategies for improving PTW safety are based on these factors. The strategies have been discussed in the following subsections.
4.1 Strategies based on riding behavior improvement
According to MoRT & H (2021), human errors are a cause of 78% of total road crashes; these errors include violation of traffic rules, riding without a license, and non-uses of safety devices like helmets, etc. It is essential to develop strategies that can improve riding behavior to ultimately contribute to reducing the number of road crashes caused by human error. Conventionally, enforcement and education strategies were used to improve riding behavior. In the literature, researchers suggested that enforcement strategies can be useful in improving riding behavior in terms of the use of safety devices, traffic violations, speeding behavior, etc (Clabaux et al., 2012; Satiennam et al., 2018; Uy and Regidor, 2011). Many studies revealed that the helmet-use behavior of riders improved significantly after the installation of enforcement cameras (Guzman et al., 2020; Satiennam et al., 2020). A similar effect of enforcement cameras was also observed in speeding behavior (Kumphong et al., 2019; Novoa et al., 2010). Traffic violation behavior can be prohibited to some extent by police enforcement and installing surveillance cameras (Chin and Haque, 2012; Wong et al., 2010).
Rider education has also been found to be significantly associated with riding safety. Rider education points toward safety awareness programs and providing knowledge about road signage, signals, and traffic operations which only affects the riding behavior, whereas rider training teaches the rider that how should they ride in an actual road environment which improves the rider's skills. Several studies observed the impact of education on riding behavior. Wang et al., 2018a, Wang et al., 2018b studied the effect of rider education on riding behavior and found that rider education was negatively associated with risky riding behavior. Swaddiwudhipong et al. (1998) also studied the effect of rider education by conducting an interview survey after two years of the education program and found that the percentage of license-holder riders and helmet users increased. Rider training is also reported by many researchers as an effective strategy that helps to reduce crashes by improving rider skills. Savolainen and Mannering (2007b) questioned the effectiveness of riding training programs and reported that trained riders are more likely to be involved in crashes than non-trained riders as a result of increased risk-taking behavior. The research findings suggest that individuals who enroll in the Motorcycle Safety Foundation's basic rider course demonstrate a higher likelihood of being involved in PTW crashes compared to those who do not. The reason behind the negative impact of training was stated as such courses attracting riders who may inherently possess lower riding capabilities. Furthermore, it was observed that riders who take the course multiple times have significantly higher crash rates. Balusu et al. (2020) suggested that the training program should be modified to eliminate the initial high-risk period for trained riders after taking a training course, which is a result of overconfidence and experimentation seeking. The research employed Weibull hazard-based duration models to analyse the change in hazard concerning time after course completion. It observed that initially, crash risk increases but later decreases. The reason behind the initial increment was attributed to increasing exposure, initial overconfidence, and experimentation with the performance capabilities of the PTW.
Some innovative strategies like riding behavior profiling and eco-riding training are also documented in the literature, which improve riding behavior. Vlahogianni et al. (2011) studied the riding behavior using naturalistic riding data to identify the riding profile parameter and used the outlier detection method to distinguish the regular and irregular riding behavior. This study revealed that such types of parameters that are directly related to mechanical characteristics of PTW are suitable to characterize the irregular behavior from the typical behavior. Gianfranchi et al. (2018) classified the riding profiles into three main categories, i.e., imprudent rider, insecure rider, and prudent rider, using cluster analysis on a mean Z-score of 18 indices assessed through the Honda Riding Trainer (HRT) simulator. These study indices indicate that imprudent riders show less safety performance and higher chances of being involved in near-miss and crash incidents than prudent and insecure riders. Researchers also observed that driving behavior is the primary cause of erratic driving, which causes an increase in fuel consumption and vehicle emissions (Bokare and Maurya, 2013; LeBlanc et al., 2010). In the literature, many studies have reported the excellent potential of eco-driving training programs and eco-driving feedback systems in improving driver behavior. Seedam et al. (2017) studied the effect of eco-riding and the proportion of idle time on fuel consumption and greenhouse gas emission at urban signalized corridors and observed that idle time is more strongly associated with fuel consumption and greenhouse gas emission as compared to eco-riding behavior. Apart from rider profiling and eco-riding training, usage-based insurance schemes like PAYD and PHYD have also been reported to be a useful strategy for improving driver behavior (Ayuso et al., 2016; Lahrmann et al., 2012; Toledo et al., 2008). In the PAYD scheme, the insurance premium amount for the particular driver is fixed based on the total distance traveled by that drive, and in the PHYD scheme, the insurance premium amount is fixed based on driving behavior (speeding, aggressive acceleration, or deceleration, etc.). However, these types of insurance schemes will only be effective if the maximum of PTWs are insured.
4.2 Strategies based on vehicle technology improvement
The advancement of vehicle technology has complemented improving the safety of riders. Developments in the safety systems in PTW have led to a noteworthy enhancement in the survivability of PTW riders. Vehicle technologies can be categorized based on their function, such as technology (longitudinal and lateral dynamic control), conspicuity of PTW, warning systems, and protection of riders. In case of inadequate braking operation, an advanced braking system, including various breaking technologies such as an anti-lock braking system (ABS), combined braking system (CBS), and amplified braking system, increases the braking power of PTW. In the literature, a significant reduction in PTW road crashes has been noted after the implementation of ABS in PTW (Rizzi et al., 2009, 2013; Teoh, 2011; Trafikverket, 2010). Green (2006) observed the effect of ABS, CBS, and the conventional braking system on stopping sight distance performance of PTW and found that PTW equipped with ABS resulted in less stopping sight distance as compared to other braking systems. Similarly, as the braking system improves the longitudinal stability of PTW, the lateral stability is enhanced with the introduction of traction control systems (TCS). TCS acts as an anti-skidding system and potentially reduces the PTW crash (Seiniger et al., 2012). Recently, a new technology named motorcycle stability control (MSC) was introduced, which works based on a combination of ABS, CBS, TCS control, and inertial sensors. Bosch crash researchers show that the MSC system increases PTW stability and control by improving acceleration and braking power (Lich et al., 2016).
The lack of conspicuity of PTW to other vehicles is a crucial factor in crashes involving PTW. Various technologies, like headlamps on, DRL, alternative front light patterns, etc., have been used to make PTWs more conspicuous. Many researchers have proven that headlamp-on is a useful technology to enhance the conspicuity of PTWs (Elvik, 2004; Radin et al., 1996; Wells et al., 2004). Zador (1985) and Yuan (2000) studied the effect of headlamp-on on daytime crashes and reported a reduction in daytime crashes by 13% and 14%, respectively. DRLs are used as an alternative to headlamp-on and offer to reduce energy consumption. According to researchers, it is easier to detect a PTW with DRLs as compared to a PTW without DRLs (Smither and Torrez, 2010). In addition to these technologies, an alternative front light pattern (e.g., T-light configuration, triangular configuration, long-light system) is also a helpful technique that improves the conspicuity of PTWs by helping other road users to differentiate the PTW. In an experiment, Pinto et al. (2014) compared three conspicuity enhancement techniques, i.e., a triangle configuration, a helmet configuration, and a single central yellow headlight. This study observed that both the yellow headlight and the helmet configuration give better detection performance as compared to the triangular headlight configuration.
Various warning systems such as intelligent speed adaptation (ISA) systems, curve warning systems, intersection support systems, frontal collision warning systems, lane change support and blind-spot monitoring systems, and tire pressure monitoring systems are used to alert the rider in critical events. ISA is a system in which a rider is warned when the rider travels over the posted speed limit of that location or predefined threshold value of speed. In the literature, two types of ISA systems are reported, i.e., an informative ISA system and an active ISA system. In an informative system, the rider is only warned to reduce speed, whereas the vehicle speed is automatically reduced in an active system. Young et al. (2010) compared both the ISA systems on the basis of riding simulator performances and observed that riders who are using an informative ISA system spend less time exceeding the threshold values of speed as compared to a rider who is using an active ISA system. In another study, Carsten and Tate (2005) analyzed the crash reduction after mandatory use of the ISA system and reported a decrease in injury and fatal crashes by 20% and 37%, respectively. The Motorcycle Accidents In-Depth Study (MAIDS) report shows that 15%–17% of all PTW crashes occur while negotiating a curve (ACEM, 2009). Therefore, the curve warning system was designed to warn the rider by detecting their incorrect and insufficient action without any obstruction. Huth et al. (2012) evaluated the effect of two types of curve warning systems, one that gives warning by force feedback throttle (CW-th) and the other by haptic gloves (CW-hg) based on simulated riding performance and rider's feedback. It was also observed that riding with CW-hg leads to a significant reduction in the critical event frequency, while CW-th does not give consistent results. Berndt and Dietmayer (2008) reported that intersection warning systems are more reasonably contribute when the speed of PTW is around 50 km/h in comparison to speed lesser or greater than 50 km/h and that involuntary interventions on the brake system could be advantageous, especially at T-junctions when violations of right-of-way could occur. Other warning systems, viz., frontal collision and lane departure warning systems, also decrease the rider's reaction time in response to a critical situation, thereby increasing the safety of riders (Chang et al., 2009; Sato et al., 1998). On the contrary, some researchers stated that the risk-taking behavior of riders would also increase with the improvement of vehicle technology, which may mitigate the safety effects (Peltzman, 1975; Winston et al., 2006).
PTW riders not only have more risk of being involved in a crash, but they are also vulnerable because of their lack of protection. Professional riders use personal protective gear (PPG) such as helmets, jackets, boots, body armor, gloves, and elbow/knee guards, but this percentage of riders is small. Researchers have shown that the use of PPG can directly avoid injuries up to 60% for the trunk and 40% for leg protection (De Rome et al., 2011). Many studies reported that PPG only protects against light injuries like burns on the skin but does not significantly protect against severe injuries like fractures. Therefore, some new technologies like airbags and belted safety jackets have been introduced to protect the rider against severe injuries (Hell and Lob, 1993). Grassi et al. (2018) introduced belted safety jackets as a new concept and reported that it has the potential to significantly reduce the severe injuries which occur when PTW collide with a car. Airbags are commonly used in cars, whereas their penetration for PTWs is minimal. Airbags minimize the severity of injury by absorbing the kinetic energy of riders during the collision with other vehicles or stationary objects. However, some researchers stated that airbags provide limited protection to PTW riders in severe crashes (Pallacci et al., 2019; Serre et al., 2019).
4.3 Strategies based on road infrastructure and traffic management
Road infrastructure and adequate traffic management play an essential role in road safety by preventing loss of control and guiding interaction with other road users. The design of roads and traffic management is mainly based on four-wheeler vehicles, which may not be adapted by PTW in some cases. A system of self-explaining and forgiving roads is a general principle for safe infrastructure, which increases PTW safety. The self-explaining road approach uses roads that increased the visual characteristics of roads, which influences driver behavior (Theeuwes and Godthelp, 1995). The forgiving road concept was introduced to reduce or avoid the harm and severity of traffic crashes. Many researchers showed that the collision with fixed objects like trees, poles, and signs, is one of the primary causes of PTW fatalities (Bambach et al., 2012; Broughton, 2005; NHTSA, 2013). Therefore, to protect the vehicle, a series of requirements must be met under forgiving road design: remove unnecessary objects like trees or move them aside from the road, and modify the structure to make them safer for riders. Bambach et al. (2013) reported that roadside barriers have the potential to reduce the risk of severe crashes of PTWs compared to other roadside hazards, and it may be further reduced by improving barrier design.
Road assessment programs have also been developed to assess road risk systematically and to establish benchmarks that would help to reduce death and severe crashes. The main objective of such programs is to identify significant safety shortcomings on the road responsible for practical remedies. The European Road Assessment Program (EuroRAP) rated the safety of roads based on different practices, i.e., risk mapping, star rating, and performance tracking. The risk-mapping protocol tells about the color-coding of roads based on the risk of severe crashes. EuroRAP used a four-star rating system to rate the safety of roads based on road design, and the third protocol was based on the changes in road fatalities and crashes over the period (Lynam et al., 2003). Similar road assessment programs have been applied in Australia and the United States (Metcalfe and Smith, 2005). All these systems were based on safety ratings for all road users. Therefore, Daniello et al. (2010) developed a methodology to rate the safety of roads in the U.S. based on PTW crashes. The rider star rating score is calculated by adding the score for a different type of crash, which is the function of likelihood, severity, operating speed, and external flows. The roads were classified into five different categories, from low-risk roads to severe-risk roads, based on the PTW crash rate (Daniello et al., 2010). The international road assessment program (iRAP) is an umbrella program for rating the safety of roads worldwide. iRAP rates the road-based road review data to measure the level of safety which is being provided by roads for all road users.
Segregation of PTW traffic from other traffic is also a safety implication that may reduce PTW crashes by avoiding interaction with other road users. In some cities of developed countries like London (UK), Oslo (Norway), and Madrid (Spain), PTWs are allowed to use the bus lanes. It has been observed in research conducted in Paris that riding in bus lanes improves the peripheral vision of PTW riders for surrounding traffic and offers the feeling of being more protected (Maestracci et al., 2012). However, some researchers concluded that the risk of riders using bus lanes being involved in a crash is higher than the risk of riders riding in general traffic (Clabaux et al., 2014). Some Asian countries and regions like Malaysia, Taiwan, China, and Indonesia used exclusive PTW lanes to reduce the percentage of crashes involving PTW as one of the parties. In brief, exclusive PTW lane is a separate lane dedicated to riders, which isolates them from all other traffic mixes and reduces the conflict between a PTW and other road users under heterogeneous traffic complexities. The exclusive lanes provide safe and fast movement to the riders and reduce the chances of PTW crashes with other road users. In a study, it has been reported that the implementation of an exclusive lane would reduce PTW crashes by 39% (Radin et al., 2000). As a practical implemented example, the first exclusive PTW lane was constructed in Malaysia along the federal highway 2 (F02), connecting the city of Kuala Lumpur and the Subang International Airport. The overall track length measured 16 km, with the track width varying between 2.5 and 3.5 m (Radin et al., 1995). Although the implementation of exclusive PTW lanes started in the early 1970s, still, it is not very popular in developed countries; one of the primary reasons for this to happen is the low share of the PTWs in road traffic when compared to the Asian countries.
5. Conclusions and future research direction
PTW safety is plagued by issues such as a lower tendency to use safety equipment, speeding, traffic violations, use of mobile phones, low level of police enforcement, and non-consideration of PTW safety in road designs. Our literature review focuses on identifying factors related to rider behavior and existing methods for analyzing rider behavior. Some of the critical findings of this paper that may help in improving PTW safety are given as follows.
• Naturalistic riding studies (NDS) have emerged as an accurate method for evaluating riding behavior. However, it has some limitations also, such as research related to drinking driving cannot be performed in a naturalistic environment, whereas simulators are helpful in these types of studies.
• Rider's response time and ability to control the PTW decreases with an increase in age. However, old-age riders drive safely by riding at a lower speed and maintaining longer headways than younger riders, who have higher crash risks due to higher sensation-seeking behavior.
• Strict enforcement policies discourage traffic violation behavior and encourage riders to drive safely by following traffic rules. Riding behavior can also be improved by giving the riding feedback to the riders about their riding behavior. However, more research is needed to analyze riding behavior under naturalistic conditions to make the feedback system more effective.
• An advanced rider assistance system that is a combination of sensors, brake systems, and warning systems has the potential to prevent the collision of PTWs with other road users and roadside objects by alerting the rider under inadequate conditions.
• In such countries where the percentage share of PTWs is very high, segregation of PTWs from main traffic proved to be an effective strategy in reducing the PTW's crashes.
Despite the enormous literature available on riding behavior and PTW safety, some areas regarding PTW safety are still unexplored. While the majority of NDS have been conducted under homogeneous traffic conditions, there is a scarcity of research depicting the impact of driver behavior on a vehicle's lateral and longitudinal parameters in heterogeneous traffic conditions. Furthermore, the existing studies primarily concentrate on analyzing the driving behavior of heavy commercial vehicles and cars. Limited literature is available where the riding behavior of PTW riders is examined. Thus, it is recommended that future research should emphasize exploring the riding behavior of PTW riders, particularly in Asian countries. In these regions, the significant prevalence of two-wheelers in traffic renders them susceptible to road accidents.
The impact of heightened workload on drivers and the strategies they employ to manage increased workload have been thoroughly investigated in the context of car and truck drivers. However, there is a notable absence of a comprehensive study specifically targeting these techniques for PTW riders. Consequently, simulator studies can play a crucial role in comprehending alterations in driver performance metrics and the coping mechanisms employed when faced with heightened workloads due to distractions. With the introduction of advanced technologies in PTWs, riders are exposed to numerous distractions, amplifying their workload during riding. Therefore, these innovations should undergo thorough research to safeguard driver safety when utilizing such technologies.
Majority of research related to driving behavior feedback systems has predominantly concentrated on feedback systems for passenger car drivers, neglecting the specific context of PTW riders. Therefore, more research is required to address this gap by conducting studies focusing on PTW riding behavior. The aim is to understand how feedback systems, which are designed to provide information and guidance on driving behaviors, impact the safety of PTW riders. The need for more research in this direction suggests a recognition that PTW riders may have distinct behaviors and challenges compared to car drivers, and their safety considerations may require a tailored approach.
Despite a considerable amount of research being conducted on rider training programs for PTW, there is a lack of definitive evidence supporting the notion that these programs effectively enhance PTW safety. In essence, the existing body of research has not conclusively proven the efficacy of current training initiatives in significantly reducing risks or improving safety outcomes for PTW riders. Therefore, there is a need for further investigation and research in this specific direction. The aim is to gain a more comprehensive understanding of how rider training programs impact PTW safety. This call for more research suggests a recognition of the existing gaps in knowledge and a proactive approach to address those gaps. The ultimate goal is to refine and improve training programs, ensuring they are more effective in enhancing the safety of PTW riders.
While the initial findings suggest that segregating PTWs from the main traffic can be beneficial in terms of safety, it's important to delve deeper into the practical aspects. Researchers need to explore not only how effective these strategies are in enhancing safety but also whether they are logistically viable and economically justifiable. This involves evaluating the real-world performance of these safety measures, considering factors such as implementation costs, maintenance, and how well they align with the actual patterns of PTW usage. In summary, the statement emphasizes the need for comprehensive research to ensure that safety strategies involving the segregation of PTWs are not only effective in reducing crashes but also practical and economically reasonable in the context of their real-world usage.
Acknowledgments: The authors would like to thank the editor and the reviewers for providing valuable suggestions that helped in improving the quality of the manuscript. -
![]()
Figure 1. Road crashes, fatalities, and injuries by type of impacting vehicle in India (MoRT & H, 2021).
![]()
Figure 3. Layout of camera setup used in MSF100 naturalistic riding study (Williams et al., 2016).
Table 1 Topic-wise keywords and inclusion and exclusion criteria for searching studies.
Topic Combination of keywords Inclusion and exclusion criteria Number of selected studies for review* Data collection and analysis methods for riding behavior Rider self-reported data-based studies • Motorcycle rider behavior questionnaire
• Self-reported riding behavior
• Motorized two-wheeler
• Behavioral factors
• Motorcycle riders, etc.• Studies related to rider's self-reported riding behavior, psychology, and personality traits are only included. 29 Simulator based studies • Riding behavior
• Motorcycle rider simulator, etc.• Studies in which riding behavior was analyzed using a motorcycle simulator are only considered for the review.
• Studies that describe the type of simulators are not considered for the review.11 Naturalistic riding studies • Riding behavior
• Naturalistic riding studies
• On-site data, etc.• Studies analyzing riding behavior in a naturalistic environment are only included in the present paper. 22 Factors affecting powered two-wheeler riding behavior Human factors • Riding behavior
• Personality
• Riding experience
• Rider education
• Perception
• Human characteristics, etc.• Studies which discuss the effect of rider's demographic characteristics (age, gender, marital status, etc.), psychology (attitude), riding characteristics (riding mileage, riding experience, riding skills, helmet use, etc.), education level, and emotions on the riding behavior are only reviewed in this section. 16 Vehicle factors • Risky driving behavior
• Vehicle power
• Motorcycle type
• Motorcycle characteristics, etc.• In this section, the studies related to vehicle factors that affect PTW riding behavior have been discussed, except the studies related to vehicle factors that affect PTW stability and handling performances. 9 Road infrastructure factors • Behavior
• Road characteristics
• Intersection type, etc.• In this section, studies related to road environment such as road geometry, road type, intersection type, traffic conditions, etc., factors that affect riding behavior are reviewed. 20 Distraction • Rider distraction
• Mobile phone
• Drinking riding, etc.• Studies related to PTW rider distraction are reviewed in this section. 20 Enforcement • Enforcement camera
• Helmet use behavior, etc.• Enforcement-related studies are included in this section 8 Strategies for improvement of powered two-wheeler safety Strategies based on riding behavior improvement • Risky riding behavior
• Rider training
• Rider education
• Rider profiling
• Riding behavior feedback, etc.• Studies that explain the strategies for the improvement of riding behavior are reviewed. 15 Strategies based on vehicle technologies improvement • Motorcycle accidents
• Braking system
• Daylight running time
• Warning system
• Airbags, etc.• Studies related to recent advancement in-vehicle technologies which enhance the PTW rider's safety and reduce the crash risk are reviewed in this section. 14 Strategies based on road infrastructure and traffic management • Motorcycle accidents
• Road characteristics
• Segregation of traffic• Studies related to improvement in road infrastructure and traffic management strategies that enhance the PTW rider's safety and reduce the crash risk are reviewed in this section. 13 Note: * some studies are commonly reviewed for more than one topic.  下载: 导出CSV
Table 2 Number of published articles about PTW riding behavior and safety.
Type of article Number of papers Reports 5 Conference 14 Research paper Accident Analysis & Prevention 43 Transportation Research Part F 17 Traffic Injury Prevention 7 Safety Science 5 Transportation Research Record 4 Journal of Safety Research 4 IATSS 4 Others 35
下载: 导出CSV
Table 3 Summary of literature related to MRBQ studies.
Location Reference Questionnaire structure Factor structure Result Items in MRBQ Demographic characteristics Other data United Kingdom Elliott et al. (2007) 43 Age, gender, riding experience (yr.), and riding mileage (km per yr.) Self-reported crash data 5 factors (traffic errors, speed violations, stunts, safety equipment, and control errors) • Crash risk increases with rider exposure and decreases with age and experience.
• In the case of all crashes, traffic errors are the main predictor of crash risk.
• In the case of blame crashes, speed violations and control errors are significantly related to crash risk.Netherland Steg and van Brussel (2009) 43 Age, gender, riding experience (yr.), riding mileage (km per week) Self-reported crash data 3 factors (errors, lapse, violation) • All three factors do not significantly predict the crash involvement of riders.
• Demographic characteristics of riders such as age, gender, riding experience, and riding mileage also do not significantly affect the crash involvement.Taiwan, China Cheng and Ng (2010) 19 Age, gender, riding experience (yr.), riding mileage (km per yr.), and education level Self-reported crash data 2 factors (aggressive violation, ordinary violation) • Aggressive violations of riders are strongly associated with overtaking, whereas ordinary violations are associated with speeding and reckless driving.
• Riders having past crash records are more likely to perform risky riding behaviors.Turkey Özkan et al. (2012) 43 Age, gender, riding experience (yr.), riding mileage (km per yr.), and education level Self-reported crash data, self-reported offences data 5 factors (traffic errors, speed violations, stunts, safety equipment, and control errors) • Crash involvement increases with rider mileage and decreases with age.
• Stunts are the main predictor of active crashes and offenses.
• Speed violation is also related to offenses.Australia Sakashita et al. (2014) 43 Age, gender, riding experience (yr.), riding exposure (hours per week.) Self-reported crash data, police-reported crash and offense data 4 factors (errors, speed violation, stunts, and protective gear) • Stunts are a significant predictor of police-recorded crashes.
• Speed violations and errors are significantly related to the self-reported crash and near-crash involvement.
• Protective gear is significantly related to police-recorded offenses.Australia Stephens et al. (2017) 29 Age, gender, riding experience (yr.), riding exposure (hours per week), marital status, and employment level Self-reported crash data, self-reported traffic violation data 5 factors (traffic errors, speed violations, stunts, protective gear, and control errors) • Stunts are the main predictor of crash involvement.
• Speed violations and control errors are significantly related to near-crash involvement.
• Male riders are more likely to perform speed violations and stunts as compared to female riders.
下载: 导出CSV
Table 4 Summary of the literature on factors affecting PTW driver behavior.
Study Location Factor Driver performance parameter Result Jensupakarn and Kanitpong (2018) Thailand Human factor: age and gender Red light running (violation) behavior Younger drivers and male drivers have a higher tendency to violate red light as compared to older drivers. Chang and Yeh (2007) Taiwan, China Human factor: age and gender Safety Check, violation of traffic rules, driving skills, Young and male riders are most likely to disobey the traffic regulations.
Young riders neglect safety checks.
Young male riders have better driving skills than young female riders.Lardelli-Claret et al. (2005) Spain Human factor: age, gender, and driver experience Risk of causing a collision Younger drivers (age < 15), older drivers (age > 74), and male drivers tend to a higher risk of causing a collision.
The use of a helmet decreases the risk of causing a collision.
No significant effect of driver experience on the risk of collision.Rutter and Quine (1996) United Kingdom Human factor: age and driver experience Violation of traffic rules Younger drivers (age < 19) frequently break the rules, and lack of experience is not the leading cause for violation. Watson et al. (2007) Australia Human factor: age and emotion Handling errors Handling errors increases with a tendency to engage in sensation-seeking and aggressive riding and with increasing age. Chen (2009) Taiwan, China Human factor: gender and emotion Speeding and traffic rule violation Drivers with a high score of anger, sensation seeking, and normlessness have an increased tendency to engage in unsafe driving behavior (speeding and rule violation).
Male drivers are more likely to conduct risky riding behaviors than female drivers.Wong et al. (2010) Taiwan, China Human factor: gender and personality traits Risky driving behavior (violation and speeding) Male riders are more likely to engage in risky driving behavior than female riders.
Personality traits like sensation seeking, impatience, and amiability significantly affect driver behavior.Di Stasi et al. (2011) Spain Human factor: education Riding skills Virtual training programs improve the riding skills of riders. Mullin et al. (2000) New Zealand Human factor: age and driver experience Crash risk Younger riders are at a higher crash risk, whereas the impact of driver experience on crash risk is not significant. Goldenbeld et al. (2004) Netherlands Human factor: education and training Safe driving behavior Trained riders drive more safely as compared to non-trained riders. Yoshida and Koyanagi (2018) Cambodia Human factor: education Speed and lane-changing behavior Travel speed decreases, and the frequency of lane changing increases after safety workshops. Truong et al. (2018) Vietnam Human factor: gender Speeding and reckless overtaking Higher instances of speeding, drink driving, and reckless overtaking were observed for male participants. Rathinam et al. (2007) India Human factor: emotion Crash risk Aggressive attitudes and tailgating are associated with higher crash risk. Susilo et al. (2015) Indonesia Human factor: age, gender, and marital status
Enforcement: punishment
Education: campaigningTraffic violation Younger drivers and married drivers are more frequently violate traffic regulations, whereas male drivers are less likely to violate traffic regulations.
Road environmental factors more influence the violation behavior of drivers as compared to human factors and vehicle factors.
Riders do better respect and obey the law after improvement in law enforcement.Green (2006) United States Vehicle factor: braking system Stopping distance Powered two-wheelers equipped with the anti-lock braking system take less distance for stopping during braking events. Manan et al. (2017) Malaysia Vehicle factor: overload Speed Overloaded motorcycles are less likely than those not overloaded to ride with excessive speed. Preusser et al. (1995) United States Distraction: alcohol Ran-off road crash Ran-off road crashes mainly occur under the influence of alcohol. Truong et al. (2019) Vietnam Distraction: mobile phone use Crash risk Crash risk increases with the use of a mobile phone while riding. Kasantikul et al. (2005) Thailand Distraction: alcohol Inattention, speeding Drinking riders are inattentive to the driving task.
Drinking riders drive faster than sober riders.Creaser et al. (2009) United States Distraction: alcohol Response time, vehicle control Drinking drivers demonstrate a longer response time.
The effect of drinking on vehicle control is moderate.Wang et al. (2012) China Road infrastructure factor: road facilities, traffic characteristics Violation behavior Violation behavior of drivers is more influenced by road environmental factors as compared to human factors and vehicle factors. Minh et al. (2005) Vietnam Road infrastructure factor: dedicated lane Passing maneuver During passing maneuvers, the speed of riders was higher while driving in a dedicated two-wheeler lane compared to driving on an undivided road. Ibrahim et al. (2018) Malaysia Road infrastructure factor: lane width, presence of guardrail Overtaking speed, lateral position Lane width and road configuration significantly affect the lateral position of riders.
Road configuration affects the overtaking speed, whereas lane width does not affect the overtaking speed significantly.Dandona et al. (2006) India Enforcement: traffic law enforcement, helmet use, vehicle condition check, Crash risk, violation behavior Crash risk and violation activities can be minimized by implementing effective enforcement policies.
下载: 导出CSV
-
Ajzen, I., 1985. From intentions to actions: a theory of planned behavior. In: Kuhl, J., Beckmann, J., (Eds. ), Action Control: from Cognition to Behavior. Springer, Berlin, pp. 11-39.
Ajzen, I., Fishbein, M., 1980. Understanding Attitudes and Predicting Social Behavior. Prentice-Hall, Englewood Cliffs.
Aupetit, S., Gallier, V., Riff, J., et al., 2016. Naturalistic study of the risky situations faced by novice riders. Ergonomics 59(8), 1109-1120. doi: 10.1080/00140139.2015.1120887
Ayuso, M., Guillen, M., Perez Marin, A.M.P., 2016. Using GPS data to analyse the distance travelled to the first accident at fault in pay-as-you-drive insurance. Transportation Research Part C: Emerging Technologies 68, 160-167. doi: 10.1016/j.trc.2016.04.004
Balusu, S.K., Mannering, F., Pinjari, A., 2020. Hazard-based duration analysis of the time between motorcyclists' initial training and their first crash. Analytic Methods in Accident Research 28, 100143. doi: 10.1016/j.amar.2020.100143
Bambach, M.R., Grzebieta, R.H., Tebecis, R., et al., 2012. Crash characteristics and causal factors of motorcycle fatalities in Australia. In: Australasian Road Safety Research, Policing and Education Conference, Wellington, 2012.
Bambach, M.R., Mitchell, R.J., Grzebieta, R.H., 2013. The protective effect of roadside barriers for motorcyclists. Traffic Injury Prevention 14(7), 756-765. doi: 10.1080/15389588.2012.752077
Barmpounakis, E.N., Vlahogianni, E.I., Golias, J.C., 2014. Investigating powered two wheelers overtaking behavior in urban arterials. In: Conference of 93rd Annual Meeting of the Transportation Research Board, Washington DC, 2014.
Berndt, H., Dietmayer, K., 2008. Timing analysis for motorcycle intersection assistance systems. In: 15th World Congress on Intelligent Transport Systems and ITS America's 2008 Annual Meeting, New York, 2008.
Bokare, B., Maurya, A., 2013. Study of effect of speed, acceleration and deceleration of small petrol car on its tail pipe emission. International Journal for Traffic & Transport Engineering 3(4), 465-478.
Boubezoul, A., Dufour, F., Bouaziz, S., et al., 2019. Dataset on powered two wheelers fall and critical events detection. Data in Brief 23, 103828. doi: 10.1016/j.dib.2019.103828
Broughton, J., 2005. Car occupant and motorcyclist deaths in Great Britain. In: Road Safety Congress, London, 2005.
Broughton, P.S., Fuller, R., Stradling, S., et al., 2009. Conditions for speeding behaviour: a comparison of car drivers and powered two wheeled riders. Transportation Research Part F: Traffic Psychology and Behaviour 12(5), 417-427. doi: 10.1016/j.trf.2009.07.001
Bui, H.T., Saadi, I., Cools, M., 2020. Investigating on-road crash risk and traffic offences in Vietnam using the motorcycle rider behaviour questionnaire (MRBQ). Safety Science 130, 104868. doi: 10.1016/j.ssci.2020.104868
Carsten, O.M.J., Tate, F.N., 2005. Intelligent speed adaptation: accident savings and cost-benefit analysis. Accident Analysis & Prevention 37(3), 407-416.
Chang, H., Yeh, T., 2007. Motorcyclist accident involvement by age, gender, and risky behaviors in Taipei, Taiwan. Transportation Research Part F: Traffic Psychology and Behaviour 10(2), 109-122. doi: 10.1016/j.trf.2006.08.001
Chang, S., Lin, C., Hsu, C., et al., 2009. The effect of a collision warning system on the driving performance of young drivers at intersections. Transportation Research Part F: Traffic Psychology and Bohaviour 12(5), 371-380. doi: 10.1016/j.trf.2009.05.001
Chen, C., 2009. Personality, safety attitudes, and risky driving behaviors-evidence from young Taiwanese motorcyclists. Accident Analysis & Prevention 41(5), 963-968.
Chen, C., Chen, C., 2011. Speeding for fun? Exploring the speeding behavior of riders of heavy motorcycles using the theory of planned behavior and psychological flow theory. Accident Analysis & Prevention 43(3), 983-990.
Chen, P., Pai, C., Jou, R.C., et al., 2015. Exploring motorcycle red-light violation in response to pedestrian green signal countdown device. Accident Analysis & Prevention 75, 128-136.
Cheng, A.S.K., Ng, T.C.K., 2010. Development of a Chinese motorcycle rider driving violation questionnaire. Accident Analysis & Prevention 42(4), 1250-1256.
Chin, H.C., Haque, M.M., 2012. Effectiveness of red light cameras on the right-angle crash involvement of motorcycles. Journal of Advanced Transportation 46(1), 54-66. doi: 10.1002/atr.145
Chorlton, K., Conner, M., Jamson, S., 2012. Identifying the psychological determinants of risky riding: an application of an extended theory of planned behaviour. Accident Analysis & Prevention 49, 142-153.
Clabaux, N., Brenac, T., Perrin, C., et al., 2012. Motorcyclists' speed and "looked-but-failed-to-see" accidents. Accident Analysis & Prevention 49, 73-77.
Clabaux, N., Fournier, J.Y., Michel, J.E., 2014. Powered two-wheeler drivers' crash risk associated with the use of bus lanes. Accident Analysis & Prevention 71, 306-310.
Cossalter, V., Aguggiaro, A., Debus, D., et al., 2007. Real cases motorcycle and rider race data investigation: fall behavior analysis. In: International Technical Conference on the Enhanced Safty of Vehcles National Highway Traffic Safty Administration, Lyon, 2007.
Creaser, J.I., Ward, N.J., Rakauskas, M.E., et al., 2009. Effects of alcohol impairment on motorcycle riding skills. Accident Analysis & Prevention 41(5), 906-913.
Crundall, D., Humphrey, K., Clarke, D., 2008. Perception and appraisal of approaching motorcycles at junctions. Transportation Research Part F: Traffic Psychology and Behaviour 11(3), 159-167.
Crundall, E., Crundall, D., Stedmon, A.W., 2012. Negotiating left-hand and right-hand bends: a motorcycle simulator study to investigate experiential and behaviour differences across rider groups. PLoS One 7(1), e29978. doi: 10.1371/journal.pone.0029978
Crundall, D., Stedmon, A.W., Crundall, E., et al., 2014. The role of experience and advanced training on performance in a motorcycle simulator. Accident Analysis & Prevention 73, 81-90.
Dandona, R., Kumar, G.A., Dandona, L., 2006. Risky behavior of drivers of motorized two wheeled vehicles in India. Journal of Safety Research 37(2), 149-158.
Daniello, A., Swanseen, K., Mehta, Y.A., et al., 2010. Rating roads for motorcyclist safety: development of a motorcycle road assessment program. Transportation Research Record 2194, 67-74. doi: 10.3141/2194-08
De Gruyter, C., Truong, L.T., Nguyen, H.T.T., 2017. Who's calling? Social networks and mobile phone use among motorcyclists. Accident Analysis & Prevention 103, 143-147.
De Lapparent, M., 2006. Empirical Bayesian analysis of accident severity for motorcyclists in large French urban areas. Accident Analysis & Prevention 38(2), 260-268.
De Rome, L., Ivers, R., Fitzharris, M., et al., 2011. Motorcycle protective clothing: protection from injury or just the weather? Accident Analysis & Prevention 43(6), 1893-1900.
Di Stasi, L.L., Contreras, D., Candido, A., et al., 2011. Behavioral and eye-movement measures to track improvements in driving skills of vulnerable road users: first-time motorcycle riders. Transportation Research Part F: Traffic Psychology and Behaviour 14(1), 26-35.
Dingus, T.A., Klauer, S.G., Neale, V.L., et al., 2006. The 100-car naturalistic driving study phase Ⅱ-results of the 100-car field experiment January. Department of Transportation, National Highway Traffic Safty Administration, Washington DC.
Elliott, M.A., 2010. Predicting motorcyclists' intentions to speed: effects of selected cognitions from the theory of planned behavior, self-identity, and social identity. Accident Analysis & Prevention 42(2), 718-725.
Elliott, M. A, Baughan, C.J., Broughton, J., et al., 2003. Motorcycle Safety: a Scoping Study. TRL Report TRL581. TRL, London.
Elliott, M.A., Baughan, C.J., Sexton, B.F., 2007. Errors and violations in relation to motorcyclists' crash risk. Accident Analysis & Prevention 39(3), 491-499.
Elvik, R., T.V., 2004. The Handbook of Road Safety Measures, first ed. Emerald Group Publishing Limited, Oslo.
Espie, S., Boubezoul, A., Aupetit, S., et al., 2013. Data collection and processing tools for naturalistic study of powered two-wheelers users' behaviours. Accident Analysis & Prevention 58, 330-339.
Farid, A., Ksaibati, K., 2021. Modeling severities of motorcycle crashes using random parameters. Journal of Traffic and Transportation Engineering (English Edition) 8(2), 225-236. doi: 10.1016/j.jtte.2020.01.001
Filtness, A.J., Rudin-Brown, C.M., Mulvihill, C.M., et al., 2013. Impairment of simulated motorcycle riding performance under low dose alcohol. Accident Analysis & Prevention 50, 608-615.
Fishbein, M., 1979. A theory of reasoned action: some applications and implications. Nebraska Symposium on Motivation, Lindon 27, 65-116.
Fishbein, M., Ajzen, I., 1975. Belief, Attitude, Intention, and Behavior: an Introduction to Theory and Research. Addison-Wesley, Reading.
Foss, R.D., Goodwin, A.H., 2014. Distracted driver behaviors and distracting conditions among adolescent drivers: findings from a naturalistic driving study. Journal of Adolescent Health 54(5), S50-S60.
French, M.T., Gumus, G., 2018. Watch for motorcycles! The effects of texting and handheld bans on motorcyclist fatalities. Social Science & Medicine 216, 81-87.
Gianfranchi, E., Tagliabue, M., Spoto, A., et al., 2017. Sensation seeking, non-contextual decision making, and driving abilities as measured through a moped simulator. Frontiers in Psychology 8, 2126.
Gianfranchi, E., Tagliabue, M., Vidotto, G., 2018. Personality traits and beliefs about peers' on-road behaviors as predictors of adolescents' moped-riding profiles. Frontiers in Psychology 9, 2483.
Goldenbeld, C., Twisk, D., de Craen, S., 2004. Short and long term effects of moped rider training: a field experiment. Transportation Research Part F: Traffic Psychology and Behaviour 7(1), 1-16.
Gordon, C., Hunt, M., 1998. The theory of planned behaviour applied to speeding, drink-driving and seat-belt wearing. In: Road Safety Research, Policing, Education Conference, Wellington, 1998.
Grahn, H., Kujala, T., 2018. Visual distraction effects between in-vehicle tasks with a smartphone and a motorcycle helmet-mounted head-up display. In: 22nd International Academic Mindtrek Conference, Tampere, 2018.
Grassi, A., Barbani, D., Baldanzini, N., et al., 2018. Belted safety jacket: a new concept in powered two-wheeler passive safety. Procedia Structural Integrity 8, 573-593.
Green, D., 2006. A comparison of stopping distance performance for motorcycles equipped with ABS, CBS and conventional hydraulic brake systems. In: International Motorcycle Safety Conference, Long Beach, 2006.
Grottoli, M., Celiberti, F., Lemmens, Y., et al., 2020. Emergency braking at intersections: a motion-base motorcycle simulator study. Applied Ergonomics 82, 102970.
Guzman, L.A., Mesa, V.G., Ortiz, A, I.V., et al., 2020. The relationships between correct helmet use, enforcement presence, and mortality in a Latin-America city: the case study of Bogota, Colombia. Traffic Injury Prevention 21(7), 500-505. doi: 10.1080/15389588.2020.1805737
Haglund, M., Aberg, L., 2000. Speed choice in relation to speed limit and influences from other drivers. Transportation Research Part F: Traffic Psychology and Behaviour 3(1), 39-51.
Haque, M.M., Chin, H.C., Huang, H., 2009. Modeling fault among motorcyclists involved in crashes. Accident Analysis & Prevention 41(2), 327-335.
Haworth, N., Mulvihill, C., 2005. Review of Motorcycle Licensing and Training. Monash University Accident Research Center, Melbourne.
Hell, T., Lob, G., 1993. Typical injury patterns of motorcyclists in different crash types: effectiveness and improvements of countermeasures. In: Association for the Advancement of Automotive Medicine Annual Conference, San Antonio, 1993.
Huth, V., Biral, F., Martin, O., et al., 2012. Comparison of two warning concepts of an intelligent Curve warning system for motorcyclists in a simulator study. Accident Analysis & Prevention 44(1), 118-125.
Ibrahim, M.K.A., Hamid, H., Law, T.H., et al., 2018. Evaluating the effect of lane width and roadside configurations on speed, lateral position and likelihood of comfortable overtaking in exclusive motorcycle lane. Accident Analysis & Prevention 111, 63-70.
Irwin, C., Iudakhina, E., Desbrow, B., et al., 2017. Effects of acute alcohol consumption on measures of simulated driving: a systematic review and meta-analysis. Accident Analysis & Prevention 102, 248-266.
Janz, N.K., Becker, M.H., 1984. The health belief model: a decade later. Health Education Quarterly 11(1), 1-47. doi: 10.1177/109019818401100101
Jensupakarn, A., Kanitpong, K., 2018. Influences of motorcycle rider and driver characteristics and road environment on red light running behavior at signalized intersections. Accident Analysis & Prevention 113, 317-324.
Kasantikul, V., Ouellet, J.V., Smith, T., et al., 2005. The role of alcohol in Thailand motorcycle crashes. Accident Analysis & Prevention 37(2), 357-366.
Kumphong, J., Satiennam, T., Satiennam, W., et al., 2019. Change of motorcycle speed under speed enforcement camera on urban arterial in Khon Kaen City, Thailand. International Journal of Geomate 16, 159-164.
Lahrmann, H., Agerholm, N., Tradisauskas, N., et al., 2012. Pay as you speed, ISA with incentive for not speeding: results and interpretation of speed data. Accident Analysis & Prevention 48, 17-28.
Lardelli-Claret, P., Jimenez-Moleon, J.J., De Dios Luna-del-Castillo, J., et al., 2005. Driver dependent factors and the risk of causing a collision for two wheeled motor vehicles. Injury Prevention 11(4), 225-231. doi: 10.1136/ip.2004.006957
Law, T.H., Noland, R.B., Evans, A.W., 2009. Factors associated with the relationship between motorcycle deaths and economic growth. Accident Analysis & Prevention 41(2), 234-240.
LeBlanc, D.J., Sivak, M., Bogard, S.E., 2010. Using Naturalistic Driving Data to Assess Variations in Fuel Efficiency Among Individual Drivers. University of Michigan, Transportation Research Institute, Ann Arbor.
Lenkeit, J.F., Hagoski, B.K., Bakker, A.J., 2011. A Study of Motorcycle Rider Braking Control Behavior. DOT HS-811 448. National Highway Traffic Sofety Administration, Washington DC.
Lich, T., Block, W.G., Prashanth, S.N., et al., 2016. Motorcycle stability control-the next generation of motorcycle safety and riding dynamics. SAE International Journal of Engines 9(1), 491-498.
Lin, M., Kraus, J.F., 2009. A review of risk factors and patterns of motorcycle injuries. Accident Analysis & Prevention 41(4), 710-722.
Lin, M., Chang, S., Pai, L., et al., 2003. A longitudinal study of risk factors for motorcycle crashes among junior college students in Taiwan. Accident Analysis & Prevention 35(2), 243-252.
Lin, M., Huang, W., Hwang, H.F., et al., 2004. The effect of crash experience on changes in risk taking among urban and rural young people. Accident Analysis & Prevention 36(2), 213-222.
Liu, C.C., Hosking, S.G., Lenne, M.G., 2009. Hazard perception abilities of experienced and novice motorcyclists: an interactive simulator experiment. Transportation Research Part F: Traffic Psychology and Behaviour 12(4), 325-334.
Lynam, D., Sutch, T., Broughton, J., 2003. European Road Assessment Programme Pilot Phase Technical Report. AA Foundation for Road Safety and Research, Farnborough.
Maestracci, M., Prochasson, F., Geffroy, A., et al., 2012. Powered two-wheelers road accidents and their risk perception in dense urban areas: case of Paris. Accident Analysis & Prevention 49, 114-123.
Manan, M.M.A., Varhelyi, A., 2015. Motorcyclists' road safety related behavior at access points on primary roads in Malaysia-a case study. Safety Science 77, 80-94.
Manan, M.M.A., Ho, J.S., Arif, S.T.M.S.T., et al., 2017. Factors associated with motorcyclists' speed behaviour on Malaysian roads. Transportation Research Part F: Traffic Psychology and Behaviour 50, 109-127. doi: 10.1515/cerce-2017-0020
Mannering, F.L., Grodsky, L.L., 1995. Statistical analysis of motorcyclists' perceived accident risk. Accident Analysis & Prevention 27(1), 21-31.
Manzoni, V., Corti, A., Spelta, C., et al., 2010. A driver-to-infrastructure interaction system for motorcycles based on smartphone. In: 13th International IEEE Conference on Intelligent Transportation Systems, Madeira Island, 2010.
Mehrotra, S., Sudhir, P.M., Sharma, M.K., et al., 2016. Emotions and two-wheeler riding: perspectives of college-going youth riders. Journal of the Indian Academy of Applied Psychology 42(2), 272-280.
Metcalfe, J., Smith, G., 2005. The australian road assessment program (AusRAP). In: Australasian Road Safety Research, Policing and Education Conference, Wellington, 2005.
Minh, C.C., Sano, K., Matsumoto, S., 2005. Characteristics of passing and paired riding maneuvers of motorcycle. Journal of the Eastern Asia Society for Tansportation Studies 6, 186-197.
Ministry of Road Transport & Highway (MoRT & H), 2017. Road Transport Year Book 2016-17. Available at: http://www.morth.nic(Accessed1June2023).
Ministry of Road Transport & Highway (MoRT & H), 2021. Road Accidents in India 2021. Available at: http://www.morth.nic(Accessed1June2023).
Moskal, A., Martin, J.L., Laumon, B., 2012. Risk factors for injury accidents among moped and motorcycle riders. Accident Analysis & Prevention 49, 5-11.
Mullin, B., Jackson, R., Langley, J., et al., 2000. Increasing age and experience: are both protective against motorcycle injury? A case-control study. Injury Prevention 6(1), 32-35.
Neale, V.L., Dingus, T.A., Klauer, S.G., et al., 2005. An overview of the 100-car naturalistic study and findings. National Highway Traffic Safety Administration, Washington DC.
Neale, W.T., Danaher, D., McDonough, S., et al., 2016. Data acquisition using smart phone applications. SAE Technical Paper, 2016-01-1461.
Nehaoua, L., Arioui, H., Mammar, S, 2011. Review on single track vehicle and motorcycle simulators. In: 19th Mediterranean Conference on Control and Automation, Corfu, 2011.
Nguyen, D.V.M., Ross, V., Vu, A.T., et al., 2020. Exploring psychological factors of mobile phone use while riding among motorcyclists in Vietnam. Transportation Research Part F: Traffic Psychology and Behaviour 73, 292-306. doi: 10.1016/j.trf.2020.06.023
NHTSA, 2013. Traffic safety facts 2011 data: motorcycles. National Highway Traffic Safety Administration (NHTSA), Washington DC.
Novoa, A.M., Perez, K., Santamarina-Rubio, E., et al., 2010. Effectiveness of speed enforcement through fixed speed cameras : a time series study. Injury Prevention 16(1), 12-16. doi: 10.1136/ip.2008.021485
Nugent, M., Savino, G., Mulvihill, C., et al., 2019. Evaluating rider steering responses to an unexpected collision hazard using a motorcycle riding simulator. Transportation Research Part F: Psychology and Behaviour 66, 292-309. doi: 10.1016/j.trf.2019.09.005
Ozkan, T., Lajunen, T., Dogruyol, B., et al., 2012. Motorcycle accidents, rider behaviour, and psychological models. Accident Analysis & Prevention 49, 124-132.
Pai, C., Saleh, W., 2007. An analysis of motorcyclist injury severity under various traffic control measures at three-legged junctions in the UK. Safety Science 45(8), 832-847. doi: 10.1016/j.ssci.2006.08.021
Pai, C., Saleh, W., 2008. Modelling motorcyclist injury severity by various crash types at T-junctions in the UK. Safety Science 46(8), 1234-1247. doi: 10.1016/j.ssci.2007.07.005
Pallacci, T., Baldanzini, N., Barbani, D., et al., 2019. Preliminary effectiveness assessment of an airbag-based device for riders' leg protection in side impacts. Procedia Structral Integrity 24, 240-250. doi: 10.1016/j.prostr.2020.02.021
Papadimitriou, E., Theofilatos, A., Yannis, G., et al., 2014. Motorcycle riding under the influence of alcohol: results from the SARTRE-4 survey. Accident Analysis & Prevention 70, 121-130.
Parker, D., Manstead, A.S.R., Stradling, S.G., et al., 1992. Intention to commit driving violations: an application of the theory of planned behaviour. Journal of Applied Psychology 77(1), 94-101. doi: 10.1037/0021-9010.77.1.94
Patil, G.R., Sangole, J.P., 2016. Behavior of two-wheelers at limited priority uncontrolled T-intersections. IATSS Research 40(1), 7-18. doi: 10.1016/j.iatssr.2015.12.002
Paulozzi, L.J., Ryan, G.W., Espitia-hardeman, V.E., et al., 2007. Economic development's effect on road transport-related mortality among different types of road users: a cross-sectional international study. Accident Analysis & Prevention 39(3), 606-617.
Peltzman, S., 1975. The effects of automobile safety regulation. Journal of Political Economy 83(4), 677-725. doi: 10.1086/260352
Petridou, E., Moustaki, M., 2000. Human factors in the causation of road traffic crashes. European Journal of Epidemiology 16(9), 819-826. doi: 10.1023/A:1007649804201
Phan, V., Regan, M., Leden, L., et al., 2010. Rider/driver behaviours and road safety for PTW. In: 2BESAFE Final Event & User Forum, Paris, 2010.
Pinto, M., Cavallo, V., Saint-Pierre, G., 2014. Influence of front light configuration on the visual conspicuity of motorcycles. Accident Analysis & Prevention 62, 230-237.
Preusser, D.F., Williams, A.F., Ulmer, R.G., 1995. Analysis of fatal motorcycle crashes: crash typing. Accident Analysis & Prevention 27(6), 845-851.
Quddus, M.A., Noland, R.B., Chin, H.C., 2002. An analysis of motorcycle injury and vehicle damage severity using ordered probit models. Journal of Safety Research 33(4), 445-462. doi: 10.1016/S0022-4375(02)00051-8
Radin, R.S., Mackay, M.G., Hills, B.L., 1995. Preliminary analysis of exclusive motorcycle lanes along the federal highway F02, Shah alam, Malaysia. Journal of IATSS Research 19(2), 93-99.
Radin, R.S., Mackay, M.G., Hills, B.L., 1996. Modelling of conspicuity-related motorcycle accidents in seremban and shah alam, Malaysia. Accident Analysis & Prevention 28(3), 325-332.
Radin, R.S., Mackay, M.G., Hills, B., 2000. Multivariate analysis of motorcycle accidents and the effects of exclusive motorcycle lanes in Malaysia. Journal of Crash Prevention and Injury Control 2(1), 11-17. doi: 10.1080/10286580008902549
Rathinam, C., Nair, N., Gupta, A., et al., 2007. Self-reported motorcycle riding behaviour among school children in India. Accident Analysis & Prevention 39(2), 334-339.
Regan, M.A., Young, K., Lee, J.D., 2008. Driver Distraction: Theory, Effects, and Mitigation. CRC Press, Boca Raton.
Regan, M.A., Williamson, A., Grzebieta, R., et al., 2013. The Australian 400-car naturalistic driving study: innovation in road safety research and policy. In: Australasion Road Safety Research, Policing and Eductation Conference, Brisbane, 2013.
Rifactt, S.M., Tay, R., De Barros, A., 2012. Severity of motorcycle crashes in Calgary. Accident Analysis & Prevention 49, 44-49.
Rizzi, M., Strandroth, J., Tingvall, C., 2009. The effectiveness of antilock brake systems on motorcycles in reducing real-life crashes and injuries. Traffic Injury Prevention 10(5), 479-487. doi: 10.1080/15389580903149292
Rizzi, M., Strandroth, J., Kullgren, A., et al., 2013. Effectiveness of anti-lock brakes (ABS) on motorcycles in reducing crashes: a multinational study. In: 23rd International Technical Conference on the Enhanced Safty of Vehicles, Seoul, 2013.
Rutter, D.R., Quine, L., 1996. Age and experience in motorcycling safety. Accident Analysis & Prevention 28(1), 15-21.
Rutter, D.R., Quine, L., Chesham, D.J., 1992. Lifestyles, Stress and Health: New Developments in Health Psychology. DSWO Press, Leiden.
Rutter, D.R., Quine, L., Chesham, D.J., 1995. Predicting safe riding behaviour and accidents: demography, beliefs, and behaviour in motorcycling safety. Psychology and Health 10(5), 369-386. doi: 10.1080/08870449508401957
Sager, B., Yanko, M.R., Spalek, T.M., et al., 2014. Motorcyclist's lane position as a factor in right-of-way violation collisions: a driving simulator study. Accident Analysis & Prevention 72, 325-329.
Sakashita, C., Senserrick, T., Lo, S., et al., 2014. The motorcycle rider behavior questionnaire: psychometric properties and application amongst novice riders in Australia. Transportation Research Part F: Traffic Psychology and Behaviour 22, 126-139. doi: 10.1016/j.trf.2013.10.005
Satiennam, W., Satiennam, T., Triyabutra, T., et al., 2018. Red light running by young motorcyclists: factors and beliefs influencing intentions and behavior. Transportation Research Part F: Psychology and Behaviour 55, 234-245. doi: 10.1016/j.trf.2018.03.007
Satiennam, T., Kumphong, J., Satiennam, W., et al., 2020. Change in helmet use behavior enforced by CCTV cameras with automatic helmet use detection system on an urban arterial road. Traffic Injury Prevention 22(7), 494-499. doi: 10.1080/15389588.2020.1778170
Sato, K., 1998. A study on a lane departure warning system using a steering torque as a warning signal. In: 4th International Symposium on Advanced Vehicle Control, Nagoya, 1998.
Savolainen, P., Mannering, F., 2007a. Probabilistic models of motorcyclists' injury severities in single- and multi-vehicle crashes. Accident Analysis & Prevention 39(5), 955-963.
Savolainen, P., Mannering, F., 2007b. Effectiveness of motorcycle training and motorcyclists' risk-taking behavior. Transportation Research Record 2031, 52-58. doi: 10.3141/2031-07
Schneider Ⅳ, W.H., Savolainen, P.T., Moore, D.N., 2010. Effects of horizontal curvature on single-vehicle motorcycle crashes along rural two-lane highways. Transportation Research Record 2194, 91-98. doi: 10.3141/2194-11
Seedam, A., Satiennam, T., Radpukdee, T., et al., 2017. Motorcycle on-road driving parameters influencing fuel consumption and emissions on congested signalized urban corridor. Journal of Advanced Transportation 2017(1), 5859789.
Seiniger, P., Schroter, K., Gail, J., 2012. Perspectives for motorcycle stability control systems. Accident Analysis & Prevention 44(1), 74-81.
Serre, T., Masson, C., Llari, M., et al., 2019. Airbag jacket for motorcyclists: evaluation of real effectiveness. In: International Conference on the Biomechanics of Injury, Florence, 2019.
Sexton, B.F., Baughan, C.J., Elliott, M.A., et al., 2004. The Accident Risk of Motorcy-Clists. TRL, London.
Shankar, V., Mannering, F., 1996. An exploratory multinomial logit analysis of single-vehicle motorcycle accident severity. Journal of Safety Research 27(3), 183-194. doi: 10.1016/0022-4375(96)00010-2
Smither, J.A., Torrez, L.I., 2010. Motorcycle conspicuity: effects of age and daytime running lights. Human Factors 52(3), 355-369. doi: 10.1177/0018720810374613
Soderstrom, C.A., Dischinger, P.C., Ho, S.M., et al., 1993. Alcohol use, driving records, and crash culpability among injured motorcycle drivers. Accident Analysis & Prevention 25(6), 711-716.
Stedmon, A.W., Young, M., Hasseldine, B., 2009. Keeping it real or faking it: the trials and tribulations of real road studies and simulator in transport research. In: International Conference on Contemporary Ergonomics, London, 2009.
Steg, L., van Brussel, A., 2009. Accidents, aberrant behaviours, and speeding of young moped riders. Transportation Research Part F: Traffic Psychology and Behaviour 12(6), 503-511. doi: 10.1016/j.trf.2009.09.001
Stephens, A.N., Brown, J., de Rome, L., et al., 2017. The relationship between motorcycle rider behaviour questionnaire scores and crashes for riders in Australia. Accident Analysis & Prevention 102, 202-212.
Strayer, D.L., Turrill, J., Coleman, J.R., et al., 2014. Measuring cognitive distraction in the automobile Ⅱ: assessing in-vehicle voice-based. Accident Analysis & Prevention 372, 379.
Susilo, Y.O., Joewono, T.B., Vandebona, U., 2015. Reasons underlying behaviour of motorcyclists disregarding traffic regulations in urban areas of Indonesia. Accident Analysis & Prevention 75, 272-284.
Swaddiwudhipong, W., Boonmak, C., Nguntra, P., et al., 1998. Effect of motorcycle rider education on changes in risk behaviours and motorcycle-related injuries in rural Thailand. Tropical Medicine & International Health 3(10), 767-770.
Teoh, E.R., 2011. Effectiveness of antilock braking systems in reducing motorcycle fatal crash rates. Traffic Injury Prevention 12(2), 169-173. doi: 10.1080/15389588.2010.541308
Teoh, E.R., Campbell, M., 2010. Role of motorcycle type in fatal motorcycle crashes. Journal of Safety Research 41(6), 507-512. doi: 10.1016/j.jsr.2010.10.005
Terry, D.J., Hogg, M.A., 1996. Group norms and the attitude-behaviour relationship: a role for group identification. Personality and Social Psychology Bulletin 22(8), 776-793. doi: 10.1177/0146167296228002
Terry, D.J., Hogg, M.A., White, K.M., 1999. The theory of planned behaviour: self- identity, social identity and group norms. British Journal Social Psychology 38(3), 225-244. doi: 10.1348/014466699164149
Theeuwes, J., Godthelp, H., 1995. Self-explaining roads. Safety Science 19(2-3), 217-225.
Theofilatos, A., Yannis, G., 2015. A review of powered-two-wheeler behaviour and safety. International Journal of Injury Control and Safety Promotion 22(4), 284-307. doi: 10.1080/17457300.2014.908224
Thomson, G.A., 1980. The role frontal motorcycle conspicuity has in road accidents. Accident Analysis & Prevention 12(3), 165-178.
Toledo, T., Musicant, O., Lotan, T., 2008. In-vehicle data recorders for monitoring and feedback on drivers' behavior. Transportation Research Part C: Emerging Technologies 16(3), 320-331. doi: 10.1016/j.trc.2008.01.001
Toman, P., Svoboda, J., Orlicky, A., 2020. Assessment of the motorcycle rider behaviour-experimental study on the race track. In: 2020 Smart City Symposium Prague (SCSP), Prague, 2020.
Trafikverket, 2010. Improved Safety for Motorcycle and Moped Riders. Swedish Road Administration, Stockholm.
Truong, L.T., Nguyen, H.T.T., De Gruyter, C., 2018. Correlations between mobile phone use and other risky behaviours while riding a motorcycle. Accident Analysis & Prevention 118, 125-130.
Truong, L.T., Nguyen, H.T.T., De Gruyter, C., 2019. Mobile phone use while riding a motorcycle and crashes among university students. Traffic Injury Prevention 20(2), 204-210. doi: 10.1080/15389588.2018.1546048
Tunnicliff, D.J., Watson, B.C., White, K.M., et al., 2012. Understanding the factors influencing safe and unsafe motorcycle rider intentions. Accident Analysis & Prevention 49, 133-141.
Uy, F.A.A., Regidor, J.R.F., 2011. A study on motorcycle rider characteristic and behavior in metro Manila. In: The 9th International Conference of Eastern Asia Society for Transportation Studies, Jeju, 2011.
Vavryn, K., Winkelbauer, M., 2004. Braking performance of experience and novice motorcycle riders-results of a field study. In: International Conference on Transport and Traffic Psychology, Nottingham, 2004.
Venkatesh, N., Kumar, S., 2020. Risky driving behaviour among the motorized two-wheeler novice riders in davanagere city, Karnataka-cross-sectional study. Indian Journal of Community Health 32(1), 133-136. doi: 10.47203/ijch.2020.v32i01.027
Vlahogianni, E.I., Yannis, G., Golias, J.C., et al., 2011. Identifying riding profiles parameters from high resolution naturalistic riding data. In: 3rd International Conference on Road Safety and Simulation (RSS2011), Indianapolis, 2011.
Vlahogianni, E.I., Yannis, G., Golias, J.C., 2012. Overview of critical risk factors in power-two-wheeler safety. Accident Analysis & Prevention 49, 12-22.
Voas, R.B., Smith, T.A., Thom, D.R., et al., 2007. Methodology for Determining Motorcycle Operator Crash Risk and Alcohol Impairment. NHTSA, Washington DC.
Vu, A.T., Nguyen, M.T., Nguyen, D.V.M., et al., 2020. Investigating the effect of blood alcohol concentration on motorcyclist's riding performance using an advanced motorcycle simulator. Transportation Research Part F: Traffic Psychology and Behaviour 73, 1-14. doi: 10.1016/j.trf.2020.06.010
Walton, D., Buchanan, J., 2012. Motorcycle and scooter speeds approaching urban intersections. Accident Analysis & Prevention 48, 335-340.
Wang, X., Xu, Y., Tremont, P.J., et al., 2012. Moped rider violation behavior and moped safety at intersections in China. Transportation Research Record 2281, 83-91. doi: 10.3141/2281-11
Wang, C., Xu, C., Xia, J., et al., 2018a. The effects of safety knowledge and psychological factors on self-reported risky driving behaviors including group violations for e-bike riders in China. Transportation Research Part F: Traffic Psychology and Behaviour 56, 344-353. doi: 10.1016/j.trf.2018.05.004
Wang, Z., Lee, C., Lin, P., et al., 2018b. Study on Motorcycle Safety in Negotiation with Horizontal Curves in Florida and Development of Crash Modification Factors. University of South Florida, Tampa Bay.
Wanvik, P.O., 2009. Effects of road lighting: an analysis based on Dutch accident statistics 1987-2006. Accident Analysis & Prevention 41(1), 123-128.
Watson B., Tunnicliff, D., White, K., et al., 2007. Psychological and Social Factors Influencing Motorcycle Rider Intentions and Behaviour. Center for Accident Research and Road Safety, Queensland.
Wells, S., Mullin, B., Norton, R., et al., 2004. Motorcycle rider conspicuity and crash related injury: case-control study. British Medical Journal 328(7444), 857-860. doi: 10.1136/bmj.37984.574757.ee
Widyanti, A., Pratama, G.B., Anindya, A.H., et al., 2020. Mobile phone use among Indonesian motorcyclists: prevalence and influencing factors. Traffic Injury Prevention 21(7), 459-463. doi: 10.1080/15389588.2020.1789121
Will, S., Schmidt, E.A., 2015. Powered two wheelers' workload assessment with various methods using a motorcycle simulator. IET Intelligent Transport Systems 9(7), 702-709. doi: 10.1049/iet-its.2014.0231
Will, S., Metz, B., Hammer, T., et al., 2020. Methodological considerations regarding motorcycle naturalistic riding investigations based on the use of g-g diagrams for rider profile detection. Safety Science 129, 104840. doi: 10.1016/j.ssci.2020.104840
Williams, M.J., Hoffmann, E.R., 1979. Motorcycle conspicuity and traffic accidents. Accident Analysis & Prevention 11(3), 209-224. doi: 10.2307/2098038
Williams, V., McLaughlin, S., Atwood, J., 2016. Factors that Increase and Decrease Motorcyclist Crash Risk. Virginia Tech Transportation Institute, Blacksburg.
Winston, C., Maheshri, V., Mannering, F., 2006. An exploration of the offset hypothesis using disaggregate data: the case of airbags and antilock brakes. Journal of Risk and Uncertainty 32, 83-99. doi: 10.1007/s11166-006-8288-7
Wong, J.T., Chung, Y.S., Huang, S.H., 2010. Determinants behind young motorcyclists' risky riding behavior. Accident Analysis & Prevention 42(1), 275-281.
World Health Organization (WHO), 2023. Global Safety Report. WHO, Geneva.
Yamasaki, G., Aoki, K., Miyamaru, Y., et al., 1998. Development of motorcycle training simulator. JSAE Review 19(1), 81-85. doi: 10.1016/S0389-4304(97)00057-X
Yannis, G., Golias, J., Papadimitriou, E., 2005. Driver age and vehicle engine size effects on fault and severity in young motorcyclists accidents. Accident Analysis & Prevention 37(2), 327-333.
Yannis, G., Antoniou, C., Evgenikos, P., et al., 2012. Characteristics and causes of power two wheeler accidents in Europe. Procedia-Social and Behavioural Sciences 48, 1535-1544. doi: 10.1016/j.sbspro.2012.06.1129
Yeh, T.H., Chang, H.L., 2009. Age and contributing factors to unlicensed teen motorcycling. Safety Sciences 47(1), 125-130. doi: 10.1016/j.ssci.2008.02.002
Yoshida, N., Koyanagi, T., 2018. Empirical analysis of hazard perception and driving behaviors among high school and college students on motorcycles in Phnom Penh, Cambodia. IATSS Research 42(4), 171-179. doi: 10.1016/j.iatssr.2018.12.004
Young, K.L., Regan, M.A., Triggs, T.J., et al., 2010. Intelligent speed adaptation-effects and acceptance by young inexperienced drivers. Accident Analysis & Prevention 42(3), 935-943.
Yuan, W., 2000. The effectiveness of the "ride-bright" legislation for motorcycles in Singapore. Accident Analysis & Prevention 32(4), 559-563.
Yuen, C.W., Karim, M.R., Saifizul, A., 2014. Analysis of motorcyclist riding behaviour on speed table. The Scientific World Journal 2014(1), 236396.
Yuen, C.W., Karim, M.R., Saifizul, A., 2015. Investigation on motorcyclist riding behaviour at curve entry in the down slope terrain. KSCE Journal of Civil Engineering 19, 749-755. doi: 10.1007/s12205-013-2607-8
Zador, P.L., 1985. Motorcycle headlight-use laws and fatal motorcycle crashes in the US, 1975-1983. American Journal of Public Rlealth 75(5), 543-546.


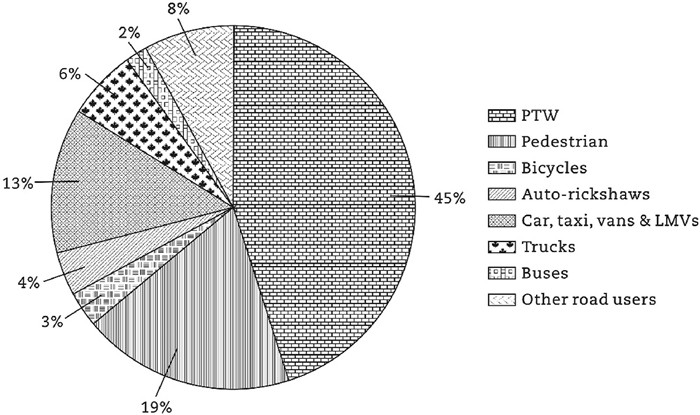
计量
- 文章访问数: 80
- HTML全文浏览量: 0
- PDF下载量: 4

