 搜索
搜索
-
Abstract:
Wind engineering has made significant strides in addressing the challenges posed by exceptional terrains, where traditional methodologies often fall short. This paper reviews the advances in wind tunnel technology and computational fluid dynamics (CFD) that have revolutionized the understanding and prediction of wind effects on bridges, particularly in complex environments. The integration of advanced measurement techniques with wind tunnel experiments has provided deeper insights into wind characteristics, leading to more accurate aerodynamic designs for bridges. The application of these technologies in unique terrains has been instrumental in ensuring the safety and stability of critical infrastructures. The paper reviews the importance of continuous research and collaboration in wind engineering to address the evolving demands of infrastructure in challenging terrains. The article also introduces the wind tunnel facilities at Chang'an University, detailing their capabilities and contributions to research in wind engineering, including the study of aerodynamic performance and control measures for bridges. It is concluded by reflecting on the research team's 20-year journey at Chang'an University, noting their growth, achievements, and contributions to the field of wind engineering.
-
1. Introduction
1.1 Wind tunnel
Wind tunnel as an important experimental facility, has become an indispensable tool in the research of fluid dynamics and aerodynamics. It is widely applied in various fields such as scientific research, engineering design, technological innovation, and safety assessment. Wind tunnels provide a controlled experimental environment for fundamental research in fluid dynamics and aerodynamics. Through wind tunnel experiments, we can more intuitively observe and analyze the physical processes that occur when air flow over the surface of objects, gaining a deeper understanding of complex phenomena such as turbulence, flow separation, and vortices. These studies not only advance the development of fluid dynamics theory but also provide foundational theoretical research for other disciplines. The talents nurtured by wind tunnel research are the interdisciplinary professionals needed by society and the nation in the new era. In the future, with continuous technological advancements and the deepening of interdisciplinary integration, wind tunnels will continue to provide strong support and innovative momentum for the development of various fields.
The concept of the wind tunnel was first proposed by British engineer Francis Herbert Wenham (Fig. 1). In 1871, he and his colleague John Browning designed and built the world's first wind tunnel. For the first time, experiments demonstrated that wings with a high aspect ratio have a better lift-to-drag ratio than shorter wings with the same lift area. Early wind tunnel devices (Fig. 2) were primarily used to study the effects of airflow on objects. Nationally funded aeronautical laboratories began to emerge in countries like the United Kingdom, France, Germany, Italy, and Russia, and these laboratories naturally included wind tunnels. Wind tunnel technology also saw significant advancements, with the scale and complexity of wind tunnel laboratories increasing substantially.
![]() Figure 1. Francis Herbert Wenham (https://en.wikipedia.org/wiki/Francis_Herbert_Wenham).
Figure 1. Francis Herbert Wenham (https://en.wikipedia.org/wiki/Francis_Herbert_Wenham).![]() Figure 2. Early wind tunnel concept diagram (file: Windtunnel1-en.svg-Wikimedia Commons) (https://commons.wikimedia.org/wiki/File:Windtunnel1-en.svg).
Figure 2. Early wind tunnel concept diagram (file: Windtunnel1-en.svg-Wikimedia Commons) (https://commons.wikimedia.org/wiki/File:Windtunnel1-en.svg).In 1908, in Göttingen, Germany, the world's first closed-circuit wind tunnel (Fig. 3) was built under the guidance of the renowned aerodynamicist Ludwig Prandtl. This design connected the ends of the wind tunnel in a loop and included the installation of guide vanes, screens, and honeycomb dampers at critical points to achieve a uniform airflow. The two types of wind tunnels mentioned above are the commonly used open-circuit wind tunnels and closed-circuit wind tunnels seen today.
![]() Figure 3. Early closed-circuit wind tunnel concept diagram (https://upload.wikimedia.org/wikipedia/commons/c/c3/Windtunnel3-num.svg).
Figure 3. Early closed-circuit wind tunnel concept diagram (https://upload.wikimedia.org/wikipedia/commons/c/c3/Windtunnel3-num.svg).The development of wind tunnels in China can be traced back to the 1950s–1970s. In 1958, China built its first large-scale low-speed wind tunnel, the Beijing low-speed wind tunnel (BLWT) as shown in Fig. 4. With strong national support and in the context of the Reform and Opening-Up policy, China made significant progress in wind tunnel construction by introducing advanced foreign technology and pursuing independent research and development. In 1984, the China Aerodynamics Research and Development Center was established, marking an important milestone in the development of wind tunnels in New China. During this period, China built several large-scale wind tunnels, such as the JF12 shock wave wind tunnel in Mianyang, Sichuan, which was one of the largest hypersonic wind tunnels in the world at the time.
![]() Figure 4. China's first wind tunnel capable of serving both aeronautical engineering and scientific research (currently exhibited at the National Museum of China).
Figure 4. China's first wind tunnel capable of serving both aeronautical engineering and scientific research (currently exhibited at the National Museum of China).In the latter half of the 20th century, with advancements in science and the iterative upgrading of computers, wind tunnel laboratories gradually integrated computer control systems and data collection and processing systems, significantly improving the accuracy and efficiency of experiments. In the early 21st century, the development of computational fluid dynamics (CFD) made it possible to combine wind tunnel testing with numerical simulations, further enhancing the understanding and control of aerodynamic phenomena as fluids interact with different objects. Wind tunnel test data provides a crucial validation foundation for CFD (Figs. 5 and 6). Through interdisciplinary research between computer science and fluid dynamics, CFD can simulate more complex flow phenomena, reduce the number of physical experiments required, and shorten research cycles. The integration of CFD and wind tunnel testing has made engineering practices more precise and efficient.
Wind tunnels are categorized based on their speed into various types such as low-speed, medium-speed, high-speed, and supersonic wind tunnels. Low-speed wind tunnels have airflow speeds typically below 300 m/s and are used to study aerodynamic phenomena in the subsonic range. These tunnels are mainly used for testing the aerodynamic performance of buildings, automobiles, and small aircraft models. High-speed wind tunnels have airflow speeds ranging from 300 m/s to 340 m/s and are used to study flow phenomena under near-factor conditions. Supersonic wind tunnels have airflow speeds usually between 1.2 Mach and 5 Mach (where 1 Mach is 340 m/s) and are primarily used to study the aerodynamic performance and thermodynamic characteristics of supersonic aircraft. Hypersonic wind tunnels have airflow speeds exceeding Mach 5 and are used to investigate the aerodynamic and thermodynamic properties of hypersonic vehicles.
Wind tunnels can also be classified into aerodynamic wind tunnels, environmental wind tunnels, and climatic wind tunnels, among others. Environmental wind tunnels are primarily used to simulate wind characteristics under specific environmental conditions. For example, atmospheric boundary layer wind tunnels can replicate the wind speed profiles and turbulence characteristics of the atmospheric boundary layer near the ground. These wind tunnels are widely used in research related to high-rise buildings, wind power generation, and bridge engineering.
1.2 Application of boundary layer wind tunnel and structural engineering
In the category of wind tunnels, boundary layer wind tunnels are a specialized type designed specifically to study the aerodynamic performance and structural response of structures in various wind environments. They help engineers optimize bridge designs to enhance wind resistance, safety, and comfort. With the development of the Belt and Road Initiative, the demand for bridges with enhanced spanning capabilities has increased. As bridge structures continue to innovate and improve spanning capabilities, they have become more flexible, resulting in increased sensitivity to wind. For such a case, there is great need of experimental studies for the bridge structures implemented in the boundary layer wind tunnels.
With the ongoing sustainable development of the national economy and the advancement of related collaborations such as the Belt and Road Initiative, the advantages of transportation infrastructure have become particularly significant. The demand for high-quality infrastructure has been rising globally. Large-span bridges, which are critical for national economic and public welfare, have seen significant advancements in design theory, construction technology, and new materials. For example, the Akashi Kaikyō Bridge in Japan has a main span length of 1991 m, the Storebælt East Bridge in Denmark spans 1642 m, the Humber Bridge in the UK has a main span of 1418 m, and the Çanakkale Bridge in Turkey has surpassed 2000 m, reaching 2023 m.
Currently, China's large-span bridge construction technology is among the best in the world, with eight bridges ranking among the top for main span lengths in global suspension bridges and nine in global cable-stayed bridges. See Tables 1 and 2, Figs. 7-9 for details. Notably, the Zhangjinggao Bridge, when completed, will have a main span of 2300 m.
Table 1. Top 10 suspension bridges.No. Bridge name Main span (m) Country Year 1 Zhangjinggao Bridge 2300 China Under construction 2 Shiziyang Bridge 2180 China Under construction 3 1915 Canakkale Bridge 2023 Turkey 2022 4 Akashi Kaikyo Bridge 1991 Japan 1998 5 Yanji Changjiang Bridge 1860 China Under construction 6 Shuangyumen Bridge 1768 China Under construction 7 Xianxinlu Bridge 1760 China Under construction 8 Yangsi Harbor Bridge 1700 China 2019 9 Nansha Bridge 1688 China 2019 10 Lingdingyang Bridge 1666 China 2024 Table 2. Top 10 cable stayed bridges.No. Bridge name Main span (m) Country Year 1 Changtai Bridge 1208 China 2024 2 Guanyinsi Bridge 1160 China Under construction 3 Maanshan Changjiang Bridge 1120 China Under construction 4 Russky Bridge 1104 Russian 2012 5 Hutong Changjiang Bridge 1092 China 2020 6 Sutong Changjiang Bridge 1088 China 2008 7 Stone-cutter Bridge 1018 China 2009 8 Wuhan Qingshan Changjiang Bridge 938 China 2019 9 Edong Changjiang Bridge 926 China 2010 10 Jiayu Changjiang Bridge 920 China 2019 ![]() Figure 7. Lingdingyang Bridge (https://www.peopleapp.com/column/30045285480-500005480751).
Figure 7. Lingdingyang Bridge (https://www.peopleapp.com/column/30045285480-500005480751).![]() Figure 8. Changtai Bridge (https://cn.chinadaily.com.cn/a/202403/26/WS66037507a3109f7860dd7109.html).
Figure 8. Changtai Bridge (https://cn.chinadaily.com.cn/a/202403/26/WS66037507a3109f7860dd7109.html).![]() Figure 9. Shiziyang Bridge (https://www.polycd.com/Item/5476.aspx).
Figure 9. Shiziyang Bridge (https://www.polycd.com/Item/5476.aspx).In the global rankings of bridges, many are renowned for their intricate design and technological innovations. These bridges not only demonstrate humanity's spirit of pushing engineering technology to new heights but also endure severe tests from extreme natural environments. Among these, the impact of wind disasters on bridge structures is particularly significant. Historically, many famous bridges around the world have suffered from wind-related disasters, resulting in varying degrees of damage, with some even collapsing. These events underscore the importance of wind engineering in bridge design and construction. Therefore, in-depth research into the stress and vibration characteristics of bridges in different wind environments and the design of wind-resistant measures tailored to the specific types of bridges have become crucial for ensuring the safety and comfort of bridge structures.
The damage caused to bridges by wind varies in nature. Below are some notable cases that illustrate different types of wind-induced damage.
1.2.1 Tacoma Narrows Bridge
On November 7th, 1940, the Tacoma Narrows Bridge in Washington State, USA, collapsed due to inadequate design, particularly its slender and lightweight main span structure. Under specific wind speeds (approximately 17.8 m/s), the bridge experienced severe flutter, which ultimately led to its collapse (Figs. 10 and 11). The bridge had a main span of 1372 m, making it the third-longest suspension bridge in the world at that time. Although there had been previous instances of wind-induced vibrations in bridges, the collapse of the Tacoma Narrows Bridge was meticulously documented by a film crew, bringing a heightened awareness to wind resistance in bridge engineering (Fig. 11).
1.2.2 Humen Bridge
The Humen Bridge is a critical transportation hub in Guangdong Province, China, spanning the Pearl River and connecting Guangzhou and Dongguan. On May 5, 2020, the Humen Bridge experienced significant vertical vibrations under moderate wind speeds, causing the bridge deck to oscillate dramatically and drawing widespread public attention (Fig. 12). The main cause of the vibration was the generation of vortex shedding due to the placement of water barricades, which created alternating pressure on the bridge structure and induced periodic vibrations. Engineers responded by first removing the water barricades and shifting the maintenance tracks underneath towards the center to alter the overall aerodynamic structure of the bridge. They also optimized the bridge deck structure and installed dampers and other vibration reduction measures to mitigate vortex-induced-vibrations and ensure the long-term safety and stability of the bridge.
![]() Figure 12. Humen Bridge vibration (http://m.news.cctv.com/2020/05/05/ARTIcs2exeit5tpC97p8960X200505.shtml).
Figure 12. Humen Bridge vibration (http://m.news.cctv.com/2020/05/05/ARTIcs2exeit5tpC97p8960X200505.shtml).1.2.3 Golden Gate Bridge
The Golden Gate Bridge, a landmark transportation infrastructure in California and a critical connection point in the San Francisco Bay Area, was struck by a severe storm on December 1st, 1951, resulting in unusual vibration responses. After thorough analysis, it was determined that the vibrations were primarily caused by the bridge's original open π-shaped cross-section, which, under strong winds, induced complex vortex shedding phenomena and triggered bridge flutter. Engineers added diagonal bracing to the bottom of the bridge and converted the original open π-shaped cross-section to a closed cross-section. As shown in Fig. 13, this modification improved the overall structural wind stability, reduced the generation and shedding of wind-induced vortices, and diminished the periodic aerodynamic excitation on the bridge structure, thereby reducing both the amplitude and frequency of the vibrations.
![]() Figure 13. Golden Gate Bridge. (a) Original cross-section. (b) Added bottom support (https://www.goldengate.org/exhibits/resisting-the-twisting/).
Figure 13. Golden Gate Bridge. (a) Original cross-section. (b) Added bottom support (https://www.goldengate.org/exhibits/resisting-the-twisting/).1.2.4 Akashi Kaikyo Bridge
The Akashi Kaikyo Bridge (Fig. 14) eventually became a suspension bridge with a total length of 3911 m (with a main span of 1991 m). Compared to typical suspension bridges, the importance of wind resistance design for the Akashi Kaikyo Bridge is significantly higher. The implementation of open lattice structures and central stability plates has had a substantial impact on the bridge's wind resistance, particularly its flutter performance.
1.2.5 Volgograd Bridge
On May 20, 2010, the New Bridge in Volgograd, Russia, which spans the Volga River, experienced a shaking incident caused by wind forces, leading to a traffic disruption as shown in Fig. 15. Meteorological data indicated that the average wind speed ranged from 11.6 m/s to 15.6 m/s, with the wind direction deviating 7° from the bridge's longitudinal axis. The terrain conditions resulted in relatively low wind speeds and stable wind direction, with minimal turbulence. However, this wind condition triggered vortex shedding, whose frequency coupled with the bridge's fundamental perpendicular frequency, leading to vortex-induced-vibrations with an amplitude limit of 1.0 m. To address this issue, the engineering team installed Tuned Mass Dampers (TMDs), which absorbed and dissipated the vibrational energy of the bridge's main structure, reducing the amplitude of the vibrations and enhancing structural stability.
![]() Figure 15. Vortex-induced-vibration of Volgograd bridge (https://www.nettavisen.no/nyheter/broen-som-skremmer-en-hel-verden/s/12-95-2910032).
Figure 15. Vortex-induced-vibration of Volgograd bridge (https://www.nettavisen.no/nyheter/broen-som-skremmer-en-hel-verden/s/12-95-2910032).1.3 Chang'an University Wind Tunnel Laboratory
As the span of bridges increases, the impact of wind-induced vibrations becomes more significant, making wind tunnel testing an essential research tool. Under the leadership of Professor Jianxin Liu and with the support of relevant departments, the wind and seismic resistance research team of Chang'an University is responding to the national call and contributing to the development of the Belt and Road Initiative, a strong transportation nation, and bridge wind engineering.
Chang'an University's Wind Tunnel Laboratory houses three wind tunnels: CA-01, CA-03, and CA-04. The CA-01 wind tunnel was completed and began operation in October 2004, making it the third wind tunnel at a university in China at that time. This wind tunnel is an atmospheric boundary layer wind tunnel designed to simulate near-ground atmospheric wind characteristics. The aerodynamic profile of the CA-01 wind tunnel is 44.0 m long, with a maximum width of 16.0 m. The test section is 15.0 m long, with a cross-section of 3.0 m wide by 2.5 m high. The CA-01 wind tunnel features a dual-mode construction, capable of operating as both a closed-circuit and an open-circuit wind tunnel (Figs. 16 and 17). It includes a 5-m long movable section within the wind tunnel circuit. When the intake and exhaust side doors of the second cross-section segment are closed, it operates as a closed-circuit wind tunnel. When the movable section is removed and both side doors are open, it functions as an open-circuit wind tunnel. The unique design of the CA-01 wind tunnel allows for various tests in the movable section, including cable force measurement, vibration testing, wind and rain excitation, and model tests. The aerodynamic profile is illustrated in the following diagram.
![]() Figure 16. Chang'an University's wind tunnel CA-01. (a) Wind tunnel floor plan. (b) Movable section.
Figure 16. Chang'an University's wind tunnel CA-01. (a) Wind tunnel floor plan. (b) Movable section.The CA-03 wind tunnel began operation in October 2022. It is designed as an atmospheric boundary layer open-circuit wind tunnel and shares the power section with the CA-01 wind tunnel. The test section is 16.0 m long, 15.2 m wide, and 2.0 m high, with a maximum wind speed of 13.7 m/s. The aerodynamic profile is shown in Fig. 18. This wind tunnel is capable of conducting various large-scale sectional model tests, including those for large-scale sectional models, full-bridge aeroelastic models, and terrain models.
As shown in Fig. 19, the wind tunnels at Chang'an University are arranged in a double-layer structure, with one wind turbine serving both layers. By using internal ducting to switch between sections, each wind tunnel can be utilized as needed.
The CA-04 wind tunnel is a downburst simulation device with a nozzle diameter of 0.55 m and a nozzle-to-ground height of 1 m (Figs. 20 and 21). The tunnel is cylindrical with an inner diameter of 0.81 m and is supported by a 6-m long rail, allowing for the simulation of moving downbursts. The downburst simulator can achieve a maximum rotational speed of 1450 rpm, a maximum airflow of 37,200 m3/h, and a rated power of 4 kW, as shown in the figures below.
1.4 Research areas of the wind tunnel research team at Chang'an University
1.4.1 Wind resistance performance and control measures for bridge structures
Force measurement tests: using scaled model experiments of the main bridge girder, simulate the aerodynamic shape and ancillary facilities of the girder in both the completed and construction states. Measure the static aerodynamic lift coefficient, static aerodynamic drag coefficient, and static aerodynamic moment coefficient at different wind attack angles to accurately determine the static wind loads acting on the bridge girder. These measurements provide fundamental parameter for subsequent wind vibration analysis.
The Liulin Bridge (Fig. 22) is an innovative and unique type of bridge located between the Central Ring Road and the Outer Ring Road in Tianjin, spanning the Haihe River. Wind tunnel force measurements are used to verify the safety performance of the bridge under static wind conditions.
Sectional model vibration tests: conduct vortex vibration tests on the main bridge girder in both uniform and turbulent flow fields to determine the vortex-induced-vibration lock-in wind speed and maximum amplitude for the completed bridge state, as well as to identify vortex vibration suppression measures. Measure the flutter critical wind speed for both the original design and after applying the vortex vibration suppression measures. If flutter stability does not meet the specification requirements, further aerodynamic optimization measures are needed.
The Huangmaohai sea-crossing project is an important component of the westward expansion of the Hong Kong–Zhuhai–Macau Bridge, forming a vital link to the western Guangdong region. Due to the complex topography and frequent typhoon landings at the proposed bridge site, the study of the Huangmaohai Bridge's wind resistance performance is particularly important. This test involves a large-scale cross-sectional model and is conducted in the CA-03 atmospheric boundary layer wind tunnel at Chang'an University's Wind Tunnel Laboratory as shown in Fig. 23.
The Lingding Channel Bridge of the Shen-Zhong Sea-crossing project is a double-tower parallel cable plane steel box girder suspension bridge, connecting Shenzhen City and Zhongshan City in Guangdong Province. Due to the bridge's sensitivity to wind effects, it is essential to conduct wind tunnel tests to ensure the wind resistance safety and operational comfort of the Lingding Channel Bridge during its operational period. This will allow for a comprehensive evaluation of the bridge's wind resistance performance (Fig. 24).
![]() Figure 24. The Lingding Channel Bridge project. (a) Small scale sectional model. (b) Vibration test.
Figure 24. The Lingding Channel Bridge project. (a) Small scale sectional model. (b) Vibration test.Full-bridge aeroelastic testing: full-bridge aeroelastic models can realistically simulate the dynamic characteristics of the structure and accurately reflect the dynamic interaction between the structure and the flow. This type of testing is primarily used to assess the aerodynamic performance of the bridge structure under uniform flow, including static wind stability, vortex-induced-vibration, flutter, and galloping, as well as the buffeting response under turbulent conditions.
The Huajiang Gorge Bridge features a portal tower design, with two towers standing at 262.0 m and 195 m tall, respectively (Fig. 25). The main span consists of a 1420 m steel truss cross-section. The bridge deck is situated at an elevation of 1081.5 m, making it the highest bridge in the world in terms of vertical height from the water surface. The bridge spans a typical deep U-shaped gorge with steep cliff slopes of 80°–90°. The rock types on either side of the gorge are mainly carbonate hard rocks, and the terrain consists of rugged, undulating mountain peaks. Due to the extreme topography and the bridge type's high wind resistance requirements, a comprehensive evaluation of the bridge's wind resistance performance is necessary. This test is conducted in the CA-03 atmospheric boundary layer wind tunnel at Chang'an University's Wind Tunnel Laboratory (Fig. 26).
![]() Figure 25. The Huajiang Gorge Bridge project. (a) Full-bridge aeroelastic model in a uniform flow field. (b) Full-bridge aeroelastic modeling in a class C wind field.
Figure 25. The Huajiang Gorge Bridge project. (a) Full-bridge aeroelastic model in a uniform flow field. (b) Full-bridge aeroelastic modeling in a class C wind field.The Longmen Bridge is a cross-sea bridge spanning the Longmen Strait, connecting the inner and outer bays of Qinzhou Bay. The main bridge of Longmen Bridge features a single-span suspension bridge with a main span of 1098 m. Due to its relatively lightweight structure, the suspension bridge is highly sensitive to wind effects. The stability of the structure under wind action has become a crucial factor affecting and controlling the design and construction of suspension bridges. Under dynamic wind loads, the bridge experiences various wind-induced vibration phenomena, predominantly flutter and vortex-induced-vibrations.
1.4.2 Wind resistance performance and control measures for building structures
The Hangzhou Bay Bridge project is located at the confluence of the Qiantang River estuary and Hangzhou Bay, with a total length of 36 km. The observation tower structure, including the top mast, reaches a total height of 146.5 m and is designed with a circular layout. Due to the fact that this structure is a typical wind-sensitive structure, especially being situated in a region prone to strong typhoons, wind loads, and wind-induced vibrations are the main factors controlling the structural design. Conducting a scientific and reasonable wind-resistant design ensures the safety and comfort of the structure. In November 2004, the Wind Tunnel Laboratory of Chang'an University was commissioned by the Hangzhou Bay Bridge project construction command to carry out multiple wind tunnel tests on the wind resistance performance of the offshore platform and observation tower of the Hangzhou Bay Bridge project (Fig. 27).
![]() Figure 27. Hangzhou Bay Bridge project. (a) Sightseeing tower test mode. (b) Test model of platform in the sea. (c) Cluster test.
Figure 27. Hangzhou Bay Bridge project. (a) Sightseeing tower test mode. (b) Test model of platform in the sea. (c) Cluster test.1.4.3 On-site measurement of wind characteristic parameter
Field wind observations play a critical role not only in structural engineering but also in meteorological research and disaster warning systems. By observing and analyzing wind data, we can better understand the formation and variability of wind patterns, improving the accuracy of predictions related to wind environmental parameter. This, in turn, provides a scientific basis for the design of bridges and other structures, ensuring they are adequately prepared to withstand the specific wind conditions they may encounter (Figs. 28 and 29).
![]() Figure 29. Characterization of the terrain on which the wind observation instruments are located.
Figure 29. Characterization of the terrain on which the wind observation instruments are located.1.4.4 Experimental simulated wind characteristics tests for local areas
The construction of the Heihui River Bridge effectively shortens the time and space distance between the Central Yunnan Economic Zone and the Dehong Free Trade Area, facilitating coordinated development between these two economic regions. The elevation at the bridge site ranges from 1174.78 m to 1540.00 m, with a relative height difference of approximately 365.22 m. The site features a mid-mountain landscape formed by river erosion and deposition, with an asymmetrical terrain distribution on both sides of the river. To comprehensively understand the wind field characteristics at the bridge site, this study involved the design and creation of a terrain model covering a diameter of 3.0 km around the bridge site. The model was developed considering the bridge's main span length of 1026 m, the wind tunnel test section width of 15 m, and the blockage ratio requirements. Wind tunnel tests were then conducted to determine the key wind parameter at the bridge site under varying wind direction angles (Figs. 30 and 31).
1.4.5 Numerical simulation
By utilizing CFD and selecting an appropriate mathematical model for air turbulence, combined with numerical algorithms and graphical display techniques, the results from the numerical wind tunnel simulations can be visually and intuitively represented. Compared to traditional model testing methods, this approach offers several advantages, including shorter computation cycles, richer data information, and the ability to easily simulate a variety of different conditions (Figs. 32 and 33).
1.5 Goal for the research and team
Chang'an University Wind Tunnel Laboratory began the research in bridge and structural wind engineering began in October 2004 with the commissioning of the CA-01 wind tunnel. Using this as a platform, Professor Jianxin Liu from the Bridge Engineering Department established the university's wind research team. Initially, the team consisted of 5 dedicated researchers, with around 15 graduate students involved in wind engineering research. Over the past 20 years, the team has expanded to include 10 dedicated researchers, 80% of whom have received systematic training in wind engineering, and 90% have had overseas exchange experiences. The total number of former and current graduate students exploring the field of wind engineering has reached over 300.
Throughout these two decades, the research team has provided technical services in the wind engineering field for various types of bridges and structures, while also conducting specialized studies. The team has made significant discoveries and developed unique vibration mitigation measures in areas such as near-surface atmospheric boundary layer wind characteristics, wind-induced vibrations of bridges and structures, static wind stability, wind load calculations, and vibration control.
2. Research on wind characteristics
The characteristics of the wind field can mainly be divided into average wind characteristics and fluctuating wind characteristics. Currently, the main research methods for wind field characteristics include theoretical analysis, field measurements, wind tunnel tests, and numerical simulations. Theoretical analysis serves as the foundation; field measurements are the most accurate method and also serve as a means to validate other research approaches; wind tunnel testing is the most commonly used method for studying wind field characteristics and is closely aligned with field measurement results; numerical simulation is the most efficient and cost-effective method, and its accuracy continues to improve with advances in theory and computer technology. Chang'an University Wind Tunnel Laboratory has made significant contributions in all aspects of wind characteristic research. Below, the results of the past twenty years of the Wind Tunnel Laboratory's work will be introduced from four aspects: field measurements, wind tunnel tests, numerical simulations, and practical engineering applications, as shown in Fig. 34.
2.1 Wind characteristics field measurements
In the field of wind engineering research, the study of wind characteristics is essential for selecting more reasonable wind parameter in structural wind-resistant design. Current standards are primarily applicable to flat terrains and isotropic wind field conditions. However, to investigate the wind field characteristics in complex terrains and extreme wind conditions under normal wind action, long-term field measurements are often necessary (Liu and Li, 2005). For China's western regions, characterized by overlapping mountains, deep valleys, and expansive deserts, the wind environment and bridge structures exhibit significantly different characteristics compared to the eastern and central regions of China. This has led to discussions on the research content and issues that should be addressed in the field of bridge wind engineering in the western regions. Additionally, related wind environment observations and wind tunnel tests are introduced. During field measurements, conventional ultrasonic anemometer are typically used. Given the limitations in the monitoring positions of these anemometer, some researchers have established wind observation towers or deployed multiple anemometer along existing structures to gather wind parameter information from more locations. This allows for the study of the spatial distribution of wind parameter and the spatial correlation between them. As technology advances and the need for more refined structural design increases, long-range, wide-area, and high-precision equipment such as sonic radars and LIDARs are increasingly being utilized.
2.1.1 Synoptic wind
The field measurement of normal wind characteristics by Chang'an University's Wind Tunnel Laboratory can be mainly divided into three types of terrain: (1) wind field environments that suddenly change from narrow valleys to open plains at mountain passes; (2) wind fields situated in canyons with indeterminate forms; (3) coastal terrains where the wind field environment is significantly influenced by oceanic conditions.
In the field measurement of wind characteristics in mountain pass terrains, Liu (2007), Zhang and Hu (2008) established a 60 m wind observation station and two 30 m stations at the site of the Yumenkou Yellow River Highway Bridge in Shanxi Province. Using 2D and 3D ultrasonic anemometer, they conducted wind environment observations at the Yumenkou Yellow River Bridge site, collecting one and a half years of field data. By screening the data based on the principle of strong winds, where the maximum wind speed exceeded level 6 (wind speed greater than 10.8 m/s), they analyzed the wind speed, wind direction, wind attack angle, wind profile index, turbulence intensity, gust factor, turbulence integral scale, turbulence power spectral density, and spatial correlation of turbulence over the one and a half years. The results indicated that the wind field at the bridge site was complex, with the measured wind speed at the bridge deck height (20 m) being higher than historical wind speed data from the Hejin meteorological station, and at times, the wind speed at 20 m was greater than at 45 m. The wind profile belonged to a mountainous wind profile, not fully adhering to the power-law distribution. The turbulence intensity of strong winds showed a decreasing trend from the ground to high altitudes. The measured turbulence integral scale values were scattered, and the measured wind spectrum only fit well with the theoretical spectrum in the high-frequency range. Bai et al. (2010a) carried out pioneering wind field observations in the special terrain of the middle and upper reaches of the Yellow River, the terrain as specified in Fig. 35. They installed five 2D anemometer and one 3D ultrasonic anemometer at heights from 10 m to 60 m on a 65 m tower, and also set up two 30 m measurement towers on the riverbank. To efficiently process the large amount of wind speed observation data, they developed a wind speed observation data processing system V1.0 based on Borland C++ Builder. This method provided a detailed understanding of the wind field distribution and patterns around the western gap of the river valley (Fig. 36) for the first time. Further, they used the CFD to simulate the wind field as it flows from the canyon to the open area, similar to the process of wind flowing from a narrow channel to an open region. This validated the accuracy and efficiency of the numerical simulation method, providing important value for theoretical development and practical engineering applications. It offered valuable information and tools for understanding and predicting wind characteristics in complex terrains, as well as for the design and safety assessment of related engineering structures.
Zhang et al. (2014) conducted studies on wind characteristics in both inland strong wind belts and coastal typhoon zones. By analyzing the causes, characteristics, and wind parameter of these two types of strong winds, they carried out multi-station, multi-point three-dimensional observations at the Yumenkou Yellow River Bridge site. They obtained wind data over 538 observation days, and through statistical analysis, they derived the distribution and patterns of wind field parameter in inland strong wind zones. The study found that the wind environment at bridge sites in complex terrains of inland strong wind zones was significantly influenced by the terrain. The fluctuating wind characteristics showed significant differences from the parameter values specified in the Wind-resistant Design Specification for Highway Bridges (2018) for flat terrains. Gao et al. (2018a) addressed the issue of scarce wind characteristic parameter in complex terrains by selecting three typical strong wind zones for field measurement studies. They found that in canyon and mountain pass areas, the wind direction was consistent with the canyon's orientation, and the wind speed and direction had significant seasonal variations. The wind attack angle fluctuated within ±5°, the wind profile index increased with wind speed, and the average turbulence intensity was lower than the recommended values in the code. The distribution of the 3D turbulence intensity also differed significantly from the code's recommended values. Compared to the code's recommended values, the measured integral scale at 70 m tower height was larger. The turbulence power spectra along the height direction of the wind towers showed little difference, with the pulsation frequency increasing with height. Additionally, the results from 2D and 3D anemometer(except for wind direction angle) were consistent, but the extreme wind speeds measured by the 3D anemometer were significantly higher than those by the 2D anemometer.
Liu (2020) conducted a study focusing on the mountain pass and river beach topography of the Yumenkou area. They installed a phased array Doppler radar as shown in Fig. 37 on the Yellow River beach near the main bridge and two 2D ultrasonic anemometer at the height of the main beam, collecting over a year of field data. Using Matlab programs, they sectional, screened, statistically analyzed, fitted, and plotted the data to obtain the average and fluctuating wind characteristics at different heights in the area. During periods of strong winds, the wind speed followed the pattern of increasing with height, and the distribution range of wind direction angles was relatively stable, with clear stratification in both wind speed and direction angles as height increased. However, at lower wind speeds, the wind speed near the ground could be higher than at higher altitudes, where the wind direction angle was significantly influenced by the terrain, leading to chaotic and disordered distribution. As height increased, the dispersion range of the wind attack angle gradually decreased, with the mean attack angle shifting towards negative values and greater dispersion. None of the existing empirical spectrum expressions could accurately describe the measured spectrum.
Li et al. (2020a) studied the trumpet-shaped valley terrain, where the river transitions from mountainous areas to flat regions. This terrain exhibits both the characteristics of mountainous canyons and plains, with complex topography. Using a 3D scanning laser radar (Fig. 38), multiple points were observed within the valley, with measurement points arranged along a local double-tower cable-stayed bridge. Along the bridge's axis, one virtual wind measurement tower was set every 141 m, with a total of four virtual towers conducting field measurements over six months. The study ultimately obtained wind profiles at different positions within the trumpet-shaped valley, as well as the average wind speed and direction at various positions and heights. The research found that wind speeds increased at certain heights, mainly in the middle and lower parts of the valley, which was related to changes in incoming wind direction and topography. The wind profile in the trumpet-shaped valley was more complex than the models listed in the current code (Ministry of Transport of the People's Republic of China, 2018), making it difficult to describe using existing models, though it could still be represented by a power function. Influenced by the incoming flow and surrounding topography, the wind speed at the bridge deck height in the mid-span position was higher than at the sides during high wind speeds. The wind direction at different positions along the bridge deck height varied due to the influence of the incoming flow direction and topography. The distribution of wind direction along the bridge axis and valley height was uneven, and wind direction along the bridge axis could vary due to topographic effects, while the vertical distribution of wind direction in the valley changed with local atmospheric wind direction. The observed results differed significantly from the current code's description of wind characteristics.
Li et al. (2020b) conducted the long-term observations of the wind field in a trumpet-shaped mountain pass, systematically studying the wind characteristics in the area. They discussed in detail the wind characteristics, wind yaw angle, average wind speed, and the impact of wind profiles on the buffering response of bridge towers. The study found that the average wind speed characteristics were significantly influenced by the topography, with a high degree of wind profile distortion. Statistical analysis of monthly maximum wind speeds and annual maximum wind speeds indicated that a log-log distribution was the best-fitting model, while the generalized extreme value (GEV) distribution might underestimate extreme wind speeds. The study also pointed out that assessing the buffering response of bridge towers based on designed wind characteristics might overestimate the response. The buffering response of the tower was significantly influenced by the wind yaw angle and average wind speed. To accurately estimate the buffering response of bridge towers during construction, the effect of wind profile distortion must be considered, which is crucial for ensuring the safety and reliability of bridge structures. Based on the quasi-steady state theory, a multimodal coupled buffering frequency domain calculation method was derived for bridge towers with varying cross-sections under distorted wind profile conditions.
Wang et al. (2021a) selected a mountain pass and river beach as the study area, setting up observation instruments at different locations and establishing temporary observation stations to collect more than a year of field data. After processing the measurement data collected during the observation period, the average and fluctuating wind characteristics of the area were obtained. When compared with existing codes, the study found that the wind field in the area exhibited strong non-stationarity, with significant deviations between the characteristic values of the wind field in the code and the actual measurements. This finding highlights the importance of conducting wind field observations in mountain pass and riverbank areas.
Shen (2021) established five wind observation towers and a Doppler acoustic radar observation station under a trumpet-shaped mountain pass to conduct long-term wind observations of two large-span bridges as shown in Fig. 39. The measurements showed that the strong winds in the trumpet-shaped mountain pass mainly came from the northwest, with significant distortion in wind direction and wind speed profiles.
Gao (2022) conducted a 10-month wind characteristics measurement at the Yumenkou Yellow River Bridge using a VT-1 phased array Doppler radar system and two Windsonic 2D ultrasonic anemom. Using mathematical statistics, the wind speed, wind direction angle, wind attack angle, wind profile, turbulence intensity, gust factor, turbulence integral scale, and turbulence power spectrum were analyzed. The study proposed a method for classifying wind profiles using cluster analysis and compared the results with code-recommended values, summarizing the peculiarities of mountainous wind fields. The results showed that, compared to general wind fields, mountainous wind fields had clear dominant wind directions and diverse wind profile forms. The code-recommended power law, Kaimal turbulence power spectrum, and other models were not applicable to mountainous wind fields. The results of the cluster analysis are shown in Fig. 40.
![]() Figure 40. Wind profile clustering results. (a) Clustering results (category 2). (b) Clustering results (category 3). (c) Clustering results (category 4). (d) Clustering results (category 5). (e) Clustering results (category 6). (f) Clustering results (category 7).
Figure 40. Wind profile clustering results. (a) Clustering results (category 2). (b) Clustering results (category 3). (c) Clustering results (category 4). (d) Clustering results (category 5). (e) Clustering results (category 6). (f) Clustering results (category 7).Hui (2018) studied a specific valley, recommending the establishment of temporary meteorological stations in similar terrain, using a remote control system to adjust observation coefficients in real-time, and observing weather and instrument conditions. Two years of field data were obtained. A method for processing wind field data in this type of terrain and the data collected by the instruments was proposed, with Matlab programs developed for data segmentation, screening, statistical analysis, parameter fitting, and plotting. The average and fluctuating wind characteristics of the valley wind field were obtained. Comparison revealed significant deviations between the measured wind field characteristics and the code's specifications.
Wang et al. (2021b) installed a remote, all-weather, high-precision Wind3D 6000 lidar at a bridge site in a U-shaped valley. After six months of continuous monitoring, statistical analysis of raw data at heights from 0 to 810 m was conducted to ensure data validity and account for wind speed factors. The study revealed significant spatiotemporal non-uniformity in wind speed and direction, as well as the correlation of wind parameter between different virtual wind towers. Based on the effective data at the bridge center, wind speed profiles were classified into three types: Type 1 showed disordered characteristics, Type 2 exhibited a linear relationship, and Type 3 displayed non-linear behavior. The wind direction was consistent with the main wind direction at the bridge site, with high consistency in the average wind direction among the virtual wind towers. The concept of wind direction deflection rate was introduced to describe changes in wind direction with height. These wind parameter, derived from measured data, provide important reference values for the wind-resistant design of bridges, offering more accurate wind field characteristics for engineering design.
Xu (2021) conducted a six-month wind characteristics observation in a valley using the Wind3D 6000 3D scanning lidar and four virtual wind towers evenly spaced along the bridge axis. Based on the measured data, the basic wind parameter in a mountainous area were analyzed from temporal and spatial perspectives. The study summarized the variation patterns and causes of basic wind parameter. The research showed that local wind profiles and parameter differed significantly from the code-recommended values. Statistical analysis of wind parameter at different locations in the valley revealed spatiotemporal differences along the valley's longitudinal and transverse directions, with significant seasonal variations. It is also shown that wind speed at bridge deck height was unevenly distributed along the span. This uneven distribution phenomenon persisted in far-field areas and at higher wind speeds but decreased with height.
Chen (2022b) conducted a six-month field measurement of the topography and climate environment of a Y-shaped deep-cut valley, using lidar, 2D anemom, and 3D anemom. The average and fluctuating wind characteristics were analyzed, revealing that the wind environment in the Y-shaped deep-cut valley was extremely complex. The guiding effect of the mountain on both sides caused the wind speed at the bridge midspan to be higher than on both sides, but as observation height increased, wind speed differences between different points decreased. The wind direction distribution in the Y-shaped deep-cut valley was uneven. The result is demonstrated in Fig. 41.
In the study of wind field characteristics in coastal areas, Gao et al. (2021b) selected measured wind field data from a coastal plain area in Zhongshan City, Guangdong Province, as the subject of analysis. They proposed a new three-dimensional joint distribution modeling method based on copula functions and angular-linear (AL) models. Wind speed was modeled using a generalized distribution model, with the Weibull distribution chosen as the probability distribution model for wind speed. By incorporating the Copula function to account for wind height, they successfully constructed a three-dimensional joint probability distribution model for wind speed, direction, and height. The study results showed that the Weibull distribution effectively described the probability distribution characteristics of wind speed in the area. The joint probability distribution of wind speed and direction based on the AL model fitted well with the measured data, and the newly established three-dimensional joint probability distribution model also demonstrated high fitting accuracy.
Qiu (2023) conducted wind field characteristic observations in both coastal areas and mountainous canyon regions, obtaining wind environment parameter from two different types of terrain. Considering seasonal factors, average wind characteristics, and fluctuating wind characteristics, representative periods were selected to calculate coherence functions. Wind accelerates as it passes through a canyon due to the influence of surrounding mountains, increasing the turbulence level of the wind field. Several three-dimensional models of canyons with different slopes were established, and numerical simulations were conducted. Wind accelerates near the mountains in the canyon, so for two measurement points at the same distance, the closer the point is to the mountain, the greater the index decay coefficient and its rate of increase. For canyons with different mountain slopes, the index decay coefficient in the valley was generally lower than that on the mountainside, and it increased continuously with the steepness of the mountain slope.
Hao et al. (2024) conducted a one-year wind characteristics measurement using the YOUNG 81000 three-dimensional ultrasonic anemometer in the coastal areas of Guangdong. They performed a statistical analysis of the average wind characteristics in the wind field at the bridge site and analyzed the fluctuating wind characteristics at the site based on the principle of strong winds, comparing them with the standards. The coastal area exhibited significant monsoon characteristics. The study explored the correlation between gust factors and turbulence intensity, recommending empirical formulas for use in coastal areas. Additionally, the study proposed empirical formulas for turbulence integral scale and turbulence intensity and recommended different power spectra for different wind directions.
2.1.2 Non-synoptic wind
Non-synoptic winds refer to relatively rare types of wind fields that can cause severe damage to human society and the ecological environment, such as typhoons, tornadoes, and downbursts. Hao and Wu (2020) simulated tornado-like wind-induced loads effect on bridge, in addition to considering the static component, a semi-empirical model with a two-dimensional indicator response function was used to simulate the motion effect. Based on a 3D finite element model, a nonlinear wind-induced static analysis and a linear aeroelastic time-domain analysis were conducted to assess bridge performance under the most unfavorable tornado conditions considering wind-structure interaction. The study highlighted the significant impact of tornado characteristics (i.e., uneven, concentrated vertical wind speeds and transient features) on long-span bridges, providing a more reasonable basis for wind design of flexible horizontal structures in tornado-prone areas. A non-stationary wind velocity model based on discrete wavelet transform (DWT) was used to extract the time-varying mean wind speed during typhoons. The mean and fluctuating wind characteristics obtained using stationary and non-stationary models were analyzed and compared, revealing certain differences in fluctuating wind characteristic parameter. These differences gradually decreased as the basic time interval decreased, emphasizing the significant non-stationary nature of typhoons.
Hao et al. (2022) used wavelet packet transform (WPT) and Hilbert Transform to extract the instantaneous information of non-stationary signals and simulated single-point non-stationary wind speed signals through inverse transformation. A spatial multi-scale correlation coefficient matrix was established based on the time-frequency coherence function. By performing Cholesky decomposition on the correlation coefficient matrix, the spatial correlation of the frequency carrier function was established, achieving multi-point non-stationary wind speed time history simulation. This method was applied to simulate the non-stationary wind field of an entire cable-stayed bridge over the sea.
Feng et al. (2023b) generated wind fields using the instantaneous information embedded in the Hilbert spectrum, which was derived from comprehensive measurements of downbursts and typhoons. The simulation of non-stationary wind fields is shown in Fig. 42. The simulation results were found to be in good agreement with the measurements. A time-domain buffeting analysis of a long-span bridge was conducted using a two-dimensional indicator response function, discussing the transient aerodynamic effects of downbursts and typhoons on the bridge. The results indicated that downbursts have significant transient characteristics and transient effects on the numerical response function, aeroelastic loads, and buffeting response, whereas the transient effects of typhoons on downbursts can be negligible.
The Wind Tunnel Laboratory of Chang'an University has addressed the lack of wind parameter determination methods for bridge sites in mountainous areas, mountain passes, river beaches, and coastal typhoon zones within the wind resistance code. They conducted field measurements in various complex terrains and compared the results with the code, finding significant deviations between the recommended values for wind field characteristics in the code and the measured values. This finding demonstrates the necessity of conducting wind field observations in complex terrains. The introduction of scanning Doppler wind lidar testing technology enabled detailed measurements, and a LIDAR-based algorithm for complex terrain was used for customized monitoring and inversion of bridge wind attack angles, turbulence, and shear parameter. This broke through the technical limitations of three-dimensional wind field observation for bridges, uncovering the distribution patterns of wind field characteristics in special regions such as karst landscapes, coastal typhoon zones, U-shaped valleys, and trumpet-shaped terrains. Through field measurements in various complex areas, the advantages of high accuracy, realism, and comprehensive wind characteristic parameter in field measurements were fully utilized. Effective methods were employed to obtain accurate wind loads for bridge structures, thereby ensuring wind resistance safety for bridges in strong wind zones with complex terrains.
2.2 Wind tunnel simulation
By conducting scaled terrain model wind tunnel experiments in atmospheric boundary layer wind tunnels, it is theoretically possible to obtain the distribution patterns of wind parameter at any location. This method serves as an alternative to actual wind parameter measurements, and this technology has become quite mature.
2.2.1 Terrain model test
Zhang (2011) used the CAWS1000-GWS wind energy observation system produced by Huayun Company of the China Meteorological Administration, one year of wind observation data was collected from two typical complex wind field areas in Xinjiang: the Alataw Pass wind area and the Irtysh River Valley wind area. It was recommended that wind speed profile exponents in different mountainous complex terrains should be fitted using actual measurements. The turbulence intensity in such terrain conditions was found to be lower than that in general strong wind conditions. By conducting terrain model wind tunnel experiments combined with wind observation data analysis, the study achieved ideal results for simulated wind speed profiles and turbulence intensity compared to measured values, validating the applicability of this experimental method for simulating wind fields in such terrains. Due to the mountain overflow and the varying degrees of obstruction from the front mountains, the wind speed profiles varied significantly under different wind directions, indicating that mountainous terrain wind speed profiles have directional characteristics, and the traditional power-law model cannot be directly applied.
Bai and Bai (2011) simulated bridge terrain through wind tunnel experiments, studying how wind characteristic parameter change with wind direction and how the surrounding environment influences wind characteristics. The results showed that due to the influence of surrounding terrain, wind profiles under specific wind directions did not follow the traditional exponential distribution. When the wind direction aligned with the canyon's orientation, the average wind profile exponent was smaller than for other wind directions, indicating that wind speed decreased more rapidly with height. Near the canyon slopes, turbulence intensity was relatively high, which could have a significant impact on bridge structures. The variation in turbulence integral scale was smaller than the variation in turbulence intensity, indicating that turbulence intensity is a more critical parameter when assessing wind loads. The power spectrum of fluctuating winds was significantly affected by the surrounding mountains, reducing the efficiency of wind energy transfer and significantly weakening the power spectrum. The study emphasized the heterogeneity and directional dependence of wind characteristics in complex terrains and how these factors affect bridge structure responses.
Gao et al. (2017) conducted the first comprehensive comparison of inland strong winds and typhoons, identifying the similarities and differences in wind parameter. By statistically analyzing the measured wind speed data, the study identified the distribution characteristics and patterns of wind field parameter in these typical regions. For the selected three typical regions, appropriate scaling ratios were chosen to create terrain models, and for the first time, high-efficiency pressure tap arrays were used in terrain wind tunnel experiments, as shown in Fig. 43. The study completed wind tunnel tests for multiple wind directions, multiple measurement points, and various wind fields, obtaining the distribution characteristics and patterns of the experimental wind fields and comparing them with measured results to identify the differences and patterns between wind tunnel tests and field measurements. Numerical simulations corresponding to the wind tunnel test conditions were conducted. The distribution patterns of wind speed profiles and turbulence intensity at various measurement points were obtained, and the calculated results were compared with wind tunnel test data, summarizing the variation patterns of wind speed and turbulence intensity along the height. By combining field measurements, wind tunnel tests, and numerical simulations, the study conducted a comparative analysis of inland strong wind characteristics, summarizing the limitations and applicability of the three research methods. The study pointed out that field measurement is fundamental in studying strong wind characteristics, with wind tunnel tests and numerical simulations serving as supplementary methods, considering their implementation difficulty and economic viability.
Zhang et al. (2016) conducted wind tunnel tests of canyon terrain at a bridge site using an actual bridge as the engineering background. Based on the test data, the study analyzed the average and fluctuating wind characteristics under different wind directions in complex canyon terrain. The wind field characteristics in mountainous canyon areas, influenced by compression, separation, or recirculation effects from surrounding mountains, showed significant differences from wind resistance codes. It was recommended that when designing wind resistance for bridges located in mountainous canyons, the turbulence intensity should consider the most unfavorable wind direction angle within a certain range along the valley direction at the bridge deck height.
Wang et al. (2020a) studied the parameter characteristics at the bridge site in a canyon area through terrain model wind tunnel tests, the terrain as shown in Fig. 44. The study analyzed the changes in average wind profiles, turbulence intensity, and fluctuating wind power spectra at the bridge site under different incoming wind directions in a certain canyon area. The results showed that under lateral inflow conditions, the wind profile at the mid-span measurement station followed an exponential pattern, but the wind profile at the bridge tower location was significantly influenced by the surrounding terrain and lacked a clear pattern. The spatial distribution of turbulence intensity in the entire mountainous wind field was not highly correlated, and the spatial distribution of turbulence intensity was significantly influenced by the terrain, especially near slopes where the turbulence intensity was higher. The variation in the fluctuating wind power spectrum needed to consider the influence of surrounding mountains, and the power spectrum at the bridge deck height in the direction along the valley was well matched with the Kaimal spectrum.
Song et al. (2020) analyzed two years of continuous data recorded by a Doppler acoustic radar observation system installed at the bridge site in a Y-shaped valley, finding that topographic effects had a significant impact on wind direction changes. To supplement full-scale measurements, a 1:1500 high-precision terrain model was used for wind tunnel testing. The study investigated the vertical distribution of velocity fields and turbulence fields at key points along the bridge alignment, as well as the lateral distribution along the bridge axis. The results from different test directions revealed the effects of incoming flow fields, particularly the shielding effect and channeling effect, which respectively led to wind deceleration and acceleration at the bridge location, with acceleration being more pronounced at the valley and mountain tops.
Shen et al. (2021) conducted an in-depth study of a trumpet-shaped mountain pass through terrain wind tunnel experiments, obtaining the lateral variation patterns of average and fluctuating wind characteristics at the bridge site. The study found that the lateral variation of wind field characteristics at the bridge site was significantly influenced by the inflow direction, and this variation could be accurately described by a quadratic polynomial. A buffeting response calculation theory was established, considering the variation of lateral average wind and fluctuating wind characteristics of the main girder. The study analyzed and discussed the impact of non-uniform wind characteristics on the buffeting response of the main girder, finding that non-uniform wind parameter had a significant impact on the buffeting response, especially non-uniform wind attack angles, which were key factors affecting the buffeting response. The study showed that using single-point wind field observation results alone to predict the buffeting response of mountainous bridges may not be sufficiently accurate, and more comprehensive wind field characteristics need to be considered.
Li et al. (2022a) conducted tests on two terrain models in a boundary layer wind tunnel to analyze the differences in wind characteristics between flat and mountainous areas. The study measured the vertical and horizontal distribution of average wind speed, turbulence intensity, and wind power spectrum. In flat terrain, the influence of wind direction on wind characteristics was minimal and could be ignored. However, assuming a homogeneous wind field in mountainous terrain was inappropriate, as the complexity of mountainous terrain led to significant changes in wind characteristics that needed to be considered in design. The study also proposed a method for defining non-homogeneous wind fields in wind tunnel experiments or field measurements. This method allows for more accurate simulation and prediction of actual wind field conditions. The study provided methods for using measured wind speed data to calculate turbulence intensity and wind power spectra, which are crucial for understanding the dynamic characteristics of wind fields. The study emphasized that when designing bridges in mountainous terrain, engineers must consider the heterogeneity and variability of wind characteristics. This means that wind characteristic parameter for flat terrain cannot simply be applied; instead, more refined analysis methods should be used to ensure the safety and reliability of bridge structures.
2.2.2 Turbulence grids test
One of the major challenges in wind tunnel testing is generating the desired turbulent wind field. Bai (2012) created three different sizes of square rigid pressure measurement models and placed them in four different localized turbulent wind fields as illustrated in Fig. 45. By comparing the variation in shape coefficients of the three model sizes with changes in turbulence intensity, it was found that the larger the model size, the greater the variation in shape coefficient caused by changes in turbulence intensity. Therefore, when conducting pressure measurement wind tunnel tests with large-scale models, the turbulence intensity of the flow field should be as consistent with the actual situation as possible; otherwise, it may introduce greater errors into the test results. Turbulence intensity affects the Gaussian characteristics of measurement points at different positions on the structure's surface, and the impact of turbulence intensity varies depending on the location of the measurement point. In some areas, it may cause the fluctuating wind pressure to not follow a Gaussian distribution, leading to errors if a Gaussian model is still used in calculations. The correlation between adjacent measurement points on a bridge structure is mainly influenced by characteristic turbulence. When the distance between measurement points exceeds the influence range of vortices generated by characteristic turbulence, the correlation coefficient is primarily affected by the turbulence integral scale of the incoming flow. The larger the turbulence integral scale, the smaller the speed and magnitude of correlation coefficient decay. The vortex scale changes on the lower surface of the bridge structure are much smaller than those on the upper surface. Bai et al. (2016b) used wind tunnel testing methods to study the effects of grid spacing and grid width on turbulence intensity, turbulence integral scale, and fluctuating wind power spectra at different sections in a wind tunnel by testing the parameter of localized turbulent wind fields generated by different forms of grids. The study results indicated that at a cross-section 3.5 m from the grid, a well-homogenized localized turbulent wind field could be formed; the turbulence intensity generated by the grid changed little with wind speed; narrower grids resulted in lower turbulence intensity and better data stability. And the turbulence integral scale was roughly equivalent to the grid spacing. Formulas were provided for estimating turbulence intensity and turbulence integral scale based on grid spacing and grid width, as shown in Tables 3 and 4, facilitating the tuning of localized turbulent wind fields.
![]() Figure 45. Grid turbulence arrangement. (a) Working condition 1. (b) Working condition 2. (c) Working condition 3. (d) Diagram of the grid.Table 3. Grid turbulence field of turbulent flow intensity estimation equation.
Figure 45. Grid turbulence arrangement. (a) Working condition 1. (b) Working condition 2. (c) Working condition 3. (d) Diagram of the grid.Table 3. Grid turbulence field of turbulent flow intensity estimation equation.W (cm) Turbulence intensity (%) Format Note 60 40 30 20 Table 4. Estimated equation for the turbulence integral scale of the grating turbulence field.W (cm) Turbulence length scale (m) Format Note 60 40 30 20 Bai et al. (2017) created localized turbulent wind fields with the same turbulence intensity but different integral scales and with the same integral scale but different turbulence intensities in a wind tunnel using grid turbulence. The results showed that an increase in turbulence intensity led to an increase in shape coefficient in the positive pressure region of the rectangular structure surface and a decrease in the absolute value of the shape coefficient in the negative pressure region. The wind pressure variation in the positive pressure region was independent of the structure's scale, while the shape coefficient in the negative pressure region was influenced by both the incoming flow turbulence intensity and a significant scale effect. An increase in turbulence integral scale led to an increase in the absolute value of the shape coefficient on the surface of the rectangular structure, but the magnitude of change in different regions lacked a consistent pattern, making uniform correction difficult.
Bai et al. (2019a) studied the effects of turbulence wind characteristic parameter, such as turbulence intensity and turbulence integral scale, on wind tunnel test results, analyzing the impact of these parameter on the fluctuating wind loads on the surface of square structures. To minimize interference factors, localized turbulence fields were created using grids. The results showed that the probability distribution curve for the bottom area of the square structure matched well with a Gaussian distribution, and as the incoming flow turbulence intensity increased, the deviation of the distribution curve from the Gaussian distribution also tended to increase. An increase in turbulence intensity led to an increase in the fluctuating wind pressure coefficient, and the upper region of the windward side of the square structure was highly sensitive to turbulence intensity. The influence of turbulence integral scale on the fluctuating wind pressure coefficient was minimal; however, as the integral scale of the incoming flow increased, the horizontal and vertical correlations improved.
The Chang'an University Wind Tunnel Laboratory innovated special terrain model wind tunnel testing methods, proposing a multi-spatial scale terrain model considering different scale ratios in horizontal and vertical directions and a simplified model for typical terrain and landforms. They established a non-uniform spatial wind field model that considers average wind speed, wind direction, wind attack angle, power spectral density, and coherence function models, and studied wind characteristic distribution issues at special locations such as valley corners, valley exits, and extreme wind zones, as well as the distribution patterns of parameter such as wind speed and wind direction angle along the main girder span. Through various terrain tests, they found that the wind speed profile in complex terrains exhibits directionality, and wind parameter for complex terrains should primarily be based on field measurements, with wind tunnel tests as a supplement. The research focused on how to generate the desired turbulent wind field in wind tunnel tests and the impact of turbulent wind fields on the surface wind pressure of structures. The study summarized the effects of grid spacing and grid width on turbulence intensity, turbulence integral scale, and fluctuating wind power spectra at different sections in a wind tunnel and provided formulas for estimating turbulence intensity and turbulence integral scale based on grid spacing and grid width. The study suggested that when conducting aeroelastic model tests of bridges, accurate simulation of turbulence intensity should be ensured first, and then accurate simulation of turbulence integral scale should be pursued when conditions allow.
2.3 CFD numerical simulation
Although numerical simulation has a relatively short development history, it has gradually become important in studying wind characteristic parameter as computers rapidly advance. From 2D to 3D, from simplified terrain to actual complex terrain, the efficiency, accuracy, and reliability of CFD have steadily improved. The computational domain can be set large enough to fully understand the wind field characteristics across the entire domain, effectively visualizing the flow characteristics and geometric features of the flow field, such as contour plots and streamline maps. However, numerical simulation is still considered a supplement to field measurements and wind tunnel tests.
2.3.1 Terrain model numerical simulation
Zhang (2009a) conducted wind observation practices in special terrains in the middle and upper reaches of the Yellow River, collecting wind speed data for a year and a half at the Yumenkou Yellow River Bridge using three wind observation towers installed at the bridge site. For the first time, the measured data were used to statistically obtain the distribution characteristics and patterns of the wind field at the real bridge site in the canyon mouth. CFD numerical simulation technology was first applied to simulate the wind field at the trumpet-shaped terrain where the canyon river channel transitions into a wide, shallow river channel. The GAMBIT software was used to create a 3D geometric model of the mountain and cable-stayed bridge at the bridge site. Based on "numerical wind tunnel" simulation technology, the realizable k-ε and SST k-ω turbulence models were used to simulate the wind field at the bridge site under seven conditions with and without the actual bridge structure. The simulation provided the distribution patterns of wind profiles, wind speed streamlines, pressure streamlines, and turbulence at the bridge site and its surroundings. A multi-dimensional comparison of wind characteristics at the bridge site in the canyon mouth was conducted for the first time using a combination of field measurements and numerical simulations. The results indicated that the realizable k-ε model provided more ideal simulation results for complex terrain wind fields. The study summarized the variation patterns of wind characteristics near the bridge site and the wind field flow around the bridge site, analyzed the impact of the actual bridge structure on the wind field, and provided recommendations for the turbulence integral scale and wind profile model during strong wind periods at the canyon mouth.
The terrain models were generated using GAMBIT by Sun (2012), and the wind speed profiles and turbulence intensity of the three typical wind areas were simulated using the realizable k-ε turbulence model. The results were compared with wind tunnel test results, revealing that the wind speed profiles for the same terrain varied under different wind directions, with wind speed profiles changing along with the wind speed direction. The turbulence intensity obtained from numerical simulations exhibited strong directionality, with significant variation along the wind speed direction due to mountain obstruction. The study investigated the scale effect of wind parameter through numerical simulations of different scaling ratios, finding that within a certain range, as the model scale decreased, the wind speed decreased, and turbulence intensity tended to increase. Single changes in lateral scale had little impact on flat terrain but a relatively large impact on complex terrain.
Song (2021) conducted a wind characteristic study on the Y-shaped confluence valley bridge site in a mountainous area. A circular area with a diameter of 4.5 km was selected, and a model with a geometric scale ratio of 1:1500 was designed based on contour data and subjected to wind tunnel testing. The study discussed the distribution characteristics of mean wind profiles, acceleration effects, wind attack angles, turbulence intensity, and power spectral density at the confluence valley center, valley bottom, slopes, and mountain tops. The wind field characteristics were further discussed based on measured results and compared with wind tunnel test results. The study proposed a method for implementing numerical simulations of complex terrain wind fields. The feasibility of this method was validated through comparison with wind tunnel test results, and the appropriate turbulence model was selected. The V-shaped valley cross-section was simplified as a sine function, and the standard k-ω turbulence model was used to simulate the wind field characteristics of the simplified valley. The study examined changes in wind field characteristics by altering terrain slope, the angle between incoming flow and the valley, and valley bends, and established a mathematical model. The illustration of the research is shown in Fig. 46.
Li et al. (2022d) considered initial conditions such as surface roughness, inlet wind speed, wind speed profile, and oncoming wind direction, and analyzed wind speed, wind attack angle, and wind azimuth as the main wind parameter. The study conducted an in-depth analysis of the wind characteristics of U-shaped valleys, establishing a new quantitative model to study wind parameter. The model linked sensitive factor coefficients with scale values. For the first time, the AHP was used to evaluate the impact of initial conditions on wind parameter. The study results indicated that the spatial distribution of wind field characteristics in U-shaped valleys was highly complex and significantly influenced by initial conditions. The established quantitative model showed good practicality, providing valuable references for bridge design. The AHP evaluation results showed that the oncoming wind direction had the most significant impact on wind parameter.
Song et al. (2022) studied airflow in anomalous convergence channel terrains, including upstream deep valleys and downstream flat plains. The standard k-ε model was used for CFD simulations to study the impact of important approach wind directions on wind field structure. Long-term field measurements provided measured data from acoustic radar systems and 2D ultrasonic anemom. The observed results were generally consistent with the numerical simulation results. The study revealed that wind acceleration occurred at the valley and its exit, with wind speed and wind direction being sensitive within a height range of 200 m, and the terrain significantly influencing wind direction. Due to the impact of complex terrain, the wind speed and wind direction along the entire bridge structure (including the bridge deck and towers) were uneven. Moreover, as shown in Fig. 47, comparing the wind speed at the bridge site showed that the wind speed recommended by Chinese national standards for the two most unfavorable directions perpendicular to the bridge axis was lower than the wind speed from numerical simulations.
![]() Figure 47. Wind characteristics along the bridge axis. (a) Wind vectors for 315° approach flow. (b) Wind vectors for 135° approach flow.
Figure 47. Wind characteristics along the bridge axis. (a) Wind vectors for 315° approach flow. (b) Wind vectors for 135° approach flow.2.3.2 CFD simulation of non-synoptic wind
Hao and Wu (2018) used a computational fluid dynamics method based on impinging jets to simulate the time history of a non-turbulent downburst wind field. With reasonable computational costs, the high-fidelity simulation of the downburst wind field was demonstrated, especially for the near-ground radial winds, which are particularly important in current bridge aerodynamics and aeroelasticity studies. The simulated typical downburst time-varying mean wind speed field was validated against measured data. The Hilbert wavelet method was used to simulate the relevant non-stationary fluctuations of the downburst, and these fluctuations were superimposed onto the transient mean wind field based on numerical simulations.
Feng et al. (2022) used a CFD-based numerical Ward-type tornado simulator to simulate tornado-like wind fields as shown in Fig. 48. To optimize the inflow angle and translation speed parameter of the numerical Ward-type tornado simulator, an optimization strategy was proposed. To facilitate the optimization process, a multi-fidelity surrogate model was used to effectively integrate low-fidelity and high-fidelity data for accurate and efficient simulation. Specifically, the cokriging model was constructed using data from the low-cost Reynolds-averaged Navier-Stokes (RANS) equations and high-cost large-eddy simulation (LES) techniques. The "optimal" parameter based on the multi-fidelity surrogate model were input into the numerical Ward-type tornado simulator (using LES technology), and the resulting wind field matched well with field measurement results.
Feng et al. (2023a) conducted full-bridge non-stationary wind field simulations based on the Hilbert spectrum, embedding wind field spatial coherence into the simulation through Cholesky decomposition, and introducing a 2D step response function to establish a non-stationary wind-induced bridge buffeting response analysis method considering transient effects. A non-stationary buffeting response analysis was conducted on a long-span suspension bridge, exploring the impact of transient effects of non-stationary wind fields on bridge aerodynamics and buffeting response.
Feng et al. (2023b) used a CFD-based impinging jet model to simulate the time-varying mean wind of downbursts. To ensure that the simulation results matched the measurement results well, a parameter optimization method was proposed. The objective function was established based on the error between the simulation characteristic points obtained from the measurement data and the target values. During the optimization iteration process, the surrogate model was used in place of the numerical model, significantly improving optimization efficiency. The parameter-optimized downburst numerical simulation significantly improved simulation accuracy. By combining Hilbert-based non-stationary fluctuations with CFD-based time-varying trends, a non-stationary turbulent downburst wind field was obtained.
Feng et al. (2023a) conducted steady-state downburst numerical simulations using the impinging jet model and introduced grid sliding technology to simulate the movement effect of descending airflows, studying the wind field evolution during downburst movement. A downburst simulation parameter optimization method targeting measured data was proposed, abstracting the target wind speed time history into several characteristic points and establishing an objective function based on the error between the simulation characteristic points and target values. A surrogate model was introduced into the parameter optimization process for downburst simulation to improve computational efficiency, and the surrogate model was trained using numerical model-calculated design sample point responses. The accuracy of the Kriging model surrogate and the feasibility of the parameter optimization method were verified through five sets of test cases. The study results indicated that the relative values of descending airflow nozzle speed, nozzle movement speed, and ambient wind speed were key factors affecting the time-varying characteristics of the mean wind speed time history of the downburst. The downburst numerical simulation based on optimal parameter significantly improved simulation accuracy.
2.3.3 CFD simulation of turbulent wind field
Wang et al. (2020c) effectively extracted the main flow modes from complex flow field data using appropriate proper orthogonal decomposition (POD) and dynamic mode decomposition (DMD) methods and analyzed and compared the changes in the main modes of the flow field and the differences in their time series under different spacing ratios. This approach helped separate mixed information in the flow field to identify dominant modes, which clearly reflected the dominant flow characteristics of the flow field. The study revealed the flow characteristics under different spacing ratios.
Wang (2022b) analyzed the characteristics of Couette flow and Poiseuille flow based on the Navier-Stokes equations and found that the wind speed distribution mechanism in canyons could be explained from the perspectives of pressure gradient, wall friction, and canyon characteristic size. By making assumptions, a practical model describing the 3D distribution of wind speed in U-shaped canyons was derived, providing a simplified polyline envelope function for the lateral wind speed distribution. The reliability of this function was demonstrated by combining it with terrain test results.
Song et al. (2023) verified the effectiveness of the pressure-driven RANS approach in numerical simulations by comparing the estimated wind flow characteristics at the Y-shaped valley bridge site with wind tunnel test results. Based on this, the study examined the impact of terrain on the wind field and obtained the spatial distribution patterns of wind parameter along the bridge structure. The results indicated that there were significant differences in the wind speed, wind direction, and pitch angle distributions in the leeward zone among the three Reynolds-averaged N-S turbulence models, k-ε, k-ω, and SST, with the k-ε model's predictions showing an error within 20% compared to experimental results. The simulation results indicated that non-uniform wind characteristics frequently occurred on the bridge structure, including significant rotation of wind speed along the bridge tower height and cross-directional non-uniformity of mean wind speed and main girder pitch angle. This finding highlighted the need for corrected terrain coefficients when safely predicting wind speed. A discussion of several national bridge design codes revealed that most of these codes do not adequately reflect wind loads at mountainous bridge sites.
Xie et al. (2024) established a 2D geometric model near the coast using CFD numerical simulation technology, simulating the distribution characteristics of wind parameter on calm water surfaces using the SST k-ω turbulence model and multiphase flow model. The study analyzed the effects of development distance, water depth, incoming wind speed, and slope changes of the underwater terrain on the distribution characteristics of wind parameter. The study found that within a development distance of 60 m, wind speed near the water surface exceeded the inlet wind speed, exhibiting an acceleration phenomenon. Increased water depth led to a nonlinear increase in gradient wind height, significantly affecting wind speed. The size of the inlet wind speed had no impact on gradient wind height or wind structure but did affect the acceleration effect near the inlet.
The Wind Tunnel Laboratory of Chang'an University conducted numerical simulations of benign winds over various complex terrains using different turbulence models, comparing the results with measured data to verify the accuracy of different turbulence models in complex terrain numerical simulations. Numerical simulation technology was used to simulate extreme wind fields such as downbursts and tornadoes, with measured data for validation, and surrogate models were employed for optimization, significantly improving model accuracy. The main findings and conclusions are as follows:
A methodological approach suitable for numerical simulation of wind field characteristics in complex terrains was proposed. This approach improved the consistency between numerical simulations, measured results, and wind tunnel test results, enhancing the accuracy and speed of wind field numerical simulations. An innovative method combining field measurements, numerical simulations, and wind tunnel tests to determine wind parameter at bridge sites in special regions was proposed.
Numerical simulations summarized the variation patterns of wind characteristics near the bridge site and the wind field flow around the bridge site, analyzing the impact of the actual bridge structure on the wind field. Recommendations were provided for turbulence integral scale and wind profile models during strong wind periods at canyon mouths.
3. Bridge aerostatics
3.1 Aerostatic force coefficients of typical cross-sections
The aerostatic three-force coefficients profoundly reflect the unique relationship between the three components of static wind load (lift, drag, and moment) and sectional characteristics when the structure is subjected to incoming wind. It is a fundamental parameter describing the wind's effect on the section, and the static structural behavior it represents is the foundation for studying aerodynamic problems and structural optimization.
As shown in Fig. 49, when the static wind load is expressed in three directions through wind axes, it is generally represented by the drag coefficient (CD(α)), lift coefficient (CL(α)), and moment coefficient (CM(α)). The coefficients of forces in the three directions of the body axes can be transformed into the coefficients of forces in the three directions of the wind axes, and their transformation relationship is determined by Eqs. (1) and (2).
(1) (2) where CH(α) is the transverse force coefficient of the main girder, CV(α) is the vertical force coefficient of the main girder, CD(α) is the drag coefficient along the wind axis of the main girder, CL(α) is the lift coefficient along the wind axis of the main girder, B is the characteristic width of the main girder, D is the characteristic height of the main girder, and α is the effective wind attack angle, which is the sum of the initial wind attack angle and the structural torsion angle caused by static wind. The static aerodynamic coefficients of the main girder should be selected as the most unfavorable value within the range of −3° to +3° wind attack angle.
3.1.1 Reynolds number effects on force coefficient
For incompressible fluids, inertia force and viscous force are the two most important parameter affecting their flow patterns. The relationship between them determines the possible type of flow characteristics or phenomena, which is governed by a composite parameter named the Reynolds number (Re). It reflects the ratio of inertial forces to viscous forces in a fluid, and its definition is as follows.
(3) where U is the incoming wind speed, D is the characteristic dimension, generally taken as the beam height of the bridge section, μ is the dynamic viscosity of the fluid, and ρ is the fluid density, ν the dynamic viscosity coefficient of the fluid.
As bridge designs become more streamlined and structural analysis more refined, the importance of the Reynolds number effect in wind-resistant studies has gradually become prominent, necessitating a positive response to the Reynolds number effect. Existing research on the Reynolds number effect is often limited to analyzing single aerodynamic parameter, and comprehensive studies on how these effects collectively influence wind-induced vibrations of bridges are still insufficient. Moreover, almost all aspects of wind-resistant design are related to the three-force coefficients, and the wind-resistant design involving these coefficients is influenced by the Reynolds number effect. Therefore, an in-depth study of the Reynolds number effect on the three-force coefficients is of great theoretical and practical significance for bridge wind resistance design. Over the past twenty years, the Chang'an University Wind Tunnel Laboratory has made the following major advances in this study.
In the basic research on the Reynolds number effect of the three-force coefficients, Zhang (2009b) and Li and Zhou (2009) took the Sutong Bridge as the engineering background, conducting wind tunnel tests at high and low Reynolds numbers to explore the impact of the Reynolds number effect on the three-force coefficients on the static wind stability and buffeting response of bridge structures. The wind tunnel test results showed that under high Reynolds numbers, the lift and lift moment coefficients are more sensitive to changes in the attack angle (Fig. 50), which may reduce the critical wind speed for static wind instability (Fig. 51). Further analysis revealed that when calculating the buffeting response of a bridge, the RMS values of vertical displacement and torsional angle of the main girder, the displacement along the bridge direction at the top of the bridge tower, and the bending moment at the tower base are all biased towards danger. Therefore, ignoring the Reynolds number effect may lead to conservative wind-resistant designs (Fig. 52).
![]() Figure 50. The curves of three component force coefficients vs∙incidence angle with different Reynolds numbers. (a) Lift coefficient curve. (b) Lift torque coefficient curve.
Figure 50. The curves of three component force coefficients vs∙incidence angle with different Reynolds numbers. (a) Lift coefficient curve. (b) Lift torque coefficient curve.![]() Figure 51. The curves lateral displacement, vertical displacement and rotation angle vs. wind speed at mid-span section. (a) The curves lateral displacement vs. wind speed at mid-span section. (b) The curves vertical displacement vs. wind speed at mid-span section. (c) The curves rotation angle vs. wind speed at mid-span section.
Figure 51. The curves lateral displacement, vertical displacement and rotation angle vs. wind speed at mid-span section. (a) The curves lateral displacement vs. wind speed at mid-span section. (b) The curves vertical displacement vs. wind speed at mid-span section. (c) The curves rotation angle vs. wind speed at mid-span section.![]() Figure 52. Comparison of RMS values of bridge buffeting response. (a) Vertical displacement of the beam. (b) Rotation displacement of the beam. (c) Displacement at the top of bridge tower with wind speed.
Figure 52. Comparison of RMS values of bridge buffeting response. (a) Vertical displacement of the beam. (b) Rotation displacement of the beam. (c) Displacement at the top of bridge tower with wind speed.The Reynolds number effect influences the accuracy of the three-force coefficients, and in low-speed wind tunnel tests, it is difficult to meet the Reynolds number similarity condition, resulting in the presence of the Reynolds number effect between test values and real bridge values. It is important to conduct studies to suppress the Reynolds number effect on the three-force coefficients. In the research on controlling the Reynolds number effect, Li and Zhou (2009b) measured the three-force coefficients of streamlined sections with different surface roughness at different Reynolds numbers by attaching sandpaper of different particle sizes to the model surface to change the model's surface roughness. The measurement results showed that streamlined sections also have a significant Reynolds number effect within a narrow Reynolds number range; increasing surface roughness has a certain inhibitory effect on the Reynolds number effect of the three-force coefficients (Fig. 53), thus providing a method to control the Reynolds number effect. Bai et al. (2010b), based on experimental results, fitted the variation patterns of drag coefficient, surface pressure coefficient, wind pressure power spectrum, and Strouhal number of streamlined sections with Reynolds numbers. At the same time, the experiment also concluded that streamlined sections exhibit a significant Reynolds number effect, and increasing roughness has an inhibitory effect on the Reynolds number effect.
![]() Figure 53. Influence of roughness on Reynolds number effect of three-component force coefficient. (a) Influence of roughness on Re effect of CD. (b) Influence of roughness on Re effect of CL. (c) Influence of roughness on Re effect of CM.
Figure 53. Influence of roughness on Reynolds number effect of three-component force coefficient. (a) Influence of roughness on Re effect of CD. (b) Influence of roughness on Re effect of CL. (c) Influence of roughness on Re effect of CM.The Reynolds number effect is very sensitive to the section shape, and with the increasing size of modern bridges and the refinement of structural analysis, the study of the Reynolds number effect on different sections is particularly important. In the numerical simulation study of the Reynolds number effect, Li et al. (2010a) conducted numerical simulations of the variation of the three-force coefficients with Reynolds numbers for streamlined sections and π-shaped sections using standard models, Reynolds stress equation models, and Spalart-Allmaras models, based on existing wind tunnel test results. The comparison revealed significant differences in the Reynolds number effect between different sections.
Due to the size limitations of wind tunnel laboratories, blockage effects greatly influence test results, which usually need correction. In the study of wind tunnel blockage effects, Lu et al. (2014) studied the effect of high Reynolds numbers on the three-force coefficients of streamlined sections under natural wind and the characteristics of surface pressure distribution, comparing natural wind field data with wind tunnel test data. They pointed out that blockage and wall effects would significantly impact the Reynolds number effect of large-scale models. Subsequently, Zhang et al. (2015) proposed a correction method for wind tunnel test data regarding the impact of blockage effects on the surface pressure coefficients of sections.
3.1.2 Bridge appendages effects on force coefficient
Bridge appendages mainly refer to various structural elements designed to ensure pedestrian and vehicle safety, meet daily maintenance needs, and improve the aerodynamic performance of bridges. These appendages include, but are not limited to, wind noses, stabilizing plates, guide vanes, slots, and maintenance tracks. As bridge spans increase, the wind-induced response challenges faced by bridge structures also become increasingly severe, making it particularly important to study the impact of appendages on the aerodynamic stability and structural response of bridges. Appendages directly affect the three-force coefficients of bridges by altering the flow characteristics of airflow, thereby impacting the wind resistance performance of the bridge. Therefore, studying the impact of appendages on the three-force coefficients has become an important part of bridge wind resistance design, crucial for ensuring the safety, stability, and economy of bridges in changing wind environments. Over the past twenty years, the Chang'an University Wind Tunnel Laboratory has made the following major advances in this study.
In terms of the impact of wind barriers on the three-force coefficients, Gao et al. (2012) used a separated double-box girder as the research object, studying the impact of changes in wind barrier position, central slot opening ratio, railing porosity, maintenance vehicle track position, and vehicles on the three-force coefficients of the main girder through sectional model wind tunnel tests. The results showed that the impact of appendages on the three-force coefficients of the main girder cannot be ignored, with the impact of wind barriers on the drag coefficient being the most significant. The drag coefficient of the main girder under large wind attack angles in the erected state with wind barriers will increase significantly.
Regarding the impact of maintenance vehicle tracks on the three-force coefficients, Xing (2012) studied the impact of maintenance vehicle tracks on the three-force coefficients under different Reynolds numbers and wind attack angles. The study found that maintenance vehicle tracks intensified the Reynolds number effect of drag and moment coefficients but weakened the Reynolds number effect of the lift coefficient. Bai et al. (2019b) studied the impact of maintenance vehicle track appendages on the Reynolds number effect of near-streamlined bridge sections through large-scale model pressure and force tests. The results showed that maintenance vehicle tracks would increase the Reynolds number effect of the drag coefficient at 0° attack angle for near-streamlined bridge sections while inhibiting the Reynolds number effect of drag coefficients at other attack angles.
In terms of the impact of bridge railing on the three-force coefficients, Xing (2012) analyzed the impact of railings on the three-force coefficients under different Reynolds numbers and wind attack angles, finding that the arrangement of railings significantly enhanced the Reynolds number effect of the lift coefficient but had little effect on the moment coefficient. Bai et al. (2019b) studied the impact of railings on the Reynolds number effect of near-streamlined bridge sections in large-scale tests, and the results showed that railing placement had little effect on the Reynolds number effect of the drag coefficient, only changing the magnitude of the drag coefficient (Fig. 54).
![]() Figure 54. The effect of the maintenance track and railing on the Reynolds number effect of the drag coefficient at 0° wind attack angle. (a) The effect of the maintenance track on the Reynolds number effect of the drag coefficient at 0° wind attack angle. (b) The effect of railing on the Reynolds number effect of the drag coefficient at 0° wind attack angle.
Figure 54. The effect of the maintenance track and railing on the Reynolds number effect of the drag coefficient at 0° wind attack angle. (a) The effect of the maintenance track on the Reynolds number effect of the drag coefficient at 0° wind attack angle. (b) The effect of railing on the Reynolds number effect of the drag coefficient at 0° wind attack angle.Regarding the impact of pedestrian density on the three-force coefficients of footbridges, Li et al. (2023b) took a large-span pedestrian suspension bridge as an example and designed a segmental model of the human-bridge system with different static uniform pedestrian densities (μ) according to the pedestrian traffic level of the German Pedestrian Bridge Design Guide (EN03-08) (Fig. 55). Through segmental model wind tunnel tests, the study investigated the impact of ρ on the three-force coefficients and aerodynamic derivatives of large-span pedestrian suspension bridges. The research found that as the number of pedestrians increased, the drag coefficient and moment coefficient gradually increased, while the lift coefficient gradually decreased (Fig. 56). Pedestrian density significantly affected both direct and indirect aerodynamic derivatives. After changing the aerodynamic parameter of the main girder, a static uniform pedestrian distribution significantly affected the lateral and torsional buffeting response of large-span pedestrian suspension bridges, but it had little effect on the vertical buffeting response (Fig. 57).
![]() Figure 55. Section models of force-measured test with different μ. (a) 0 P/m2. (b) 0.5 P/m2. (c) 1.5 P/m2.
Figure 55. Section models of force-measured test with different μ. (a) 0 P/m2. (b) 0.5 P/m2. (c) 1.5 P/m2.![]() Figure 56. Aerostatic force coefficients with different μ in body axes. (a) CH. (b) CV. (c) CM.
Figure 56. Aerostatic force coefficients with different μ in body axes. (a) CH. (b) CV. (c) CM.![]() Figure 57. Effect of different μ on the buffeting response. (a) Vertical displacement. (b) Lateral displacement. (c) Rotation displacement.
Figure 57. Effect of different μ on the buffeting response. (a) Vertical displacement. (b) Lateral displacement. (c) Rotation displacement.3.1.3 Application of force coefficients
The trend of the three-force coefficient curve is directly related to the magnitude of static wind loads; the flatter the three-force coefficient curve, the less the structure is affected by wind loads. The study found that the three-force coefficients are closely related to torsional divergence and lateral instability in static wind problems of bridge structures, and to galloping, vortex-induced-vibration, and buffeting in dynamic problems. Over the past twenty years, the Chang'an University Wind Tunnel Laboratory has made the following major advances in this study:
In terms of evaluating static wind stability and buffeting response, Bai et al. (2022b) explored the impact of segmental model aspect ratio on the three-force coefficients of bridge sections through a combination of wind tunnel tests and numerical simulations (CFD). The study found that to ensure the accuracy and stability of test data, the aspect ratio of the segmental model should be at least 3, and for streamlined box girder sections, this value could be relaxed to 2. When the aspect ratio is lower than the recommended value, the test results for static wind stability and buffeting response tend to be more dangerous, with the deviation increasing as the aspect ratio decreases.
In terms of evaluating the flutter stability of bridge sections, Gao (2012) and Fang (2015) conducted sectional model wind tunnel tests on four typical bridge sections, including closed steel box girder sections, slotted box girder sections, truss girder sections, and pedestrian suspension bridge sections. They established the relationship between the three-force coefficients and flutter stability and proposed the flutter stability parameter F. Bai et al. (2014) provided a simplified expression for the damping ratio of the coupled torsional motion system affecting bridge flutter stability through theoretical analysis. The research showed that the F parameter could be used as an indicator of flutter stability for bridge sections. In different operating conditions for the same main girder section type and between different main girder section types, the greater the product of the lift coefficient and the lift moment coefficient to the wind attack angle derivative, the worse the flutter stability. When the flutter derivative is negative, it helps reduce aerodynamic negative damping, stabilizing the structure. Meanwhile, in predicting the critical flutter wind speed of bridges, Li et al. (2022b) investigates a way to quickly predict the flutter critical wind speed (FCWS) of bridge decks. Taking the streamlined box girder as the research object and through wind tunnel tests, by combining the ANNs and the CFD software, a procedure for quickly evaluating the flutter stability of streamlined box girders was proposed, as shown in Fig. 58. Moreover, to check the prediction accuracy, the wind tunnel tests corresponding to the bridge deck schemes were performed. By comparing the prediction and test results, it is found that: (1) the proposed procedure shown in Fig. 59 can reasonably select the streamlined box girder schemes with good aerodynamic performance for further wind tunnel tests, thus avoiding unnecessary tests and improving work efficiency; (2) by combining with ANNs, aerostatic force coefficients can be used to evaluate the aerodynamic performance of streamlined box girders.
![]() Figure 58. Commonly used ANNs in the field of wind engineering. (a) RBF neural network. (b) BP neural network.
Figure 58. Commonly used ANNs in the field of wind engineering. (a) RBF neural network. (b) BP neural network.![]() Figure 59. A procedure for fast evaluating the flutter stability of streamlined box girders.
Figure 59. A procedure for fast evaluating the flutter stability of streamlined box girders.3.2 Aerostatic force calculation for different bridge components
The nonlinear static wind stability of large-span bridge structures is mainly associated with the geometric nonlinearity caused by large displacements in the structure. The coupling between the static wind load and the structural deformation response results in the nonlinear variation of the static wind load. Static wind load, as a function of the effective wind attack angle, can be obtained through iterative calculations of the three-force coefficients as the wind attack angle changes, thereby determining the nonlinear variation of the static wind load. The wind resistance design code for highway bridges provides the following formula for calculating the static wind load on corresponding components of bridge structures.
3.2.1 Aerostatic force on the deck
The static wind loads applied to the deck are expressed as followings.
(4) (5) (6) where FH, FV, and MT are the drag force, lift force, and pitching moment applied to the main beam per unit length, respectively, ρ is the air density (typically taken as 1.25 kg/m3), Ug is the equivalent static gust wind speed at the reference height, CH(α) is the transverse force coefficient of the deck, CV(α) and CM(α) are the lift force coefficient and the pitching moment coefficient of the deck, respectively; H and B are the characteristic height and the projection width of the deck, respectively.
Li et al. (2021a) established the section model of the pedestrian suspension bridge, and the pedestrian models were installed on the sectional model to be the sectional models of the human-footbridge system with the four pedestrian densities and four pedestrian permutations including staggered walking, walking side-by-side, walking in line, and random walking. The force measurement tests were performed to obtain the aerostatic forces acting on the sectional models of the human-footbridge system.
3.2.2 Aerostatic force on bridge tower
Davenport (1961) first proposed the gust loading factor (GLF) method for calculating the equivalent static wind load, as shown in Eq. (7).
(7) where P(z) is the equivalent static wind load,
is the mean wind load, and G(z) is the gust loading factor, which can be defined as following. (8) where Y(z) is the peak (displacement, internal force, stress) response, and
is the mean (e.g., displacement, internal force, stress) response. (9) (10) where
is the root mean square (RMS) of the response, T is the duration (generally taken as 600 s), γ is the exceedance probability, and g is the peak factor, generally taken as 2.5 to 3.0. The expression for the gust loading factor G(z) is as following.
(11) The wind load on the bridge tower can also be calculated according to the code using Eq. (12).
(12) where
is the wind load per unit length of the tower, CD, t(α) is the drag coefficient of the tower, and An is the projected area in the downwind direction per unit length of the tower. In bridge engineering, it is crucial to accurately obtain the wind load characteristics for bridge towers with complex cross-sectional shapes. This is typically achieved through wind tunnel tests or virtual wind tunnel simulation methods, and the most unfavorable values within the ±30° wind yaw angle range near the transverse or longitudinal direction of the bridge should be used. The wind load on the bridge tower can be determined based on the wind speed at 0.65 times the pier height or tower height above the ground or water surface.
Li et al. (2024) conducted aeroelastic model wind tunnel tests on an ultra-high bridge tower in a real project. Based on this, nonlinear time-history calculations of wind-induced vibrations of the ultra-high bridge tower were performed using a three-dimensional model of the bridge tower established with ANSYS finite element software (Figs. 60 and 61). Using the GLF method, they compared the equivalent static wind loads of the ultra-high bridge tower with displacement, internal force, and stress as single targets in Fig. 62, where DB is displacement-based, FB is the internal forced-based, and SB is the stress-based. The results showed that the wind-induced vibrations of the bridge tower under oblique wind were significant, with the impact becoming more pronounced as wind speed increased, proving that the selection of the most unfavorable value within the ±30° wind yaw angle range in the code is reasonable. The research further indicated that when the wind yaw angle is between 75° and 90°, the ultra-high bridge tower may experience longitudinal bending vortex shedding at wind speeds between 35 and 50 m/s, but with small amplitudes. Compared to gust loading factors based on displacement or internal force, the gust loading factor based on stress was more stable, making the equivalent static wind load based on stress more suitable for ultra-high bridge towers.
![]() Figure 62. Calculation for equivalent aerostatic load. (a) Longitudinal direction−0°. (b) Longitudinal direction−45°. (c) Longitudinal direction−90°. (d) Transverse direction−0°. (e) Transverse direction−45°. (f) Transverse direction−90°.
Figure 62. Calculation for equivalent aerostatic load. (a) Longitudinal direction−0°. (b) Longitudinal direction−45°. (c) Longitudinal direction−90°. (d) Transverse direction−0°. (e) Transverse direction−45°. (f) Transverse direction−90°.3.2.3 Aerostatic force on cables and suspenders
The equivalent static gust load on stay cables and main cables under crosswind can be calculated according to Eq. (12) but considering that the parameter are for the unit length of the cables and suspenders, which is calculated based on the outer diameter for stay cables and main cables. The horizontal wind load Fg per unit length of stay cables under longitudinal wind can be calculated according to Eq. (13).
(13) where DC is the outer diameter of the stay cable, and αc is the inclination angle of the stay cable.
For longitudinal wind, the horizontal wind load Fg per unit length on the main cables of a suspension bridge can be taken as 0.15 times its crosswind load, and if necessary, can also be determined through wind tunnel tests or virtual wind tunnel simulations.
When the center-to-center distance of the main cables of a suspension bridge is four times the diameter or more, the wind load on each cable should be considered independently, and the drag coefficient for a single main cable can be taken as 0.7. When the center-to-center distance is less than four times the diameter, it can be calculated as a single main cable, with the drag coefficient recommended to be 1.0. For suspension bridge hangers (rods) with a center distance of four times the diameter or more, the drag coefficient for each hanger can be taken as 1.0.
Wei (2023) studied the wind-induced vibration characteristics of H-shaped hangers with blunt section profiles using wind tunnel tests and numerical calculations. The wind tunnel test results indicated that the lift coefficient varied most significantly with the attack angle, the drag coefficient increased with changes in wind yaw angle, and the lift moment coefficient changed little with the attack angle (Fig. 63). The numerically calculated three-force coefficients exhibited the same variation trends as those obtained from wind tunnel tests, but the numerical values were relatively lower. Using the measured three-force coefficients, the galloping force coefficients were calculated, and the range of attack angles prone to crosswind galloping was analyzed. The different wind attack angle under the flutter force coefficients is shown in Fig. 64.
3.3 Aerostatic stability of long-span bridges
Static wind stability of long-span bridges refers to the stability of large-span bridges under the action of mean wind. Due to the relatively long span and relatively low stiffness of long-span bridge structures, they are prone to phenomena such as vibration and swaying. Without good static wind stability, these structures may experience lateral buckling and torsional instability under static wind loads when critical wind speeds are reached, potentially leading to structural damage or catastrophic failure. Such failures occur without any warning and can be extremely destructive. Therefore, to ensure the safe operation of long-span bridges, it is essential to fully consider and design for static wind stability, ensuring that these bridges remain stable and secure throughout their service life. This involves the calculation of static wind loads, structural design, and wind resistance performance analysis.
Considering the influence of geometric and nonlinear static wind loads on bridge structures, the nonlinear finite element analysis of long-span bridges under static wind loads can be summarized as solving the following nonlinear equilibrium equation.
(14) where [K(δ)] is the overall tangent stiffness matrix of the long-span bridge, and [F(α, v)] is the equivalent nodal force vector corresponding to the wind speed v and the effective angle of attack α. The UL (updated Lagrangian) incremental method is used to solve Eq. (14), and the corresponding nonlinear incremental equilibrium equations are as follows.
(15) where [K0] is the linear elastic stiffness matrix of the long-span bridge, [
] is the geometric stiffness matrix of the element in the j−1 step, [Fj(αj, νi)] is the equivalent nodal force vector of the wind load at the effective angle of attack αj in the j step for the i th wind load level, and [Fj−1(αj−1, vi−1)] is the equivalent nodal force vector of the wind load at the effective angle of attack αj in the j−1 step for the ith wind load level. Examining Eq. (15), it is evident that both the structural stiffness and the static wind load are functions of structural deformation. To solve this nonlinear equation, a method combining incremental and inner-outer double iteration is employed, taking into account both geometric nonlinearity and static wind load nonlinearity. During the process of increasing the wind speed proportionally, the inner iteration completes the nonlinear calculation of the structure, while the outer iteration finds the equilibrium position of the structure under a certain wind speed.
Using ANSYS finite element software, the calculation is performed by combining incremental and inner-outer double iteration methods. The static wind response process is shown in Fig. 65.
Over the past twenty years, the Chang'an University Wind Tunnel Laboratory has conducted static wind stability analyses on various bridge components through numerical calculations or in combination with wind tunnel tests. The research has studied the variation trends of the three-force coefficients with different factors and proposed corresponding methods to improve the static wind stability of structures. The main advances in this study are as follows.
At high wind speeds, static wind loads can easily cause static instability in long-span flexible bridges. In the study of static wind stability of long-span cable-stayed bridges and suspension bridges. Zhang (2009b) conducted comparative calculations on the static wind stability of the Sutong Bridge using three-force coefficients obtained from low and high Reynolds number wind tunnel tests and investigated the effect of Reynolds number on the static wind stability of the bridge. Hou (2012) analyzed the static wind stability of a large-span cable-stayed bridge, concluding that the static wind instability of this large-span cable-stayed bridge mainly manifested as coupled vertical bending and torsional instability. Xue et al. (2023) further performed static wind stability calculations for different construction stages of a cable-stayed bridge, discovering that the maximum double-cantilever stage exhibited instability dominated by vertical displacement, while other stages showed torsional-dominated instability. Xue et al. (2014) studied the static wind instability modes of long-span narrow pedestrian suspension bridges and found that the critical wind speed for static wind instability in pedestrian suspension bridges was much lower than that for highway suspension bridges. Guan (2016) addressed this issue by analyzing the static wind stability of seven different cross-section stiffening girders, proposing that end fairing structures could effectively improve the static wind stability of long-span pedestrian suspension bridges.
Wind load is the main cause of vibrations in suspension bridge catwalks during construction, and the displacement of the catwalk under wind load can affect the construction accuracy of the main cables. In the study of nonlinear static wind response of suspension bridge catwalks during construction, Wang et al. (2012) and Li et al. (2013) conducted three-dimensional nonlinear static wind response studies on the catwalk of the Lishui River Suspension Bridge, pointing out that the cause of static torsional instability of the catwalk was the wind pressure acting on the catwalk deck under a positive attack angle. The relaxation of the load-bearing cable tension reduced the torsional stiffness of the catwalk, making it unable to resist the air moment.
The change in mass and shape caused by icing on suspension bridges can have a significant impact on the static wind stability of large-span suspension bridges. In the study of nonlinear static wind stability of iced long-span suspension bridges, Li et al. (2021b) established finite element of a certain large-span suspension bridge in a mountainous area, both before and after icing, during the completed and construction stages. They found that the change in static wind response after icing was mainly caused by the change in the stiffening girder after icing. Icing only increased the transverse displacement and rotational displacement of the stiffening girder under the same wind speed but did not change the distribution trend of transverse displacement and rotational displacement across the bridge.
Pedestrians can change the aerostatic force coefficients of the main beam, and thus alter the static wind loads, which can result in the change of the aerostatic response (Fig. 66). Study on the influence of pedestrians on the aerostatic response of long-span pedestrian suspension bridge: Li et al. (2021a) proposed the sectional models of the human-footbridge system and used ANSYS finite element software to establish a 3D finite element model (Fig. 67) of the pedestrian suspension bridge to study the effects of the pedestrian density (ρ) and pedestrian permutations on the aerostatic response. So, it is found that: (1) with the increase of ρ, the aerostatic response increases; (2) the effects of the pedestrian permutations with ρ ≤ 0.5 P/m2 on the aerostatic response can be ignored, while there are disadvantageous effects of the pedestrian permutations with ρ > 0.5 P/m2 and larger wind-blocking area on the aerostatic response (Fig. 68). Thus, when ρ > 0.5 P/m2, the influence of different pedestrian permutations on the aerostatic response should be considered.
![]() Figure 66. Aerostatic force applied in bridge. (a) The FEA model. (b) Static wind load.
Figure 66. Aerostatic force applied in bridge. (a) The FEA model. (b) Static wind load.![]() Figure 67. The 3D FEM of the pedestrian suspension bridge. (a) The whole model. (b) The local model.
Figure 67. The 3D FEM of the pedestrian suspension bridge. (a) The whole model. (b) The local model.In the past, aerodynamic analyses of cable-stayed bridges often neglected or did not fully consider the effect of anchorage eccentricity. In the study of the effect of anchorage eccentricity on the flutter performance of large-span cable-stayed bridges, Yan et al. (2024) investigated the impact of anchorage eccentricity on the torsional deformation and flutter stability of the Sutong Bridge deck. The results showed that anchorage eccentricity had a significant effect on the static torsional deformation of the main girder, with the torsional deformation in the vicinity of the mid-span increasing the most (Fig. 69). The additional wind attack angle caused by anchorage eccentricity further weakened the flutter stability of large-span cable-stayed bridges. Therefore, the effect of anchorage eccentricity must be considered in the wind-resistant design of cable-stayed bridges.
![]() Figure 69. Distribution of torsional displacement of main girder along bridge span. (a) Initial attack angle 0° (48.4 m/s). (b) Initial attack angle 0° (81.5 m/s). (c) Initial wind attack angle +3° (48.4 m/s). (d) Initial wind attack angle +3° (81.5 m/s).
Figure 69. Distribution of torsional displacement of main girder along bridge span. (a) Initial attack angle 0° (48.4 m/s). (b) Initial attack angle 0° (81.5 m/s). (c) Initial wind attack angle +3° (48.4 m/s). (d) Initial wind attack angle +3° (81.5 m/s).4. Bridge galloping
4.1 Galloping
4.1.1 Definition of galloping
According to the Theory of Wind Loads on Structures and the Wind Resistance Calculation Manual by Zhang (1990), structures inevitably respond to wind forces. Generally, due to the presence of damping, this response is controlled, and the vibration remains stable. However, in some cases, the excitation component may generate a negative damping effect. If the wind speed reaches a certain value where the negative damping exceeds the positive damping, the vibration will intensify until it reaches a critical amplitude, leading to instability and failure (Yu et al., 2022). This phenomenon is known as galloping. Galloping is a typical instability for slender structures with certain cross-sectional shapes, such as rectangular, D-shaped, or some ice-coated transmission line profiles. Under certain conditions, these structures exhibit large-amplitude oscillations perpendicular to the wind flow (with amplitudes one to ten times or more than the cross-sectional dimension in the crosswind direction), and the vibration frequency is much lower than the vortex shedding frequency of the same cross-section.
In the book Wind Effects on Structures: An Introduction to Wind Engineering wrote by Simiu and Scanlan (1996), galloping is further explained as a one-dimensional vibration phenomenon specific to structures, which occurs under crosswind conditions and is characterized by unstable divergent vibrations. Galloping is a single-degree-of-freedom bending vibration phenomenon. The mechanism of galloping lies in the fact that the lift curve has a negative slope, resulting in negative aerodynamic damping. The structure continuously absorbs energy from the air, causing divergent vibrations. Based on the different mechanisms of occurrence, galloping can be divided into wake-induced galloping and cross-flow galloping. Wake-induced galloping is an unstable vibration triggered by the fluctuating upstream flow that passes around the front of the structure and excites downstream structures. Wake-induced galloping commonly occurs in the vibration of stay cables of cable-stayed bridges. Cross-flow galloping is a divergent bending self-excited vibration caused by the negative slope of the lift curve. This negative slope ensures that the displacement of the structure remains in the same direction as the aerodynamic force during vibration, allowing the structure to continuously absorb energy from the environment, resulting in an unstable vibration phenomenon. Cross-flow galloping generally occurs in flexible, lightweight structures with non-streamlined cross-sections, such as suspension cables and hangers in suspension bridge systems, which are most likely to experience cross-flow galloping.
4.1.2 The criterion for galloping
Galloping occurs at a critical wind speed, and when this wind speed is reached, the structure's amplitude will suddenly increase, entering a critical galloping state, and continue to increase as the wind speed rises. Therefore, one of the key issues in galloping is determining the critical wind speed, i.e., the criterion for determining whether galloping will occur.
The most basic criterion for galloping is based on the classical quasi-steady theory criterion established by Den Hartog (1932) and further developed by Parkinson and Smith (1964), and Novak (1972). The classical quasi-steady theory neglects the unsteady feedback effects of structural vibration on the separated flow and represents the aerodynamic shape of the bluff body section during crosswind vibration using the instantaneous angle of attack relative to the incoming flow. The aerodynamic self-excited forces during the section's vibration process are then calculated using static aerodynamic lift and drag coefficients (Païdoussis et al., 2010). Parkinson and Wawzonek (1981) tested the quasi-steady theory through wind tunnel experiments and found its applicability at higher reduced wind speeds. However, according to studies by Nguyen et al. (2015) and Hua et al. (2020), the Glauert-Den Hartog criterion can only predict the possibility of galloping but cannot accurately predict the critical wind speed for galloping. Hua et al. (2020) studied the galloping of main cables during construction and found that the experimentally measured critical wind speed for galloping differed by up to 70% from the critical wind speed calculated using the Glauert-Den Hartog criterion. For flexible components of long-span bridges which are less damped, the galloping may occur at relatively low reduced wind speeds. Bearman et al. (1987) and others believed that at low reduced wind speeds, structural vibration is influenced by vortex shedding, and unsteady aerodynamic forces can cause mixed vibrations of vortex-induced-vibrations and galloping. Furthermore, according to extensive experiments by Washizu et al. (1978), and Matsuda et al. (2015), when the critical wind speed for galloping of bluff body sections is close to the onset wind speed for vortex-induce-vibration, galloping and vortex-induced-vibrations may couple, resulting in a phenomenon known as unsteady soft galloping, where the classical quasi-steady theory is no longer applicable.
4.1.3 The nonlinear feature of galloping
Gao and Zhu (2016, 2017) adopted a novel synchronous force measurement and vibration method, utilizing a high-frequency force balance to obtain the time history and amplitude spectrum of aerodynamic forces acting on a segmental model during vibration. Gao et al. (2020b) conducted experimental studies on three typical width-to-height ratio sections (2:1, 1:1, 1:2). As shown in Fig. 70, the results indicated significant higher harmonic components in the measured aerodynamic force signals, suggesting strong aerodynamic nonlinearity in the self-excited vibrations. In addition to self-excited force components, there were also certain vortex shedding force components. By comparing the aerodynamic force time history signals of different width-to-height ratio sections, it was found that the aerodynamic force signals exhibited strong unsteady characteristics, i.e., the aerodynamic force signal curves were somewhat non-periodic, and the unsteadiness of the section gradually decreased. This was caused by the unsteady separation and reattachment effects of the separated flow on the section, and as the width-to-height ratio decreased, the dynamic separation and reattachment effects of the separated flow on the section also weakened, resulting in a more stable separation phenomenon. Additionally, the aerodynamic force amplitude spectrum revealed significant broadband noise in the high-frequency range for the section, attributed to random vortex shedding, which caused fluctuations in the instantaneous amplitude of the section. Hence, the aerodynamic force time-domain signals of different width-to-height ratio sections all exhibited nonlinear and unsteady characteristics to varying degrees.
![]() Figure 70. Time histories and amplitude spectra of the measured aerodynamic force during steady-amplitude stages for different side ratios. (a) Time history for B/D = 2, U* = 3.872. (b) Amplitude spectrum for B/D = 2, U* = 3.872. (c) Time history B/D = 1, U* = 2.518. (d) Amplitude spectrum for B/D = 1, U* = 2.518. (e) Time history B/D = 0.5, U* = 2.386. (f) Amplitude spectrum for B/D = 0.5, U* = 2.386.
Figure 70. Time histories and amplitude spectra of the measured aerodynamic force during steady-amplitude stages for different side ratios. (a) Time history for B/D = 2, U* = 3.872. (b) Amplitude spectrum for B/D = 2, U* = 3.872. (c) Time history B/D = 1, U* = 2.518. (d) Amplitude spectrum for B/D = 1, U* = 2.518. (e) Time history B/D = 0.5, U* = 2.386. (f) Amplitude spectrum for B/D = 0.5, U* = 2.386.The classical quasi-steady theory, however, neglects the unsteady feedback effects of the aerodynamic forces, representing the aerodynamic shape of the bluff body section during crosswind vibration by the instantaneous angle of attack relative to the incoming flow, with the aerodynamic self-excited forces during the section's vibration process calculated using static aerodynamic lift and drag coefficients (Païdoussis et al., 2010). Gao et al. (2020b) compared the wind tunnel test results of two typical rectangular sections with width-to-height ratios of 2:1 and 1:1 under Scruton number with the quasi-steady theory predictions. Fig. 71 shows the variation curves of stable amplitude with reduced wind speed calculated by the quasi-steady theory and the wind tunnel test data. The results indicated that the quasi-steady theory could not accurately predict the onset wind speed and the stable amplitude of soft galloping. The smaller the Scruton number, the greater the error. The quasi-steady theory predicts that the onset wind speed of galloping is proportional to the Scruton number. However, the soft galloping observed in experiments usually starts at a wind speed close to the onset wind speed of vortex-induced-vibrations. For the section, the quasi-steady theory can more accurately predict the slope of the variation of stable amplitude with reduced wind speed, but for the square section, the predicted slope aligns better with higher Scruton number conditions. As the Scruton number increases, the error predicted by the quasi-steady theory gradually decreases. Therefore, the quasi-steady theory cannot accurately predict the soft galloping phenomenon at low Scruton numbers, as soft galloping exhibits significant unsteady effects that must be considered in the self-excited force model. Hence, the classical quasi-steady theory is only applicable to predicting the onset wind speed and amplitude of galloping at high reduced wind speeds, while it may misjudge the soft galloping phenomenon at low reduced wind speeds.
![]() Figure 71. Comparison between wind tunnel test results and quasi-steady theoretical predictions. (a) B/D = 2:1. (b) B/D = 1:1.
Figure 71. Comparison between wind tunnel test results and quasi-steady theoretical predictions. (a) B/D = 2:1. (b) B/D = 1:1.For flexible components of long-span bridges, the structural damping ratio is often low, and galloping is likely to occur at low reduced wind speeds. However, the above results indicate that the quasi-steady theory is not suitable for soft galloping phenomena at low reduced wind speeds. Some scholars at home and abroad have attempted to establish new self-excited force models for galloping that consider unsteady effects. Based on water tunnel test results of square sections, superimposed the quasi-steady galloping force with Hartlen-Currie's lift oscillator model to predict soft galloping phenomena. Corless and Parkinson (1988, 1993) later improved Bouclin's model by introducing acceleration terms into Hartlen-Currie's lift oscillator model. Tamura and Shimada (1987) superimposed the quasi-steady galloping force with the Birkhoff wake oscillator model. Recently, Mannini et al. (2018) and others improved the key parameter determination of the Tamura and Shimada model to predict soft galloping phenomena for rectangular sections with a width-to-height ratio of 2:3. In summary, the modeling approach of foreign scholars has been to directly superimpose the quasi-steady galloping force with some empirical vortex-induced force model to account for unsteady effects. Early models could predict some experimental results, but the prediction accuracy was not high, leaving a significant gap for practical engineering applications. Therefore, there is a need to propose more accurate and physically meaningful unsteady self-excited force models for galloping.
Gao and Zhu (2017), based on improved force measurement techniques that can accurately and directly measure unsteady galloping forces from a spring-suspended segmental model, established a full-order unsteady self-excited force model. After simplifying the model by neglecting irrelevant terms using the energy equivalence principle, they obtained the following equations Eqs. (16) and (17), which are nonlinear unsteady self-excited force models suitable for practical engineering applications (Gao et al., 2020d). These models supplement and develop the classical Glauert-Den Hartog criterion to address the distortion in predicting soft galloping phenomena at large width-to-height ratios and low wind speeds.
$$ F_y=\rho U^2 B Y_1^*\left(1+\epsilon_3 \frac{a_h^2}{B^2}+\epsilon_5 \frac{a_h^4}{B^4}\right) \frac{\dot{y}}{U} $$ (16) (17) where ah represents the instantaneous crosswind amplitude,
and are nonlinear aerodynamic parameters, y and are vibration amplitude and velocity respectively, is model circular frequency. After adopting the above nonlinear aerodynamic force model, the free vibration equation of the segmental model Eq. (18) is as follows.
$$ m \ddot{y}+c_{\mathrm{m}}\left(a_{\mathrm{h}}\right) \dot{y}+k_m\left(a_{\mathrm{h}}\right) y=\rho U^2 B \tilde{Y}_1^*\left(1+\epsilon_3 \frac{\tilde{a}_{\mathrm{h}}^2}{\mathrm{~B}^2}+\epsilon_5 \frac{\tilde{a}_{\mathrm{h}}^4}{\mathrm{~B}^4}\right) \frac{\bar{y}}{U} $$ (18) where m is the effective mass per unit length of the elastically-supported system, cm(ah) and km(ah) are the amplitude-dependent mechanical damping and stiffness coefficients identified about ah from the free decay responses in still air.
By substituting the experimentally measured aerodynamic parameter identification values into the above segmental model free vibration equation, calculations were performed for the rectangular section with a width-to-height ratio of B/D = 2. The calculation results are shown in Fig. 72. It can be seen that the calculation results are in good agreement with the experimental values, and both the stable amplitude and onset wind speed can be well predicted.
![]() Figure 72. Comparison between calculated and experimental values of soft galloping response of cross-section with aspect ratio B/D = 2. (a) Stable amplitude. (b) Instantaneous amplitude (U* = 2.357).
Figure 72. Comparison between calculated and experimental values of soft galloping response of cross-section with aspect ratio B/D = 2. (a) Stable amplitude. (b) Instantaneous amplitude (U* = 2.357).This nonlinear unsteady self-excited force model can accurately predict the soft galloping and vortex-induced-vibration phenomena of bluff body sections with different width-to-height ratios. Additionally, this nonlinear galloping force model is simple in mathematical form, has clear physical concepts, and requires only a small number of wind tunnel tests for parameter identification, providing important theoretical basis and design references for practical engineering applications.
4.2 Bridge tower galloping
4.2.1 Characteristics of bridge tower galloping
When wind flows around the bridge deck and tower sections, the separation, reattachment, and vortex shedding of the airflow can cause complex fluid-structure interactions, leading to various wind-induced vibrations in bridges. For long-span bridges, especially those with steel structural systems, the towers are characterized by small width-to-height ratios, low damping, low stiffness, lightweight, and blunt cross-sections. These factors make the bridge towers susceptible to galloping vibrations both during the construction phase and in their completed state (Ma et al., 2018). Although the Glauert-Den Hartog criterion provides a basic formula for calculating the critical wind speed for galloping, it does not fully account for the effect of nonlinear damping forces on bridge structures. Therefore, further analysis of the steady-state response of such tall, rectangular-sectioned large structures after galloping occurs is necessary. Galloping is a divergent vibration that, once initiated, can lead to structural failure. Aerodynamic optimization of the section to increase the critical wind speed for galloping is essential to ensure the wind resistance safety of the bridge (Buljac et al., 2017).
Galloping is a pure bending instability caused by the self-excitation of airflow on slender structures with specific cross-sectional shapes. Generally, squat circular sections or rectangular sections with a width-to-height ratio of are prone to vortex-induced-vibrations; sections with a width-to-height ratio of 0.7–2.5–3.0 are prone to galloping; sections with a width-to-height ratio of 2.5–7.0–7.5 are prone to torsional flutter (Ito and Kawada, 2002).
Tamura and Itoh (1999), using numerical simulation methods such as finite difference analysis, studied the unstable aerodynamic phenomena of rectangular sections with different width-to-height ratios and found that the width-to-height ratio (B/D = 1:5–4:5) significantly affects the galloping characteristics of rectangular sections. Specifically, for rectangular columns with small width-to-height ratios (B/D = 1:5), destructive galloping may occur at low wind speeds, with amplitudes reaching 0.978. Therefore, the width-to-height ratio should be carefully considered in the design of bridge tower sections.
Gao et al. (2020a) conducted wind tunnel tests to study the crosswind self-excited vibration phenomena of three typical rectangular sections with width-to-height ratios of (2:1, 1:1, 1:2). The results, which took into account the effect of Scruton numbers, showed that the width-to-height ratio has a significant impact on the vibration phenomena, as illustrated in Fig. 73. The onset wind speed for soft galloping was higher than that for vortex-induced-vibrations, and the amplitude at higher Scruton numbers showed significant fluctuations, as indicated by the error bars in Fig. 73(b). For sections with a width-to-height ratio of B/D = 0.5, Fig. 73(c) shows that the self-excited vibration exhibited a self-limiting vortex-induced-vibration resonance phenomenon. The experiment also found that as the Scruton number increased, the amplitude fluctuations of the stable vortex-induced-vibration resonance increased, resulting in larger error bars in Fig. 73(c). This instability may be due to the interaction between the upper and lower shear layers. In summary, larger width-to-height ratios are often associated with stronger coupling between galloping and vortex-induced-vibrations, as the section's vibration more significantly affects the separated flow. When the width-to-height ratio further decreases to 0.5, vortex-induced-vibrations and galloping completely separate and no longer couple. Therefore, the nonlinear coupling vibration phenomena of rectangular sections with different width-to-height ratios are noteworthy, particularly the soft galloping phenomena at low Scruton numbers and low wind speeds, which should be given special attention in engineering design.
![]() Figure 73. Observed transverse aerodynamic instabilities of rectangular cylinders with different side ratios. (a) B/D = 2. (b) B/D = 1. (c) B/D = 0.5.
Figure 73. Observed transverse aerodynamic instabilities of rectangular cylinders with different side ratios. (a) B/D = 2. (b) B/D = 1. (c) B/D = 0.5.While most studies by researchers such as Li et al. (2012c) focused on rectangular, quasi-rectangular, or trapezoidal sections, some scholars have also studied special forms of sections. For example, Alonso and Meseguer (2006) investigated the galloping stability of triangular sections through wind tunnel tests, showing that the galloping characteristics of triangular sections are influenced by the geometric shape and wind angle, with a high risk of galloping within a certain range of vertex angles or wind direction angles.
Steel bridge towers have lower damping ratios than steel-concrete composite towers, with concrete towers having the highest damping ratios. Consequently, wind-induced vibrations in concrete towers are smaller, while steel towers exhibit the most significant wind-induced vibration response and are most susceptible to galloping. Compared to single-column, diamond-shaped, A-shaped, and V-shaped bridge towers, twin-column bridge towers have lower fundamental frequencies and are more prone to vortex-induced-vibration resonance under similar conditions, particularly in torsional displacements, requiring careful design consideration (He et al., 2007).
Overall, turbulent flow suppresses galloping in bridge towers compared to uniform flow. Additionally, factors such as the bridge tower's natural frequency, damping characteristics, and cross-sectional shape, which vary significantly under different construction states, will significantly impact the galloping characteristics of the bridge tower. Among these, the double-cantilever state is most prone to galloping (Wu, 2019).
Self-supporting towers (bare towers) lack the restraint of complete bridge cables, resulting in low stiffness and damping. Therefore, wind-induced vibrations in such bridge towers are a key factor in selecting the design scheme. For tall structures like bridge towers, large amplitude galloping in the crosswind direction may occur under certain conditions. Galloping causes the greatest damage to bridge towers, and it should be avoided in practical engineering. Gu and Xiang (1991), He et al. (2007), and Zhou et al. (2020) studied the galloping performance of self-supporting bridge towers, finding that self-supporting towers generally have sufficient galloping stability. By rational structural design and considering the influence of the flow field, galloping response in bridge towers can be effectively avoided. However, galloping response still depends on factors such as turbulence intensity, aerodynamic damping, and the degree of change in the average wind angle with wind resistance. Therefore, galloping response in self-supporting towers remains a concern. Liao et al. (2020) conducted wind tunnel tests on the aeroelastic model of the bridge tower of the Hong Kong–Zhuhai–Macao Bridge's direct navigation channel bridge during the construction period. Due to the unreasonable aerodynamic design of the tower structure, crosswind galloping occurred under the most unfavorable working conditions at specific wind direction angles and wind speeds. Aerodynamic optimization measures were then adopted to suppress the vibrations.
4.2.2 Countermeasures for bridge tower galloping
The cross-sectional shape, width-to-height ratio, material, flow field state, construction state, and structural form of bridge towers determine the tower's damping, stiffness, frequency, and aerodynamic characteristics, which in turn determine the occurrence of galloping. Based on the above influencing factors, three types of vibration reduction measures can be taken: structural measures, mechanical damping measures, and aerodynamic measures.
Structural measures involve choosing appropriate materials and structural forms for the bridge tower. For example, concrete bridge towers have higher damping ratios than steel towers and steel-concrete composite towers. Additionally, compared to single-column, diamond-shaped, A-shaped, and V-shaped bridge towers, twin-column bridge towers commonly used in suspension bridges have lower fundamental frequencies and are more prone to wind-induced vibrations (He et al., 2007).
When aerodynamic measures do not achieve the desired vibration reduction effect, mechanical damping measures can be considered, primarily by installing dampers to increase the bridge tower's damping. Control methods are divided into active control, passive control, semi-automatic control, and hybrid control. Since active control methods, except for passive control, require external energy sources and have complex structures that are difficult to maintain or replace, passive control methods are commonly used. Available dampers include tuned mass dampers (TMD), tuned liquid dampers (TLD), tuned liquid column dampers (TLCD), multiple tuned mass dampers (MTMD), and multiple tuned liquid dampers (MTLD). The position of the damper should be at the maximum displacement of the controlled mode shape. In Japan, sliding block damping is used in bridge towers such as the Kanmon Bridge, Innoshima Bridge, and North Bisan Seto Bridge. TMDs have been used on the bridge towers of the Chao Phraya River Ninth Bridge in Bangkok and the Osaka Port Pier Bridge. An IMD was used on the Fuchu Lake Bridge tower (Arco and Aparicio, 2001). During the construction of the main towers of the Innoshima Bridge, one tower used sliding friction, while the other replaced the sliding block with an oil damper (Liu and Bao, 2003) Additionally, gyroscopic vibration damping devices, which use the directional stability of a gyroscope to suppress bridge tower vibrations, can effectively reduce large-amplitude vibrations (galloping) that can cause damage to tall structures (Hao, 2010).
Aerodynamic measures include changing the shape of the tower column section and adding aerodynamic devices. The shape of the tower column section affects the airflow around the tower column. Changing the section shape will alter the airflow state, thereby changing the excitation force (Liu and Bao, 2003). These aerodynamic measures are simple, convenient, maintenance-free, cost-effective, and can effectively improve the aerodynamic stability of the structure, reducing wind-induced vibration amplitudes. For bridge tower columns, aerodynamic measures include rounding the outer corners and squaring the inner corners of rectangular sections; rounding the inner corners and squaring the outer corners; adding grooves in the longitudinal or crosswise directions; and adding deflectors. These measures can improve the galloping stability of bridge towers to varying degrees. The Akashi Kaikyō Bridge adopted a cross-shaped section by chamfering the rectangular section (Liu and Bao, 2003).
Auxiliary aerodynamic devices are generally used when the section shape of the tower column cannot be changed. Currently, these devices mainly include arc-shaped flow control plates and additional rotors. Kubo et al. (1996) successfully used cylindrical rotors placed at the corners of a prismatic body to suppress wind-induced vibrations in high-rise buildings, with experiments validating the effectiveness. On the curved cable-stayed bridge tower with a rectangular section in Tokyo's Katsushika district, arc-shaped flow control plates were installed around the tower column from the top to one-third of the height to suppress galloping, and the lower one-third of the tower height connected the flow control plates into a closed section, thus controlling the bridge tower's vibration (Liu and Bao, 2003).
4.3 Bridge cable galloping
4.3.1 Main cable galloping
With the increase in bridge span lengths, wind resistance often becomes a critical factor in the design and construction of suspension bridges. The construction of the main cables is a crucial phase in the construction of long-span suspension bridges. Main cables are typically composed of dozens of strands, each consisting of hundreds of high-strength steel wires. The shape of the main cable cross-section changes as the installation progresses. During the installation process, the irregular cross-section of the main cables results in complex aerodynamic flow characteristics, making them susceptible to wind-induced vibrations.
Li et al. (2009a) used CFD simulation to study the galloping force coefficients and critical wind speed of the main cables during the construction phase of a large-span suspension bridge in the East China Sea, both with and without wind-resistant measures. The results showed that the main cables experienced galloping without wind-resistant measures, whereas the critical wind speed for galloping increased after implementing such measures, reducing the risk of galloping. In 2015, Li et al. (2015) further calculated the three-force coefficient curves for different cross-sectional shapes of the main cables during construction using CFD, indicating that galloping could occur throughout the entire installation process.
Additionally, the presence of the catwalk during construction affects the galloping response of the main cables. The galloping force coefficients of the main cables differed significantly when the influence of the catwalk was considered. After accounting for the catwalk, the wind attack angle range where galloping instability occurred in the main cables varied under different conditions, and the trend of the galloping force coefficient also changed. Jia (2008) showed that the lateral vibrations of the catwalk during construction could significantly impact the forces on the main cables during construction and after bridge completion, affecting structural damping, frequency, and other dynamic characteristics, which in turn unpredictably influence the galloping characteristics of the main cables. Therefore, the structural design and aerodynamic shape of the catwalk are crucial to the galloping response of the main cables during construction.
4.3.2 Suspend hanger galloping subject to cross wind
H-shaped hangers are widely used in long-span arch bridges or steel truss bridges due to their strong bending resistance and ease of manufacture and construction. However, H-shaped hangers are lightweight, flexible, have low damping, and their blunt aerodynamic shape can lead to significant flow separation. Under natural wind conditions, they are prone to vortex shedding, crosswind galloping, and flutter, potentially causing fatigue or even damage to the structural components, thus affecting the bridge's structural safety and the normal passage of vehicles.
Bai et al. (2020b) conducted wind tunnel tests and numerical simulations on the wind-induced vibration performance of H-shaped hangers with a width-to-height ratio of 3:1 based on the Zengjiayan Jialing River Bridge. As shown in Fig. 74, The study found that the original cross-section exhibited significant galloping at a wind attack angle of 90°. Consequently, measures such as perforating the hanger's surface and adding aerodynamic stabilizers were considered to eliminate galloping. The study found that perforating the web or flange alone with a low perforation rate could not eliminate galloping and could transform the problem into vortex shedding while reducing the section's strength and increasing stress concentration, posing significant risks to the compression members. Further research is needed to determine the appropriate perforation range for hangers. As shown in Fig. 75, Aerodynamic stabilizers were found to have a significant effect on improving the galloping performance of H-shaped hangers by altering the flow pattern around the structure, converting large-scale, low-energy vortices into small-scale, high-energy vortices, thereby reducing the self-excited forces associated with galloping.
![]() Figure 74. Displacement response of the original cross-section at different attack angles.
Figure 74. Displacement response of the original cross-section at different attack angles.Wei (2023) and Yan (2023) further used a new three-degree-of-freedom coupled vibration wind tunnel test device to conduct section model tests and aeroelastic model tests on H-shaped hangers, as shown in Figs. 76 and 77. As shown in Fig. 78, The results showed that H-shaped sections with width-to-height ratios of 3:1 and 1:2 were susceptible to crosswind galloping at various wind attack angles. Meanwhile, as shown in Fig. 79, the vibration responses under different wind attack angles obtained through aeroelastic model tests are presented. The study also explored measures to suppress galloping in H-shaped hangers, such as increasing structural damping, adjusting the incoming wind field, and perforating the web and flange. The results indicated that increasing structural damping and creating turbulent flow fields could effectively suppress galloping. Perforating the web and flange was found to be an effective galloping control measure, capable of transforming galloping into flutter. Specific perforation schemes for the two types of H-shaped hangers were proposed, with optimal perforation rates of 15%–25% for the flange and 10%–32% for the web for H-shaped hangers with a width-to-height ratio of 3:1, and 28% for the web and 8%–26% for the flange for H-shaped hangers with a width-to-height ratio of 1:2.
4.3.3 Stayed cable galloping subject to wake flow
Vortex-induced galloping of stay cables in cable-stayed bridges occurs when cables are arranged side by side in the crosswind direction. When the wind passes through the windward cable, an unstable galloping zone forms in its wake. If the leeward cable is in this zone, it may experience large-amplitude wind-induced vibrations along an elliptical path due to the excitation from the fluctuating wake of the windward cable. This phenomenon can occur when the cables are closely spaced or widely spaced, with three zones: near-distance instability, stable, and far-distance instability.
Li et al. (2010b) explored the vortex-induced galloping of parallel stay cables under natural wind conditions in cable-stayed bridges. The study focused on the far-distance instability zone of stay cables with significant three-dimensional aerodynamic flow characteristics. The effects of cable spacing, wind direction angle, and wind attack angle were studied, and the motion trajectory of the downstream cable's vortex-induced galloping was obtained. The results confirmed the influence of factors such as cable spacing, incoming wind direction angle, and wind attack angle on the downstream cable's galloping.
The Weicheng Bridge in Xianyang City (referred to as Weicheng Bridge) is a single-tower, double-plane cable-stayed bridge with two 100-m spans, as shown in Fig. 80. It was completed in September 1995 and has been in operation for 27 years. It was the largest single-tower cable-stayed bridge in Northwest China at the time of its completion and serves as an important link between Xi'an and Xianyang. In early 2023, the stay cables of the bridge were replaced, but from March 31 to April 5, abnormal vibrations were observed in multiple cables, including both short cables (cable 4) and long cables (cable 11). The frequent and large-amplitude vibrations were particularly observed frequently in the long cable YS11-1 (cable length 114 m), as shown in Fig. 81.
The wind resistance and earthquake resistance team at Chang'an University analyzed the cause of these vibrations. Using dynamic identification techniques on videos captured on-site, the structural vibration characteristics of the stay cables were extracted. It was found that the vibrations of cables 10 and 11, which had large amplitudes, were similar to the vortex-induced galloping of downstream cables. After the cable replacement, the ratio of the spacing to the diameter of the double-row stay cables was reduced falling into the range that is highly susceptible to vortex-induced galloping. The galloping onset wind speed calculated based on previous observations was 2.7–6.1 m/s, which matched the measured wind speed on-site. Thus, it was preliminarily determined that the vibrations were due to vortex-induced galloping.
Research by Liu et al. (2000) on viscous shear-type dampers for stay cables in cable-stayed bridges has shown that a single viscous shear damper can control the in-plane and out-of-plane vibrations of a stay cable. These dampers are simple in construction, easy to manufacture, and highly adaptable to different environments. The damping coefficient can be easily controlled by adjusting the amount of viscous material injected. The Chang'an University team has applied viscous shear-type dampers in practical projects, including the Sutong Bridge, Yumenkou Yellow River Highway Bridge, Zhaobaoshan Bridge in Ningbo, Junshan Yangtze River Bridge in Wuhan, and Jinan Weiliu Road Viaduct, as shown in Figs. 82-84. These applications have proven the effectiveness of these dampers in suppressing cable vibrations. After a failure incident with the original dampers on the Sutong Bridge during a typhoon in 2018, the failed dampers were replaced with viscous shear-type dampers. This replacement significantly improved the structural damping of the cables, meeting the target requirements, and no abnormal vibrations have been observed since then. The dampers installed on the Zhaobaoshan Bridge in Ningbo and the Junshan Yangtze River Bridge in Wuhan have been in continuous operation for over twenty years, further proving the durability and reliability of these dampers.
The team proposed a targeted vibration control solution for the abnormal vibrations of the Weicheng Bridge stay cables, suggesting the installation of external viscous shear-type dampers on stay cables longer than 90 m, as shown in Fig. 84.
Before and after installing the measures, forced vibration testing was conducted, and acceleration sensors installed on the stay cables collected vibration signals to analyze and identify the damping. The acceleration time history signals are shown in Figs. 85 and 86.
![]() Figure 85. Time domain signal of the first-order free decay vibration of the cable without damper installed.
Figure 85. Time domain signal of the first-order free decay vibration of the cable without damper installed.![]() Figure 86. Time domain signal of the first-order vibration of the cable with damper installed.
Figure 86. Time domain signal of the first-order vibration of the cable with damper installed.The comparison of the time-domain vibration signals before and after the measures indicates a significant reduction in vibration decay time after installing the viscous shear-type dampers, from 4 min before installation to less than 30 s after installation. The post-installation vibration decay time was only 1/8th of the pre-installation time.
The vibration test results for the YS10-1 cable, shown in Table 5, indicate that the logarithmic decay rate increased from 0.021 before installation to 0.179 after installation, an 8.5-fold improvement. According to Kumarasena et al. (2007), when the logarithmic decay rate of stay cables exceeds 0.03, various vibrations of the cables can be effectively suppressed. Thus, it can be concluded that the measures taken have achieved the desired vibration reduction, which will play a significant role in extending the service life of the stay cables and the bridge.
Table 5. YS10-1 Diagonal cable vibration test results.Fundamental frequency (Hz) Logarithmic decay Theoretical 1.00 No damper 0.021 Measured 1.05 With damper 0.179 5. Bridge flutter
5.1 Background of bridge flutter
When the stiffness of the bridge structure is high, the aerodynamic forces will not cause the bridge cross-section to move. However, when the stiffness of the bridge structure is low, the bridge will experience wind-induced vibration phenomena. With the movement of the cross-section, if the disturbance to the surrounding flow field is small, the aerodynamic force on the bridge cross-section is an external forced vibration force. And when the flow field is greatly affected by the movement of the bridge cross-section, the bridge cross-section will interact with the surrounding airflow, forming a closed system. When the structural damping and air damping form a system damping that becomes negative, the system will continuously absorb external energy and eventually diverge, that is, flutter occurs. The flutter mechanism can be divided into two-dimensional separated flow flutter theory, two-dimensional classical coupling theory, and three-dimensional finite element analysis frequency domain and time domain analysis methods according to the analysis methods and theories of flutter.
5.1.1 Two-dimensional classical coupling flutter theory
Theodorsen (1935) theoretically studied the aerodynamic self-excited force of thin flat plates and obtained the theoretical expression of the unsteady aerodynamic self-excited force on the plate using potential flow theory. Bleich (1949) applied the ideal flat plate aerodynamic force in the form of Theodorsen to the flutter analysis of suspension bridges and successfully established the classical coupling flutter analysis method for suspension bridges. In order to consider the difference brought by the actual bridge cross-section not being an ideal thin flat plate, they determined a series of cross-section shape correction coefficients through experiments to correct the flutter critical wind speed of the plate.
In general, this series of methods is only suitable for solving the classical bending-torsion coupling flutter problem of streamlined cross-section bridges, because only the airflow around this type of cross-section is close to the flat plate, and it is possible to meet the premise conditions for the establishment of the Theodorsen form of unsteady aerodynamic force.
5.1.2 Two-dimensional separated flow flutter theory
Since most bridge cross-sections are non-streamlined, when the airflow passes through the vibrating non-streamlined cross-section, separation will occur at the corners on the windward side, accompanied by vortex shedding, and flow reattachment may also occur. The flow pattern is very complex, and the Theodorsen formula based on the potential flow principle cannot correctly describe the unsteady aerodynamic force acting on the non-streamlined cross-section. In order to solve the separated flow flutter problem of non-streamlined cross-sections, Scanlan and Tomko (1971) analyzed in detail the differences in aerodynamic coefficients between bluff body bridge cross-sections and streamlined airfoils, and proposed the separated flow flutter theory. Scanlan applied the self-excited force expression containing six aerodynamic coefficients to the two-dimensional flutter analysis and obtained.
(19) (20) where B is the bridge cross-section width,
is the dimensionless reduced frequency, and and (i = 1, 2, 3) are aerodynamic derivatives, n, a, and ρ are the vertical, torsional, and lateral displacements, respectively; and are the dimensionless nonlinear aerodynamic damping related to the vertical and lateral displacement respectively. With the advancement of wind tunnel testing technology and measurement methods, Sarkar et al. (1994) considered the effect of lateral displacement in the aerodynamic self-excited force model and proposed an aerodynamic self-excited force theory containing 18 aerodynamic coefficients. 5.1.3 Three-dimensional flutter analysis
5.1.3.1 Three-dimensional flutter frequency domain analysis
Three-dimensional flutter theory takes into account the correlation of bridge structures in the span direction compared to two-dimensional theory. Scanlan et al. (1974) introduced modal coordinates on the basis of two-dimensional flutter analysis to obtain the system's equations of motion, but the interaction forces between various components of the bridge were still not well considered. Therefore, to improve the accuracy of the analysis, the frequency domain analysis method was better utilized. Xie and Xiang (1985) noted the multi-modal flutter characteristics of cable-stayed bridges, proposed a non-steady aerodynamic self-excited force model based on the Laplace domain Ronger rational fraction series, and then proposed a state-space method for finite element multi-modal flutter analysis. Later, Chen (2007) applied this method to the flutter stability analysis of suspension bridges and achieved good results.
Based on the flutter theory and self-excited force model, various methods for analyzing flutter stability have been proposed, which can be divided into two major categories. The first is the multi-modal flutter analysis method, which is based on the natural modal coordinates of the structure to analyze the flutter stability of the structure. The system flutter motion equation was analyzed by Agar (1989) and Beith (1998) using an asymmetric real matrix eigenvalue, where the key to the problem is the two-parameter search iteration solution. Namini et al. (1992) proposed a multi-modal PK-F method to solve the flutter problem, the characteristic of this method is that it requires solving a set of nonlinear equations, which can describe the phenomena that occur throughout the process of structural flutter. Matsumoto et al. (1999) conducted a systematic study on the flutter problem of a series of two-dimensional cross-sections and proposed a step-by-step analysis method for flutter, which divides the flutter motion into two branches of torsion and vertical motion, and can not only describe the laws of system damping and system frequency change with wind speed but also reflect the role of various flutter coefficients in the change of system vibration parameter at the flutter occurrence point. Jain et al. (1996) also transformed the problem into solving the characteristic value problem, but it is necessary to solve the real part and imaginary part equations of the characteristic polynomial, and then flutter analysis can be carried out. The above methods are all based on Scanlan's linear self-excited force model and require a two-parameter iterative solution process. Ding et al. (2003) proposed a multi-modal and full-order coupling flutter calculation method for large-span bridges based on the complex modal single-parameter search.
The second method is the direct (or full-order) flutter analysis method or flutter full-order analysis method, which uses the physical coordinates of the finite element model. Japanese scholars Miyata and Yamada (1990) first proposed the direct flutter analysis theory, which safely ignores the effect of structural damping on flutter, so there is no need for an iterative search process during the flutter analysis, but the process still requires a large amount of calculation. Dung et al. (1998) on the basis of this theory, using modal tracking technology to solve the characteristic equation, to some extent, the calculation efficiency has been improved, but the structure's damping still cannot be considered in the calculation process. Ge and Xiang (2001) proposed a full-order method for analyzing the flutter of large-span bridges in three-dimensional physical coordinates, which can effectively consider the effect of structural damping on flutter and significantly improve the calculation efficiency of flutter analysis.
5.1.3.2 Three-dimensional flutter time domain analysis
Inherent modal coordinates are based on the frequency domain analysis of flutter stability, and their calculation process is efficient and simple, but the disadvantage is that they cannot consider the effect of nonlinear factors on flutter stability, such as structural nonlinearity, aerodynamic nonlinearity, and the effect of turbulence on flutter stability. Although the time domain analysis method has a very large amount of calculation, it will not encounter the problems in the frequency domain analysis process, so in the case of appropriate calculation conditions, the time domain analysis method is a very favorable means.
Scanlan et al. (1974) used the step function to express the self-excited aerodynamic force under arbitrary motion of the main beam cross-section, and first proposed the time domain flutter analysis method. Lin (1979) used the time domain method to study the effect of turbulence on the flutter stability of bridges. Lin and Yang (1983) proposed a self-excited force model, which can be represented by the unit impulse response function, and this model describes the coupling aerodynamic force in the three directions more accurately, and the aerodynamic force form expressed by the impulse response function fully considers the aerodynamic force under the coupling effect, thus the flutter analysis of bridge structures using the time domain method is more common.
In summary, by around 2000, the basic theory of bridge flutter calculation and analysis had been established; by around 2010, the refined flutter calculation theory considering the nonlinear effects caused by the wind-induced displacement of the main beam had also been established. However, considering the limitations of linear flutter theory, such as, it cannot perform flutter calculations under large amplitude conditions, or the calculation of amplitude and wind speed after flutter, etc., the research on nonlinear aerodynamics and nonlinear flutter has gradually become the focus and mainstream of bridge flutter research.
5.2 Flutter mechanism research
Currently, bridge flutter mechanism research is mainly carried out in three aspects: the first is to use CFD as a means to focus on the wind field characteristics that cause bridge flutter, including pressure, velocity distribution, and the generation and motion laws of vortices; the second is to use two-dimensional flutter analysis methods to focus on the driving mechanism of bridge flutter, flutter form, that is, the degree of participation of degrees of freedom and the aerodynamic performance of various cross-sections; the third is to use three-dimensional flutter analysis methods to focus on the modal participation effect when bridge flutter occurs.
At present, the CFD method still cannot directly replace the wind tunnel test, so the most appropriate method for flutter mechanism research is to combine wind tunnel tests with theoretical calculations. Flutter mechanism research must be based on quantitative analysis, and the basis of quantitative analysis lies in the identification of flutter derivatives, which is the premise of subsequent calculations.
5.2.1 Flutter derivatives
Flutter derivatives are necessary parameter for calculating the critical wind speed of flutter, which depend on the aerodynamic shape of the structure and comprehensively reflect the relationship between self-excited force, displacement, velocity, etc., of the bridge cross-section under the action of airflow. Bridge cross-section flutter derivatives must be identified through model wind tunnel tests or computational fluid dynamics numerical simulation. According to the different motion modes, the identification methods of bridge flutter derivatives are divided into free vibration method and forced vibration method.
Scanlan and Tomko (1971) first applied the free vibration method to the test of bridge section models, using the divided state free vibration method, first measuring the relevant direct flutter derivatives through pure bending and pure torsion decaying free vibration tests, and then using the direct flutter derivatives and two-degree-of-freedom tests to obtain the cross flutter derivatives, which is also the most widely used method at present. Xie and Xiang (1985) proposed the state-space method for the coupled flutter analysis of cable-stayed bridges, and also developed an initial impulse coupled vibration method based on the Kalman filter to identify the self-excited force coefficient matrix in the non-steady self-excited force model that is independent of vibration frequency.
Yamada (1992) used the extended Kalman filter (EFK) method to identify aerodynamic derivatives. Ibrahim and Mikulcik (1977) proposed a time-domain system identification method based on the principle of instrumental variable method, which was later called the Ibrahim time-domain method (ITD). Sarkar et al. (1994) improved the system parameter identification accuracy by introducing an iterative method, called the modified ITD method (MITD). Zhang et al. (1997) proposed the total least squares method (ULS) to identify system parameter and bridge cross-section aerodynamic derivatives. Ding et al. (2001) improved the ULS method and proposed the modified least squares method (MLS). Zhou et al. (2002) used the fast discrete vortex method to calculate the aerodynamic derivatives of the bridge main beam cross-section, with the incoming flow being two-dimensional viscous incompressible uniform flow. The surface vortex quantity was calculated using the integral representation method of the boundary element and the new vortex quantity boundary condition, and the meshless method was obtained by introducing the fast multipole sub-expansion and coefficient influence matrix technology, which enabled the rapid calculation of the vortex element velocity. The cross-section was forced to vibrate in torsion and vertically, and the aerodynamic force was calculated separately using the discrete vortex method, and the aerodynamic derivatives were obtained according to the least squares method, and the flutter critical wind speed was determined using Scanlan's semi-inverse solution method.
Zhu and Chen (2004) started from the N-S equation describing the flow of rigid cross-sections in the flow, and used the second-order Projection-2 algorithm for time to split the control equation, and the spatial discretization of the obtained solution equation used the finite volume method, and the object surface movement method was the forced vibration of the decoupled degrees of freedom, and the moving grid technology of the calculation grid and the rigid connection and synchronous motion of the rigid cross-section were adopted, and the flow field around the large Daidong Bridge was numerically simulated, and the aerodynamic derivatives were extracted according to the least squares method, and finally, the flutter critical wind speed of the large Daidong Bridge was calculated, proving the correctness and engineering applicability of this numerical method.
Zhu and Gu (2014) proposed a CFD-AM-CSD method for quickly predicting the flutter critical wind speed of large-span bridges and verified the feasibility and effectiveness of this method. Luo (2008) proposed a phased extended least squares iterative algorithm (SEO-ILS) for system matrix identification based on the ILS method.
For streamlined bridge cross-sections, the UDF program was compiled by themselves to achieve the forced vibration method of structural state separation, and the stable aerodynamic force was extracted, and the flutter derivatives were obtained according to the least squares method at different reduced wind speeds Bai et al. (2011). The results show that the forced vibration method of structural state separation for identifying flutter derivatives is in good agreement with the theoretical solution.
Using the theoretical analysis method, a simplified expression for the system's associated torsional motion damping ratio affecting the flutter stability of the bridge was given, and the flutter derivatives were calculated using the Fung formula, and the flutter derivatives were calculated using the Scanlan formula, which can better connect the three-force coefficients with the flutter derivatives Bai et al. (2014). The results show that the slope of the three-force coefficient is related to the flutter stability of the bridge, and the smaller the product of the lift coefficient slope and the moment coefficient slope of the main beam cross-section, the more favorable it is for the flutter stability of the bridge. When the flutter derivative is negative, it is beneficial to reduce the aerodynamic negative damping and play a stabilizing role for the structure. This method can quickly evaluate the flutter stability of the bridge structure through simple force test results. In order to quickly evaluate the flutter stability performance of bridge structures, the relationship between the three-force coefficient and the flutter derivative was determined based on the frequency domain analysis method, and the unit aerodynamic damping matrix and aerodynamic stiffness matrix in the vibration equation were analyzed, and the flutter instability problem was studied by using the flutter derivative Bai et al. (2016a). A rapid evaluation parameter F for flutter stability based on the three-force coefficient was given in Eq. (21), of which the definition of the parameters can be found in previous sections. Combined with the results of the static three-force and flutter stability wind tunnel test of typical bridge cross-sections, the effectiveness of using the F parameter to quickly evaluate the flutter stability performance was verified (Table 6). The research results show that: by establishing the connection between the three-force coefficient and the flutter derivative, the flutter stability of the bridge structure can be quickly evaluated using the three-force coefficient, and the flutter stability is negatively correlated with the lift coefficient, drag coefficient, and the absolute value of the lift moment coefficient; the larger the value, the more likely the bridge structure is to flutter instability; using the F parameter formula, the method of quickly evaluating the flutter stability can quickly compare the flutter stability of different schemes, which is convenient for aerodynamic typing.
(21) Table 6. Flutter critical wind speeds and parameter F of typical sections.Object Cross-section Parameter F Flutter critical wind speeds (m/s) Ideal flat plate Flat plate 0.1478 16.5 Jiangyin Bridge Closed box beam 0.2087 71.3 Xihoumen Bridge Slotted box beam 1.1936 89.2 Messina Strait Bridge Double slotted blunt body section 9.5733 90.0 In Li et al. (2017b), based on the sectional model bending-torsion coupling free vibration test, a weighted least squares iteration method (WLS method) for identifying bridge deck flutter derivatives was proposed by introducing a weighting matrix into the existing least squares iteration method. A sectional model simulation system was designed to compare the WLS method with existing methods, and the test results verified that the WLS method has better identification accuracy and computational efficiency. Finally, a flutter derivative identification program was developed in MATLAB language and applied to wind tunnel tests. The correctness and reliability of the method were verified by comparing the wind tunnel test results obtained by different identification methods.
Based on the principle of energy equivalence, the Scanlan linear flutter self-excited force was divided into pure damping effect items, pure stiffness effect items, and dual effect items that have both stiffness and damping effects Liu et al. (2020). The instantaneous work of the self-excited force was calculated by integrating the pure damping items and the pure stiffness items, and the classical coupled flutter driving mechanism was studied from the perspective of functionality. Finally, the coupled flutter differential equation was transformed into a functional equation form, and a flutter derivative identification method based on the instantaneous work of the self-excited force was proposed and proven to be reliable.
Bai et al. (2021) used the Newmark-β method for quantitative analysis of nonlinear vibration. The UDF program embedded in the Newmark equation was used to drive the grid to implement the coupled free vibration method for identifying bridge flutter derivatives. By comparing with the theoretical solution of the ideal flat plate flutter derivatives, reasonable suggestions were given for the parameter of the Newmark equation, and the accuracy of the method was verified by comparing with the wind tunnel test results of the Qipanzhou Yangtze River Bridge. The results show that: the flutter derivatives and critical flutter wind speed calculated by the modified coupled free vibration method have high accuracy. The numerical simulation results of the flutter critical wind speed are slightly higher than the wind tunnel test results, with the maximum error not exceeding 10%. The smaller the attack angle, the higher the simulation accuracy. The range of flutter critical wind speed can be quickly judged by observing the state vector time history. For super large span suspension bridges, when the torsional bending frequency ratio is greater than 3.5, the flutter critical wind speed will increase significantly.
Li et al. (2023a, b) took a large span pedestrian suspension bridge as an example, established a finite element model using ANSYS, and carried out dynamic characteristic analysis. Then, according to the pedestrian traffic level in the Pedestrian Bridge Design Guide (EN03-08) of Germany, different static uniform crowd densities (μ) were arranged on the sectional model to design the sectional model of the human-bridge system, and the static three-force coefficients and aerodynamic derivatives of different μ were obtained through force and vibration measurement wind tunnel tests, thereby studying the impact of μ on the static three-force coefficients and aerodynamic derivatives of the large span pedestrian suspension bridge. The results show: (1) with the increase of the number of pedestrians, both the lift and drag gradually increase, while the moment gradually decreases; (2) the crowd density has a significant impact on both the direct aerodynamic derivatives (
, , , ) and the indirect aerodynamic derivatives ( , , , ). Since the 1960s, the identification of flutter derivatives has developed many methods, and the research on flutter derivatives has been continuously enriched and improved. On the basis of previous scholars, researchers from Chang'an University have proposed a variety of new identification methods, improved the accuracy of flutter derivative identification, provided methods for judging flutter stability using flutter derivatives, and verified the correctness and reliability of the methods through examples. Bai et al. (2011) used the state-separated forced vibration method to calculate the flutter derivatives of three different streamlined bridge cross-sections. It was concluded that the flutter derivatives of the three cross-sections change basically the same trend with the increase of reduced wind speed. The flutter derivatives of different cross-sections are basically the same at low reduced wind speed, and the trend deviation becomes larger as the reduced wind speed increases. The flutter derivatives
, , , , , are not sensitive to the slight change of cross-section shape, while and are more sensitive to the cross-section shape. 5.2.2 Stiffness
As the span of bridges continues to increase, the structural characteristics of large-span bridges with low stiffness and damping make wind-induced sensitivity issues more pronounced. Stiffness plays a key role in bridge flutter, directly affecting the natural frequency and response characteristics of the structure. The stiffness of a bridge determines its vibration frequency and amplitude under external excitation.
5.2.2.1 Aerodynamic stiffness
Aerodynamic stiffness refers to the ability of a structure to resist deformation under aerodynamic forces, which is influenced by various factors, including the geometric shape of the main beam, wind speed and direction, wind attack angle, etc.
Li and Li (2020) took the suspension pedestrian overpass as a basis, first proposed and designed the cross-section model of the pedestrian overpass. Then, the influence of pedestrians on the flutter derivatives was studied through free vibration tests. The results are shown as follows. (1) As the density of pedestrians increases,
, and , will increase, leading to a decrease in positive vertical aerodynamic damping, positive vertical aerodynamic stiffness, and positive torsional aerodynamic damping. At the same time, as the density of pedestrians increases, and will decrease, which will lead to a decrease in negative torsional aerodynamic damping and negative torsional aerodynamic stiffness. (2) The side-by-side arrangement is beneficial to the positive vertical aerodynamic damping, but not conducive to the negative torsional aerodynamic stiffness. Random walking at low and medium pedestrian densities and side-by-side walking at high pedestrian densities are not conducive to vertical aerodynamic stiffness, positive vertical aerodynamic stiffness, and positive torsional aerodynamic stiffness. In addition, all pedestrian arrangements have a significant impact on torsional aerodynamic damping. According to the two-degree-of-freedom coupled flutter theory in two dimensions, the flutter analysis of the original truss section of Liujia Gorge was carried out by Kang (2011) under different attack angles. The aerodynamic stiffness of the system's vertical bending coupling motion under different attack angles is shown in Fig. 87. ![]() Figure 87. Aerodynamic stiffness (vertical axis) of the system's vertical bending induced motion at different angles of attack for the original truss cross-section. (a) −3° angle of attack. (b) 0° angle of attack. (c) +3° angle of attack.
Figure 87. Aerodynamic stiffness (vertical axis) of the system's vertical bending induced motion at different angles of attack for the original truss cross-section. (a) −3° angle of attack. (b) 0° angle of attack. (c) +3° angle of attack.5.2.3 Damping
Damping plays an important role in bridge flutter, as it is the key factor in controlling the dissipation of structural vibration energy. The presence of damping can reduce the amplitude and duration of vibrations, thereby suppressing the resonance phenomenon that may occur when the bridge is subjected to external excitation. Proper damping design can effectively reduce structural vibration response and improve the anti-flutter ability and long-term safety of the bridge. However, excessively high or low damping may have adverse effects on the vibration characteristics of the structure. Therefore, in bridge design and maintenance, the damping level should be accurately controlled and adjusted according to specific situations to ensure the stability and safety of the structure under various conditions.
5.2.3.1 Aerodynamic damping
Aerodynamic damping refers to the damping effect produced when air flows interact with the bridge cross-section. When air flows over the bridge cross-section, resistance is generated due to the viscosity and compressibility of the air, which consumes the kinetic energy of the object, thereby reducing the movement speed or vibration amplitude of the bridge structure. This energy dissipation caused by fluid dynamics effects is known as aerodynamic damping. The magnitude of aerodynamic damping is related to factors such as the aerodynamic shape of the bridge cross-section, surface roughness, and wind speed, and is an important factor to consider in bridge flutter analysis.
Bai et al. (2014) took the Humen Second Bridge as an engineering example to study the impact of various aerodynamic damping on flutter stability performance. The aerodynamic damping of the system's coupled torsional motion is determined by the aerodynamic lift moment. The aerodynamic lift moment is produced by the torsional motion on one hand, and by the coupled vertical motion caused by the aerodynamic self-excited force on the other hand. Therefore, the aerodynamic damping of the system's coupled torsional motion can be divided into the following five parts as shown in Fig. 88.
Fig. 88 shows the aerodynamic damping curve of the initial design scheme of the Humen Second Bridge. Both positive and negative aerodynamic damping increase with the increase of wind speed. At low wind speeds, the positive aerodynamic damping is larger than the negative aerodynamic damping, resulting in a more stable state. At high wind speeds, the negative aerodynamic damping increases at a faster rate with the increase of wind speed, which will gradually offset the positive aerodynamic damping. When the negative aerodynamic damping is greater than the positive aerodynamic damping, flutter instability will occur.
Based on the principle of energy equivalence, Liu et al. (2020) concluded that the pure damping items and pure stiffness items that only have a damping effect in the flutter self-excited force were identified, as well as the dual effect items that have both stiffness and damping effects. As the wind speed increases, the energy-increasing ability of the flutter self-excited force will gradually exceed the energy-consuming ability, which is the cause of flutter occurrence.
Li et al. (2022a) took the suspended double-deck closed box beam bridge deck as the research object, and studied the influence of structural static coupling and aerodynamic interference on the wind vibration performance of the suspended double-deck closed box beam bridge deck through wind tunnel tests; the variational mode decomposition method was used to decompose the test monitoring signals, identify the flutter mode; the flutter bending-torsional coupling degree and bending-torsional phase difference were analyzed through the vibration mode vector diagram and phase diagram; the flutter derivative was identified by the least squares method, and the flutter aerodynamic damping was identified based on the excitation-feedback principle. The research results show that: under the combined action of structural static coupling and aerodynamic interference, the lower deck section undergoes soft flutter inclined to vertical vibration mode under the drive of vertical vibration aerodynamic negative damping, and the soft flutter of the lower deck section induces the overall bending-torsional coupling soft flutter of the suspended double-deck bridge deck vibration system.
Based on the classic bending-torsional coupling flutter driving mechanism, the flutter of the bridge was divided into three damping driving mechanisms by Gao et al. (2022a, b): D term damping driving mechanism, X term damping driving mechanism, and X + D term damping driving mechanism. In the torsional coupling motion, the absolute values of the aerodynamic damping of items A and D are relatively large. Among them, when the structural damping A is positive and D is negative, it is called D term driving. When the D term damping is positive, the air dynamic damping item with the largest absolute value and negative value among the other four air dynamic damping items is the main driving item, called X term driving, such as A term driving. When D term and one or more of the other four air dynamic damping items are negative, it is called X + D term co-driving (the A + D-term drive), such as A + D term driving. Nine bridge examples were used to verify the rationality of this division, as shown in the table below. For D term damping flutter, an empirical judgment parameter based on ATCC was proposed for quick evaluation of bridge flutter performance, and three bridge examples were verified, as shown in Table 7. It was found that the flutter stability of the X term damping driving type is the highest, that is, the open box beam; the flutter stability of the X + D term damping driving type is the worst, that is, the H section; the flutter stability of the D term damping driving type is between the two, commonly found in closed box beam sections and truss sections. The flutter derivatives were also used to verify the correctness of this method. The research method proposed in this paper can quickly and accurately determine the flutter performance of the bridge and optimize the flutter performance of the preliminary design scheme of the bridge (Table 8).
Table 7. Futter driving term and critical flutter wind speed of different girder section types.Bridge No. Main beam section form Angle of attack (°) A D A + D Wind speed (m/s) 1 Flat steel bow girder 0 – – – – L 19.0 2 Fat steel box girder 0 + + + – M 64.4 3 Steel truss beam 0 + + + – M 66.5 4 Closed box girder 3 + + + – M 70.2 5 Closed box girder 0 + + + – M 71.3 6 Edge-box girder 0 + + + – M 82.2 7 Double-slotted bluff body 0 + + + – M 89.2 8 Double-slotted box girder 0 + + + – M 90.0 9 Slotted steel box girder 0 + – – + H 116.0 Note: L represents a low critical flutter wind speed and poor flutter stability, H represents a high critical futter wind speed and strong futter stability, M represents a situation between states L and H. Table 8. K values of aerodynamic term selection of typical cross-sectional bridges.Bridge name Bridge type Pneumatic measures Bridge section form Wind attach angle (°) Wind speed (m/s) K No.2 Suspension bridge Without pneumatic measurements Flat steel box girder 0 64.38 2.257 With pneumatic measurements 0 71.30 2.697 No.3 Suspension bridge Without diversion plate and central stabilizer Steel truss Beams 0 42.50 −0.891 With diversion plate and central stabilizer 0 66.50 −0.421 No.4 Suspension bridge Different wind barrier Closed steel box girder 0 46.80 −2.219 Different wind barrier 0 70.20 −1.284 No.7 Suspension bridge Without diversion plate Slotted steel box girder 3 87.10 −0.0957 With diversion plate 3 88.70 −0.0744 No.9 Cable-stayed bridge With wind barrier Slotted steel box girder 0 100.65 −0.235 Without wind barrier 0 116.00 −0.178 Aerodynamic damping and aerodynamic stiffness are the main reasons for the flutter instability of bridge structures. For example, A item aerodynamic positive damping is beneficial to the stability of the system, while D item aerodynamic negative damping is the cause of the system's flutter instability. Currently, the study of aerodynamic damping and aerodynamic stiffness is still a hot issue in flutter stability analysis and mechanism explanation. Many scholars have also begun to pay attention to the nonlinear effects of aerodynamic damping and aerodynamic stiffness, and the related analysis is gradually deepening.
5.3 Flutter critical wind speed
When the wind speed exceeds the flutter critical wind speed of the bridge structure, flutter instability will occur, which is highly destructive to the bridge structure. Therefore, the impact of flutter must be considered in the analysis of large-span bridges.
5.3.1 Influencing factors
Flutter critical wind speed is influenced by various factors, including bridge aerodynamic shape, structural natural frequency, and damping.
5.3.1.1 Aerodynamic shape
The flutter phenomenon of bridge structures is a typical aerodynamic coupling phenomenon. Different bridge-flow coupling resonance systems have different flutter critical wind speeds due to different aerodynamic shapes.
5.3.1.1.1 Main beam
The commonly used main beam forms for large-span bridges mainly include integrated box beams, split box beams, double-sided main beams, and truss beams, as shown in Fig. 89. For the four most common types of main beams in large-span bridges (double-sided main beams, integrated box beams, split box beams, and truss beams), a detailed introduction was given by Zhao et al. (2019a) on the optimization ideas for improving the flutter and vortex-induced-vibration performance of the main beams with passive aerodynamic control measures. Based on the shape and position optimization principles of aerodynamic accessories (stabilizers, grilles, wind barriers, fins, diverters, skirts, guide plates, and baffles, etc.). Recommendations were made for the size setting of additional components considering the inherent shape of the main beam (main beam slots, groove chamfers, designed wind fairings, adjustment of railings, and inspection track forms) as illustrated in Fig. 89. The research results can provide references and insights for aerodynamic typing in the preliminary design stage of large-span bridge main beams.
For integrated box beams, the width-to-height ratio is the main factor affecting the aerodynamic shape and characteristics. Based on a double-span suspension bridge with a main span of 738 m, UDF programs were secondarily developed by Chang (2018) based on computational fluid dynamics software (CFD) to numerically simulate the flutter critical wind speed. To verify the accuracy of the numerical simulation method, wind tunnel tests were conducted on sectional models for comparative studies. After comparison, it was found that as the width-to-height ratio of the closed steel box beam cross-section increased, the flutter critical wind speed increased.
For split box beams, i.e., centrally slotted beams, they have excellent aerodynamic stability and higher flutter critical wind speeds. To reveal the influence of the basic aerodynamic shape of the main beam on the flutter performance of suspension bridges, a large-span suspension bridge was taken by Wu et al. (2024) as an example, and three typical cross-sections, including streamlined box, side box, and split dual-box, were selected as the basic aerodynamic shapes of the main beam of the bridge. Through analysis, the flutter critical wind speed diagrams corresponding to each cross-section are shown in Fig. 90 below.
For double-sided rib main beams, they have advantages such as good load-bearing performance, simple hoisting, and low cost, and are commonly used in large-span cable-stayed bridges and suspension bridges. Zhang et al. (2021) took a certain type of cross-section bridge as the object, and through elastic suspension sectional model wind tunnel tests, identified the nonlinear evolution characteristics of mechanical damping with amplitude. For truss beams, Zhang et al. (2022) took a suspension bridge with a main span of 1100 m and a truss-stiffened beam as the engineering basis, and used the elastic suspension sectional model wind tunnel test method to study the post-flutter characteristics and mechanisms of the truss beam. Truss beam sectional model flutter tests were conducted at different wind attack angles, and the results showed that under each test wind attack angle, the truss beam sectional model exhibited limit cycle oscillation (LCO) in the post-flutter state, characterized by quasi-harmonic torsional vibration, with slight bending-torsional coupling effects. The critical flutter wind speed and the slope of the amplitude increase with wind speed under various wind attack angles have a significant impact.
Yan (2023) studied H-shaped hangers, which are lightweight, structurally flexible, have low damping ratios, and their relatively blunt aerodynamic shape leads to significant flow separation, making them highly susceptible to natural wind action within a 0°–360° wind direction angle. Based on the sectional model test results of the H-shaped hanger, it was found that the structural damping ratio and structural mass have a significant impact on the wind-induced vibration characteristics of the H-shaped hanger model (Fig. 91). An increase in the damping ratio further delays the onset of torsional flutter at a 40° wind direction; increasing the structural damping ratio or setting up a turbulent wind field can effectively suppress the occurrence of torsional soft flutter at a 30° wind deflection angle, and improve the aerodynamic stability of the H-shaped hanger aeroelastic model. Wing plate hole opening rates of 24.9% can significantly eliminate flutter instability at a 30° wind direction and improve the aerodynamic stability of the H-shaped hanger.
![]() Figure 91. Illustration of wing plate single opening amplitude-wind speed curve of wind direction of 40° with different damping ratio.
Figure 91. Illustration of wing plate single opening amplitude-wind speed curve of wind direction of 40° with different damping ratio.5.3.1.1.2 Auxiliary components
Auxiliary components are important components to ensure the specific functions of the bridge. The reasonable use of the form and setting method of auxiliary components can also play a role in improving the flutter performance of the bridge. The Chang'an University Wind Tunnel Laboratory first discovered in 2012 that the optimization of auxiliary components such as bridge deck crash barriers and maintenance walkway barriers can improve the wind-induced vibration performance of the bridge. The closed form of side crash barriers and pedestrian walkway barriers has a great influence on the vortex-induced-vibration and flutter stability performance of the bridge. Bai et al. (2020) compared the influence of several different closed forms of barriers on wind-induced vibration performance, as shown in Figs. 92 and 93. The results show that when the air permeability of side crash barriers and pedestrian walkway barriers remains unchanged, the side crash barriers and pedestrian walkway barriers with arc-shaped closed forms cannot achieve good vibration suppression effects.
![]() Figure 92. Schematic diagram of side traffic barrier and sidewalk handrail optimization countermeasures (unit: mm). (a) Schematic diagram of arc-shaped sealing for the side traffic barrier. (b) Schematic diagram of sidewalk traffic barrier optimization. (c) Schematic diagram of the sealed sidewalk traffic barrier measure.
Figure 92. Schematic diagram of side traffic barrier and sidewalk handrail optimization countermeasures (unit: mm). (a) Schematic diagram of arc-shaped sealing for the side traffic barrier. (b) Schematic diagram of sidewalk traffic barrier optimization. (c) Schematic diagram of the sealed sidewalk traffic barrier measure.![]() Figure 93. Section model of side traffic barrier and sidewalk handrail countermeasures. (a) Arc-shaped sealing for the side barrier. (b) Arc-shaped sealing for sidewalk traffic barrier. (c) Side traffic barrier for the section model of Chongqing Hechuan Bridge. (d) Sidewalk traffic barrier for the section model of Chongqing Hechuan Bridge.
Figure 93. Section model of side traffic barrier and sidewalk handrail countermeasures. (a) Arc-shaped sealing for the side barrier. (b) Arc-shaped sealing for sidewalk traffic barrier. (c) Side traffic barrier for the section model of Chongqing Hechuan Bridge. (d) Sidewalk traffic barrier for the section model of Chongqing Hechuan Bridge.Bai et al. (2013b) showed that canceling the upper central stabilizer and closing part of the crash barrier can achieve the effect of the upper central stabilizer, and the flutter critical wind speed at different attack angles has improved (Fig. 94). For different crash barrier closure methods, such as Plan Ⅰ and Plan Ⅱ, reducing the air permeability of the crash barrier can increase the flutter critical wind speed at negative attack angles, but will reduce the flutter critical wind speed at positive attack angles. Comparing Plan Ⅱ with Plan Ⅲ: keeping the crash barrier closure method unchanged and reducing the height of the crash barrier, the flutter stability will decline slightly. After comprehensive comparison, Plan Ⅱ is the optimal aerodynamic measure scheme for Liujia Gorge Truss Suspension Bridge (Fig. 94).
![]() Figure 94. Schemes of the crash barrier closed (unit: mm). (a) Plan Ⅰ. (b) Plan Ⅱ. (c) Plan Ⅲ.
Figure 94. Schemes of the crash barrier closed (unit: mm). (a) Plan Ⅰ. (b) Plan Ⅱ. (c) Plan Ⅲ.5.3.1.2 Frequency
The smaller the structural stiffness, the lower the frequency, the more likely it is to flutter. Among the four major bridge structures of beam bridges, arch bridges, cable-stayed bridges, and suspension bridges, suspension bridges have the smallest structural stiffness and are most prone to flutter problems. Hao et al. (2020) studied the flutter stability of large-span asymmetric suspension bridges under different types of asymmetries with a certain main cable unequal height support suspension bridge with a main span of 628 m as the engineering background. Based on the full modal three-dimensional frequency domain flutter analysis method, the suspension bridge was analyzed for flutter stability. The results showed that: when constructing an unequal height support suspension bridge, as the support height difference increases, the low-order modal frequency changes are small, and the high-order modal range gradually decreases; the bending-torsion frequency ratio decreases with the increase of the support height difference, and the larger the height difference, the faster the bending-torsion frequency ratio decreases; the flutter critical wind speed of the bridge decreases with the increase of the support height difference, making the non-symmetric structure form caused by the main cable unequal height support height difference have a negative impact on the flutter stability of large-span suspension bridge structures; when constructing a side span asymmetric suspension bridge, the bending-torsion frequency ratio decreases as the side span difference increases; as the support span difference continues to increase, the flutter critical wind speed of the suspension bridge structure continues to decrease, but the decrease is very small, and the impact is not significant, and can be almost ignored when the side span difference is small (Fig. 95).
![]() Figure 95. Flutter stability of long-span asymmetric suspension bridges under different types of asymmetries. (a) Asymmetrical suspension bridge with unequal height of main cable support. (b) Variation of bending-torsion frequency ratio with support height difference. (c) Variation of flutter critical wind speed with support height difference. (d) Side-span asymmetric suspension bridge. (e) Variation of bending-torsion frequency ratio with side span difference. (f) Variation of flutter critical wind speed with side span difference.
Figure 95. Flutter stability of long-span asymmetric suspension bridges under different types of asymmetries. (a) Asymmetrical suspension bridge with unequal height of main cable support. (b) Variation of bending-torsion frequency ratio with support height difference. (c) Variation of flutter critical wind speed with support height difference. (d) Side-span asymmetric suspension bridge. (e) Variation of bending-torsion frequency ratio with side span difference. (f) Variation of flutter critical wind speed with side span difference.5.3.1.3 Damping
Aerodynamic damping and structural damping are two parts of the wind-induced vibration damping of the bridge, where aerodynamic damping focuses on the energy loss caused by the interaction between air and solid, and structural damping focuses on the energy dissipation of the bridge structure itself.
5.3.1.3.1 Structural damping
Structural damping refers to the energy dissipation phenomenon of the bridge structure itself during vibration, due to internal friction, viscoelastic effects, and other factors. Structural damping originates from within the structure and is closely related to the physical properties of materials and structural forms. The magnitude of structural damping is usually described by the dimensionless parameter damping ratio.
Bai et al. (2012a) took the Gansu Liujia Gorge Bridge as the research object and studied the impact of structural damping on bridge flutter derivatives and critical wind speed through a series of section model vibration tests. As shown in Figs. 96 and 97, the results show that the changes in vertical bending and torsional damping ratios have no obvious regular impact on the 8 flutter derivatives but have a greater impact on the critical wind speed at 0° and −3° wind attack angles.
![]() Figure 96. The influence of the vertical bending and torsion damping ratios on the flutter derivative (0° angle of attack). (a)
Figure 96. The influence of the vertical bending and torsion damping ratios on the flutter derivative (0° angle of attack). (a). (b) . (c) . (d) . (e) . (f) . (g) . (h) . Wang et al. (2021c) studied the flutter amplitude, frequency, and limit cycle characteristics of the box girder section through wind tunnel tests, verified the reliability of the self-excited force model through numerical calculations, and based on the self-excited force model with step function, numerically simulated the flutter of the box girder section. The results show that the flutter critical wind speed of the box girder increases almost linearly with the damping ratio. By pointing out the dependence of structural damping characteristics, the shortcomings of the existing Chinese bridge specifications are pointed out.
5.3.1.3.2 Aerodynamic damping
Aerodynamic damping refers to the damping effect produced when air flows interact with the bridge cross-section. When air flows over the bridge cross-section, resistance is generated due to the viscosity and compressibility of the air, which consumes the kinetic energy of the object, thereby reducing the movement speed or vibration amplitude of the bridge structure. This energy dissipation caused by fluid dynamics effects is known as aerodynamic damping. The magnitude of aerodynamic damping is related to factors such as the aerodynamic shape of the bridge cross-section, surface roughness, and wind speed, and is an important factor to consider in bridge flutter analysis.
Yang et al. (2007) used the two-dimensional three-degree-of-freedom coupled flutter analysis method established for flutter mechanism research as a theoretical tool. Bai et al. (2014) used the theoretical analysis method to give a simplified expression for the system's associated torsional motion damping ratio that affects the flutter stability of the bridge. The flutter derivatives were calculated using the Fung formula, and the flutter derivatives were calculated using the Scanlan formula. The smaller the product of the lift coefficient slope and the moment coefficient slope of the main beam cross-section, the more favorable it is for the flutter stability of the bridge; when the flutter derivative is negative, it is beneficial to reduce the aerodynamic negative damping and play a stabilizing role for the structure.
5.3.1.4 Turbulence characteristics
The large attack angle non-uniform incoming wind in mountainous areas poses a great challenge to the wind-resistant design of large-span bridges. With the increasing number of mountainous bridges, the aerodynamic characteristics of bridges in non-uniform wind fields, especially flutter stability, are worth considering. By comparative analysis from Xing et al. (2023), the influence of amplitude and other parameter on the accuracy of flutter derivative identification was studied, and the recommended values for each parameter were given. The flutter response of bridges in three typical non-uniform attack angle wind fields (linear, cubic parabolic line distribution, and quadratic parabolic line distribution) was analyzed, and the influence of characteristic parameter on the critical flutter wind speed was determined (Fig. 98). The results show that the span center is a sensitive area for attack angles, and taking the maximum attack angle as a reference is too conservative, while taking the average attack angle is sometimes dangerous. Based on the response equivalence principle, appropriate attack angle reference values can be used to simplify the three non-uniform wind fields, which can provide references for the wind-resistant design of mountainous bridges.
Li et al. (2023c) conducted research on the impact of non-uniform inflow on structural aerodynamic stability, first summarizing the non-uniform wind speed distribution model, and then setting the research conditions based on it. Simply supported beam bridges and suspension bridges were studied as research objects to explore the flutter response of the two bridges under the set conditions and make similarity comparisons. The analysis results show that non-uniform wind speed will reduce the flutter stability of the bridge, so the non-uniformity of wind speed cannot be completely ignored in wind-resistant design. As shown in Fig. 99, the degree of influence of wind speed non-uniformity on the flutter stability of the structure does not change with the change of attack angle, which can be used to simplify the wind-resistant design of the beam under non-uniform inflow conditions.
The Chang'an University Wind Tunnel Laboratory has found in recent years that for bluff body main beam cross-sections, appropriately introducing turbulence generation devices to produce characteristic turbulence on the surface of the bridge, using characteristic turbulence to interfere with the flow field around the main beam cross-section, and thereby achieving the purpose of suppressing periodic vortex shedding and improving flow field characteristics, thus improving the wind resistance performance of the bridge. This kind of turbulence generation device has been successfully applied in several large-span suspension bridges such as Longmen Bridge and Xunjiang Bridge in China. The research on the mechanism of using turbulence to suppress vibration is also in progress. The core is to use the mutual interference of coherent flow and background flow to achieve the purpose of vibration suppression. Coherent structures (or pseudo-order structures) refer to some sequences of large-scale motion that exist in the turbulent fluctuation field. They are triggered at uncertain times and places, but once triggered, they develop in a certain sequence. This discovery is a major breakthrough in turbulence research because it shows that turbulence is not as completely irregular as imagined by classical theory, but there are several orderly large-scale motions in the small-scale irregular background fluctuations. Among these, the small-scale irregular background fluctuations are called background flow, and the several orderly large-scale motions are called coherent flow. Based on the dimensionless size of the bridge cross-section, find a suitable range, and when the vortex scale reaches a certain parameter, it is called coherent flow. Classify the coherent flow of different scales and study the scale and proportion of each scale when it will excite the vibration of the bridge structure.
5.3.2 Flutter types
Flutter can be divided into hard flutter and soft flutter according to whether there is an obvious flutter critical point, as shown in the wind tunnel test results of a certain bridge; when the wind speed exceeds the flutter critical wind speed of the bridge, if the amplitude increases rapidly and diverges, this kind of vibration is called hard flutter; if the actual situation exists without a flutter critical point, the amplitude increases slowly with the increase of wind speed or maintains a large amplitude with the increase of wind speed, this kind of vibration is called soft flutter. The difference is shown in Fig. 100.
5.3.2.1 Hard flutter
The bridge wind-resistant design specification is based on the classic linear flutter theory, which uses linear flutter derivatives to describe the complex interaction between the bridge cross-section and the air flow around it and can effectively predict the critical wind speed and provide a reasonable explanation for the flutter mechanism. The flutter predicted by the linear flutter theory is a sudden hard flutter, that is, when the wind speed exceeds a certain critical point (flutter critical wind speed), the amplitude will increase exponentially over time and produce linear instability.
Wang et al. (2020b) proposed a method for quickly evaluating and optimizing the flutter stability of typical flat box beams for large-span bridges. By comparing experimental data and numerical data, a method for quickly evaluating and optimizing work was proposed. It is feasible to predict the effect of flutter suppression measures through numerical analysis.
In the preliminary design stage of large-span bridges, many bridge deck schemes need to be verified for flutter stability through wind tunnel tests, which consume a lot of time and money. Therefore, Li et al. (2022b) studied a method for quickly predicting the flutter critical wind speed (FCWS) of the bridge deck, and then selecting schemes with better aerodynamic performance for further wind tunnel tests. First, taking the streamlined box beam as the research object, the relationship between the air static force coefficient and flutter stability was derived, proving that the air static force coefficient can be used to assess the flutter stability of streamlined box beams. Second, through wind tunnel tests, a sample database containing 315 sets of test data was obtained, and an artificial neural network (ANN) was established. Finally, the ANN was combined with CFD software to propose a program for quickly evaluating the flutter stability of streamlined box beams. Taking a certain large-span bridge as an example, the force surface of each scheme was predicted using the proposed method, and schemes with better aerodynamic performance were selected. By comparing the predicted results with the test results, it was found that 1) the proposed method can reasonably select schemes with better aerodynamic performance for streamlined box beams for further wind tunnel tests, avoiding unnecessary tests and improving work efficiency, 2) combined with ANN, the aerodynamic performance of streamlined box beams can be evaluated using static force coefficients.
5.3.2.2 Soft flutter
The classical linear flutter theory is only applicable to small amplitudes and cannot consider the nonlinear effects of self-excited forces when the bridge section vibrates with large amplitudes. Due to the nonlinear effects of flutter self-excited forces, when a bridge flutters, in most cases, it does not diverge rapidly but instead exhibits different stable amplitudes at different wind speeds, with the amplitude increasing slowly with the increase of wind speed. This phenomenon is referred to as "soft flutter" by the academic community.
Zhu and Gao (2016) used the sectional model with spring suspension to measure the vibration and studied the soft flutter response of the double-sided rib bridge section. Soft flutter occurs within the torsional mode, mainly characterized by single-degree-of-freedom torsional vibration, with weak bending-torsional coupling effects. Then, a nonlinear self-excited force model for double-sided rib soft flutter was provided.
$$ \begin{aligned} & J\left[\ddot{\alpha}+2 \omega_0 \xi_s(\rho) \dot{\alpha}+\left(\omega_s^2(\rho)+\omega_0^2\right) \alpha\right] \\ & =\frac{1}{2} \rho_{\alpha \mathrm{ir}} U^2\left(2 B^2\right)\left[K A_2^*(K, \rho) \frac{\dot{B \alpha}}{U}+K^2 A_3^*(K, \rho) \alpha\right] \end{aligned} $$ (22) where
is the air density, is the reduced frequency, which is the reciprocal of the reduced wind speed , is the torsional vibration frequency at the current wind speed; and are obtained from the dimensionless nonlinear aerodynamic damping and dimensionless nonlinear aerodynamic stiffness coefficients , respectively, is the fundamental frenquence and J is the moment of inertia, and are the flutter derivatives considering the amplitude effect. The flutter derivatives are expanded as a function of the instantaneous torsional amplitude to account for the nonlinear effects of the self-excited forces. The parameter identification results show that the nonlinearity of the self-excited forces is mainly manifested as the nonlinear effect of aerodynamic damping, while the nonlinearity of aerodynamic stiffness is weaker. By comparing the calculated values and test values of the soft flutter response, the reliability of the self-excited force model and parameter identification results were preliminarily verified. The mechanism of soft flutter was discussed based on the relationship between aerodynamic damping and structural damping changing with instantaneous amplitude. The results are shown in Figs. 101 and 102. Through a series of spring-suspended sectional model (SSSM) tests, the nonlinear aerodynamic-elastic behavior of the box girder section after flutter was studied by Gao et al. (2018b). When the reduced wind speed exceeds the linear aerodynamic-elastic limit, the sectional model exhibits obvious limit cycle oscillation (LCO), characterized by quasi-harmonic torsional vibration with slight bending-torsional coupling effects. The stable amplitude of LCO after flutter increases roughly linearly with the decrease of wind speed. Nonlinear self-excited forces (NSEF) were measured using a high-frequency dynamic balance, and their effectiveness was verified by comparing the calculated post-flutter response with the experimental results. The measured NSEF contains significant second and third-order nonlinear harmonic components. Based on the measured NSEF signals and the principle of equivalent energy, an NSEF model suitable for large amplitudes was proposed, and its effectiveness was verified by comparing its predicted response with the experimental results (Fig. 103). The identified aerodynamic parameter further indicate that the occurrence mechanism of flutter after LCO is due to the negative aerodynamic damping provided by the linear term as the energy source driving the amplitude increase, while the nonlinear positive aerodynamic damping provided by the third-order angular velocity term acts as a stabilizing factor for the self-limiting phenomenon.
![]() Figure 103. Comparison of the experimental RMS of torsional angle and the calculated results from cross/self-validation cases during stable post-flutter LCO.
Figure 103. Comparison of the experimental RMS of torsional angle and the calculated results from cross/self-validation cases during stable post-flutter LCO.Aiming at the nonlinear characteristics of soft flutter for large-span bridges, spring-suspended sectional model wind tunnel tests were used to study the soft flutter response of typical flat box girder sections under uniform flow fields by Gao et al. (2019). A new type of high-precision force measurement technology-built-in balance synchronous force and vibration measurement method was used to measure the nonlinear flutter self-excited force time history, which can greatly reduce the inertial force component in the balance signal and improve the measurement accuracy of self-excited forces.
In response to the soft flutter phenomenon of large-span bridges after flutter, a soft flutter Pushover analysis method for large-span bridges based on wind tunnel test methods and seismic Pushover analysis ideas was proposed by Gai (2019). Starting from the structural plastic limit under nonlinear vibration, the ultimate amplitude after flutter, refined soft flutter critical wind speed, and the failure mode of the bridge after flutter were estimated through nonlinear static plastic analysis. An improved soft flutter pushover analysis method was proposed, and taking a streamlined box girder large-span suspension bridge as the engineering background, sectional model wind tunnel tests were carried out to obtain typical large-span bridge soft flutter responses, and the bending-torsional coupling limit cycle vibration characteristics were analyzed and studied to determine the key calculation parameter for soft flutter pushover analysis. Based on the structural linear elastic limit, a critical wind speed judgment criterion after flutter was proposed, and the soft flutter critical wind speed of the example bridge was judged according to the nonlinear static analysis results, which precisely determined the fuzzy soft flutter critical wind speed recommended in the specification, and predicted the failure location and weak links of the example bridge after flutter through calculation.
Through two-degree-of-freedom sectional model tests of typical flat closed box girders, experimental studies on nonlinear post-flutter instability were conducted by Gao et al. (2020c). Laser displacement sensors and high-frequency dynamic balances were used to synchronously measure dynamic displacement and aerodynamic forces. A significant coupling between vertical static deformation and large-amplitude post-critical LCO was observed, rendering the classical quasi-steady theory inapplicable. A novel wind tunnel technique was employed, using four high-frequency dynamic balances to measure aerodynamic torque and lift during post-critical LCO. The measured force signals contained significant higher-order components. The hysteresis loop of the measured force signals revealed the energy evolution mechanism during post-critical LCO. Gao et al. (2020a) also proposed to describe the aerodynamic nonlinearity during soft flutter of bridge sections with moderate aspect ratios. In this study, the empirical model was improved and extended to the torsional vortex-induced-vibration and nonlinear flutter of general bluff bodies, especially flat bridge decks that are more common in large-span bridges. In the empirical model, the aerodynamic nonlinear damping effect is modeled by a cubic velocity term, and its applicability was verified through a series of flat double-sided beam bridge sectional model tests. The results show that the proposed empirical model is suitable for predicting the stable amplitude of torsional vortex-induced-vibration and nonlinear flutter. It was found that during the development of LCO, the nonlinear damping mechanism of torsional vortex-induced-vibration and soft flutter is the same.
Taking the suspended double-deck closed box girder bridge deck as the research object, the wind-induced vibration performance of the suspended double-deck closed box girder bridge deck was studied through wind tunnel tests by Li et al. (2022a). The influence of structural static coupling and aerodynamic interference on the wind vibration performance of the suspended double-deck closed box girder bridge deck was studied. The variational mode decomposition method was used to decompose the test monitoring signals, and the flutter mode was identified. The bending-torsional coupling degree and bending-torsional phase difference of flutter were analyzed through the vibration mode vector diagram and phase diagram. Based on the least squares method, the flutter derivatives were identified, and the flutter aerodynamic damping was identified based on the excitation-feedback principle. It can be seen that for the suspended double-deck closed box girder bridge deck, the lower deck section undergoes soft flutter inclined to vertical vibration mode under the drive of negative aerodynamic damping of vertical vibration, and the soft flutter of the lower deck section induces the overall bending-torsional coupling soft flutter of the suspended double-deck bridge deck vibration system. The results are presented in Fig. 104.
![]() Figure 104. Predominant frequencies and corresponding amplitudes of double-deck section. (a) Upper section. (b) Lower section.
Figure 104. Predominant frequencies and corresponding amplitudes of double-deck section. (a) Upper section. (b) Lower section.Based on wind tunnel tests and numerical simulations, the flutter performance of suspended double-deck flat box girders was studied by Hong et al. (2023). The flutter performance of suspended double-deck flat box girders was analyzed through modal decomposition, cross-sectional distribution pressure, and flow field modal. The research results show that for suspended double-deck bridges, under the aerodynamic interference of the upper deck, the lower deck undergoes soft flutter inclined to vertical vibration mode. In the process of wind tunnel test sectional model parameter design, the vibration parameter of the lower deck were designed by self-simulation, which is still somewhat different from the actual situation of the large-span suspension bridge with suspended double-deck section.
5.3.3 Numerical simulation
5.3.3.1 Flutter derivatives
For streamlined bridge deck flutter stability, a UDF program was compiled by Bai et al. (2011) to achieve the structural state-separated forced vibration method, and stable aerodynamic forces were extracted to obtain the flutter derivatives at different reduced wind speeds by the least squares method. The eight flutter derivatives of the ideal thin plate were studied, and the numerical calculation results were compared with the Theodorsen theoretical solution. The calculation results are shown in Fig. 105, where the solid line is the Theodorsen flat plate theoretical solution, and the solid points are the flutter derivatives calculated by CFD at different reduced wind speeds. The results show that the flutter derivatives identified by the state-separated forced vibration method match well with the theoretical solution. Fig. 105 shows a set of simulated results by the authors.
![]() Figure 105. Flutter derivatives of the ideal thin plate and numerical simulation results. (a)
Figure 105. Flutter derivatives of the ideal thin plate and numerical simulation results. (a). (b) . (c) . (d) . (e) .(f) .(g) .(h) . From the study of Zhang (2015a), the flutter derivatives of the main beam section with wind fairing were identified through wind tunnel tests and numerical simulation, and the results were compared. The four main flutter derivatives matched well, while the four secondary flutter derivatives showed some differences in individual conditions, but overall, the numerical algorithm in this paper can be used to identify the flutter derivatives of the main beam section. The main beam sections with four size factors were calculated numerically to study the influence of the size factor on the flutter derivatives. The results show that under different wind attack angles and wind speeds, the influence on each flutter derivative is different, and the variation of each flutter derivative with the size factor should be considered in combination with the wind attack angle and incoming wind speed.
Based on the sectional model bending-torsion coupling free vibration test, a weighted least squares (WLS) iteration method for identifying bridge deck flutter derivatives was proposed by introducing a weighting matrix into the existing least squares iteration method from Li et al. (2017b). A sectional model simulation system was designed to compare the WLS method with existing methods, and the test results verified that the WLS method has better identification accuracy and computational efficiency. A comparison of the results are given in Figs. 106 and 107. Finally, a flutter derivative identification program was developed in MATLAB language and applied to wind tunnel tests. The correctness and reliability of the method were verified by comparing the wind tunnel test results obtained by different identification methods.
![]() Figure 107. Identified results of flutter derivatives of 0.9 times initial conditions.
Figure 107. Identified results of flutter derivatives of 0.9 times initial conditions.Based on the two-dimensional rigid sectional model wind tunnel test, the accuracy of the flutter derivatives obtained by the three commonly used turbulence models was compared by Li (2018), and the turbulence model with higher calculation accuracy for the box girder section was obtained. Based on this turbulence model, a database of flutter derivatives for the box girder section was established, and the influence of the geometric parameter of the box girder section on the flutter derivatives was studied. Based on this database, a method for predicting the flutter derivatives of the box girder section using a neural network was established for the first time, providing a new way for rapid acquisition of flutter derivatives in the preliminary design stage of bridges. The flutter derivatives were identified based on the sectional model wind tunnel test results, and the flutter derivatives obtained by using RNG k-ε model, SST k-ω model, and RSM were compared. The flow lines around the section obtained by the three turbulence models were analyzed to prove that RSM is more suitable for the numerical calculation of the flutter derivatives of the box girder section. The neural network was trained based on the database of flutter derivatives and successfully predicted the flutter derivatives of the box girder section. Based on various error evaluation methods, it was proven that the prediction accuracy of the neural network reached a satisfactory level. This method is conducive to improving the efficiency of estimating flutter derivatives and flutter critical wind speeds in the preliminary design stage of bridges. It was found that the back propagation (BP) neural network has stronger adaptability than the RBF neural network for such problems with significant nonlinear effects. Tables 9-11 show the obtained flutter derivatives considering wind attack angles of −3°, 0°, and +3°, respectively, and Table 12 gives the error of calculation results relative to wind tunnel test results.
Table 9. Errors in flutter derivative identification or prediction at −3° wind attack angle.Identification or prediction method RSM 0.0362 0.0126 0.2607 0.0802 0.3370 0.4669 0.0959 1.0166 BP ANN 0.0330 0.0120 0.2584 0.0701 0.3410 0.4590 0.1019 1.0983 RBF ANN 0.0746 0.0067 0.2099 0.0773 0.6084 0.4243 0.2064 1.1032 Table 10. Errors in flutter derivative identification or prediction at 0° wind attack angle.Identification or prediction method RSM 0.0503 0.0166 0.0964 0.1136 0.4414 1.1756 0.9591 0.5940 BP ANN 0.0584 0.0166 0.1417 0.1148 0.4973 1.1964 0.9506 0.5746 RBF ANN 0.0716 0.0350 0.0774 0.1511 0.4956 1.0517 0.9897 0.7379 Table 11. Errors in flutter derivative identification or prediction at +3° wind attack angle.Identification or prediction method RSM 0.0957 0.0609 0.0485 0.1417 0.2223 0.0945 0.1392 0.4147 BP ANN 0.0941 0.0637 0.0431 0.1391 0.2320 0.1040 0.1237 0.4470 RBF ANN 0.1323 0.0428 0.0599 0.2088 0.4239 0.2425 0.2500 0.4171 Table 12. Comparison of model flutter critical wind speed calculations.Flutter critical wind speed Error of calculation results relative to wind tunnel test results Wind attack angle +3° 0° −3° +3° 0° −3° Wind tunnel test 18.1 20.5 21.1 – – – RSM 23.9 23.0 26.1 32.04% 12.20% 23.70% BP ANN 22.6 23.2 24.7 24.86% 13.17% 17.06% RBF ANN 25.2 16.7 22.1 39.23% −18.54% 4.74% Starting from the wind tunnel test data, the main factors affecting flutter stability were analyzed, the parameter needed for formula fitting were explained, and the mathematical model needed for formula fitting was selected by Zhang (2018). Based on the relationship between the bending-torsion frequency ratio and the reduced wind speed in the nomogram, two undetermined coefficients were obtained, and the other three undetermined coefficients were obtained by the principle of least squares. Using CFD numerical simulation, the effects of the flat box girder width-height ratio and the inclined angle of the diagonal web on flutter stability were considered, and the effect of the width-height ratio on flutter stability was incorporated into the calculation formula. Finally, a specific bridge example was used for verification, proving that the calculation formula has a certain degree of accuracy. The effects of changes in aerodynamic derivatives on flutter stability were analyzed. The well-trained BP neural network was used to predict the flutter critical wind speed of the Qipanzhou Yangtze River Bridge, and the prediction results have a certain degree of accuracy.
From the research of Liu et al. (2020), the Scanlan linear flutter self-excited force was divided into pure damping effect items, pure stiffness effect items, and dual effect items that have both stiffness and damping effects. The flutter self-excited force was integrated to calculate the working time of the damping effect item and the no-work time of the stiffness effect item, and the classical coupled flutter driving mechanism was studied from the perspective of functionality. Finally, by transforming the coupled flutter differential equation into a functional equation form, a flutter derivative identification method based on the instantaneous work of the self-excited force was proposed and proven to be reliable.
5.3.3.2 Forced vibration method to determine critical wind speed
The forced vibration method simulates external excitation, causing the structural model to vibrate at a series of selected frequencies and amplitudes, and measuring the aerodynamic force response of the structure. Bai et al. (2011) employed numerical simulation methods to calculate the flutter derivatives and critical wind speeds of sections with a wind attack angle of 45°, 90°, and section width-to-height ratios of 8, 10, and 12 under a 0° wind attack angle. It has been discussed that the influence mechanism of aerodynamic damping, aerodynamic stiffness, and other parameter on the flutter stability performance of streamlined double main beam cross-sections of bridges. Identifying the sensitive areas affecting the flutter stability performance of the bridge, which facilitates the targeted setting of aerodynamic measures to improve the flutter stability performance of streamlined double main beam cross-sections of bridges, the surface of the double main beam was divided into zones. By integrating the surface pressure, the contribution of different zone pressures to the lift moment and flutter form was studied to find the areas with greater impact. The surface pressure characteristics of the streamlined double main beam cross-sections with wind attack angles of 45° and 90° were analyzed using the proper orthogonal decomposition (POD) method, and by comparing the contribution rates of each mode, the main reasons for inducing flutter instability modes were identified.
Taking a large-span asymmetrically supported suspension bridge as the research background, CFD numerical simulation was used to identify the flutter derivatives of the main beam cross-section by Shu (2021). Based on the frequency domain full modal method, a corresponding three-dimensional flutter analysis program was developed to analyze the impact of different asymmetric structures on the critical wind speed of flutter; based on CFD numerical simulation, the aerodynamic shape parameter of the main beam cross-section were studied for optimization of flutter performance analysis. After comparing with the results measured in the experiment (Fig. 108), the analysis results showed that the overall trend of the experimental results and the numerical simulation identification of flutter derivatives is consistent with the variation of the scaled wind speed, and the error is relatively small; the numerical simulation identification fitting calculation results of the flutter critical wind speed have an error of no more than 7% compared with the experimental results, and the calculation results are also quite reliable. The results of numerical simulation identification also provide interpolation of flutter derivatives for the subsequent three-dimensional flutter analysis of asymmetric suspension bridges.
![]() Figure 108. Comparison of numerical simulation results and experimental results for main beam flutter derivatives. (a)
Figure 108. Comparison of numerical simulation results and experimental results for main beam flutter derivatives. (a). (b) . (c) . (d) . 5.3.3.3 Free vibration method to determine critical wind speed
The free vibration method allows the structure to vibrate freely after an initial disturbance and determines the flutter critical wind speed by observing its vibration decay characteristics. Hong (2012) took the thin plate as the research object, identified the flutter derivatives of the thin plate by the separated state method and the coupled state method, and compared the identified flutter derivatives with the flutter derivatives identified by the forced vibration method and the Theodorsen flutter derivative theoretical solution of the ideal thin plate. The comparison shows that the flutter derivatives identified by the separated state method and the coupled state method have a small difference from the flutter derivatives identified by the forced vibration method and the ideal thin plate flutter derivative theoretical solution, thus verifying the accuracy and feasibility of the separated state method and the coupled state method for identifying flutter derivatives.
Through the actual analysis of a single-degree-of-freedom simulation test, the characteristics of several methods are compared by Zhang (2016), and their unsuitable aspects for direct application to the identification of bridge section flutter derivatives are analyzed. A practical method for cutting practical effective data based on the envelope line method of time history curve and random sampling consensus (RANSAC) algorithm was proposed for the problem of the difference between actual collected data and effective data in the test. Based on MATLAB language, several calculation modules corresponding to the methods proposed in this paper were compiled to develop a complete set of visualizable flutter derivative identification programs as illustrated in Fig. 109, which were applied to the sectional model wind tunnel test to improve the identification accuracy and efficiency of flutter derivatives.
The performance of the free coupled vibration method in actual engineering was discussed by Chen (2017) based on the wind tunnel test results of the Qipanzhou Yangtze River Bridge. The flutter critical wind speeds of the original scheme and the guide vane scheme of the Qipanzhou Yangtze River Bridge have errors ranging from 1.42% to 9.90% when calculated using the CFD free coupled vibration method, indicating that the method in this project performed well. To continue exploring the applicability of the free coupled vibration method and facilitate its application in similar projects, a rapid flutter identification method was proposed, and the influence of the torsional bending frequency ratio on the flutter critical wind speed of long-span suspension bridges was discussed. For long-span suspension bridges of over a kilometer, when the torsional bending frequency ratio changes while other flutter influencing factors remain unchanged, the trend of the flutter critical wind speed is similar to the "S" shape, increasing slowly at first, then rapidly, and finally remaining essentially unchanged. In practical engineering applications, more attention should be paid to the torsional bending frequency ratio within a range of less than 5, especially when the flutter critical wind speed is less than the flutter inspection wind speed, it is necessary to change the scheme in time and carry out wind tunnel tests. The variation of flutter critical wind speed with torsional bending frequency ratio is shown in Fig. 110.
![]() Figure 110. Variation of flutter critical wind speed with torsional bending frequency ratio.
Figure 110. Variation of flutter critical wind speed with torsional bending frequency ratio.Bai et al. (2021) used the Newmark-β method for quantitative analysis of nonlinear vibration. The UDF program embedded in the Newmark equation was used to drive the grid to implement the coupled free vibration method for identifying bridge flutter derivatives. By comparing with the theoretical solution of the ideal thin plate flutter derivatives as shown in Fig. 111, reasonable suggestions were given for the parameter of the Newmark equation, and the accuracy of the method was verified by comparing with the wind tunnel test results of the Qipanzhou Yangtze River Bridge.
![]() Figure 111. Comparison of flutter derivatives at 0 degrees of attack. (a)
Figure 111. Comparison of flutter derivatives at 0 degrees of attack. (a). (b) .(c) .(d) .(e) .(f) .(g) .(h) . Bai et al. (2022b) used numerical simulation methods to calculate the flutter derivatives and critical wind speeds of cross-sections with wind fairing angles of 45° and 90°, and cross-section width-height ratios of 8, 10, and 12 at a wind attack angle of 0°, which were 90 m/s, 101 m/s, and 114 m/s, respectively. The influence mechanism of parameter such as aerodynamic damping and aerodynamic stiffness on the flutter stability performance of streamlined double-sided main beam bridge sections was discussed. In order to find the sensitive areas that affect the flutter stability performance of the bridge, so as to set aerodynamic measures purposefully to improve the flutter stability performance of streamlined double-sided main beam bridge sections, the surface of the double-sided main beam was divided into parts, and the contribution of different partition pressures to the lift moment and flutter mode was studied through surface pressure integration, and the areas with greater influence were identified. As shown in Figs. 112-114, the POD method was used to analyze the surface pressure characteristics of the streamlined double-sided main beam cross-sections with wind fairing angles of 45° and 90°, and the main reasons for the flutter instability mode were found by comparing the contribution rates of each mode. The results show that the wind fairing angle has a significant effect on the flutter stability of the streamlined double-sided main beam, and the 90° wind fairing is more significant in improving the aerodynamic damping of the system, which is more favorable for flutter stability. The width-height ratio mainly affects the vertical bending motion of the streamlined double-sided main beam cross-section, and the larger the width-height ratio, the better the flutter stability of the structure. The left box part of the streamlined double-sided main beam and the lower surface between the two side boxes are the main areas that induce flutter instability. When the wind fairing angle is sharp, the vortex shedding position is at the downstream wind fairing, and as the wind fairing angle becomes blunt, the vortex shedding position will move upstream.
![]() Figure 112. Changes of aspect ratio of main girder. (a) Main beam section form. (b) Local indication of aspect ratio change.
Figure 112. Changes of aspect ratio of main girder. (a) Main beam section form. (b) Local indication of aspect ratio change.![]() Figure 113. POD modes of surface pressure at 90° wind fairing section. (a) Stage 1. (b) Stage 2. (c) Stage 3. (d) Stage 4.
Figure 113. POD modes of surface pressure at 90° wind fairing section. (a) Stage 1. (b) Stage 2. (c) Stage 3. (d) Stage 4.![]() Figure 114. POD modes of surface pressure at 45° wind fairing section. (a) Stage 1. (b) Stage 2. (c) Stage 3. (d) Stage 4.
Figure 114. POD modes of surface pressure at 45° wind fairing section. (a) Stage 1. (b) Stage 2. (c) Stage 3. (d) Stage 4.5.4 Damping measures
Properly designed damping measures can effectively suppress wind-induced vibration problems of bridges. Common damping measures include aerodynamic measures, structural measures, and mechanical measures.
5.4.1 Aerodynamic measures
The flutter phenomenon of bridge structures is a typical aerodynamic coupling phenomenon. Aerodynamic measures can fundamentally eliminate the causes of bridge wind vibration by changing the "bridge-flow coupling resonance system."
The damping idea of aerodynamic measures is more proactive than mechanical and structural measures, and the control effect is more obvious, with lower control costs and prices. Properly designed aerodynamic measures have excellent damping performance and can well solve the problem of insufficient wind safety reserve for super large-span bridges. Since flutter and vortex-induced-vibration are sensitive to the shape, position, and implementation details of aerodynamic measures, improper measures not only cannot play a damping role but may even worsen the aerodynamic stability.
In order to study the influence of different flutter aerodynamic measures on the flutter stability of flat steel box girders, a large-span suspension bridge flat steel box girder sectional model wind tunnel test was conducted by Li et al. (2021d) as shown in Figs. 115 and 116. The effects of three measures, setting an upper central stabilizer, sealing different positions of guardrails, and changing the ventilation rate of maintenance road guardrails, on the flutter critical wind speed of the main beam were studied. The flutter control characteristics were also studied based on the relationship between static three-force and flutter derivatives. From Figs. 117 and 118, the results show that setting an appropriately sized upper central stabilizer alone can effectively improve the flutter critical wind speed of the cross-section. Sealing the maintenance road guardrail alone (not fully sealed) which appropriately reduce the ventilation rate, is beneficial to improving the flutter critical wind speed, but it is affected by the wind attack angle. When sealing the maintenance road alone, the flutter critical wind speed of the main beam cross-section decreases almost linearly with the increase of the ventilation rate at 0° attack angle. While at +3° attack angle, the flutter critical wind speed first increases and then decreases with the increase of the ventilation rate.
![]() Figure 115. Layouts of upper central stabilizer with different heights. (a) Layout diagram of 1.3 m upper central stabilizer plate. (b) Layout diagram of 1.6 m upper central stabilizer plate.
Figure 115. Layouts of upper central stabilizer with different heights. (a) Layout diagram of 1.3 m upper central stabilizer plate. (b) Layout diagram of 1.6 m upper central stabilizer plate.![]() Figure 116. Isolating ways for different ventilation rates. (a) Sealing one by one. (b) Seal one every two. (c) Seal one every three.
Figure 116. Isolating ways for different ventilation rates. (a) Sealing one by one. (b) Seal one every two. (c) Seal one every three.![]() Figure 118. Influence of ventilation rate of guardrail of maintaining roadway on critical flutter wind speed.
Figure 118. Influence of ventilation rate of guardrail of maintaining roadway on critical flutter wind speed.Through the wind tunnel test of Liujia Gorge Bridge, the effects of the combination of aerodynamic measures such as central stabilizers, guide vane closed crash barriers, etc., on the flutter stability of steel truss suspension bridges were discussed by Bai et al. (2013b). The results show that the effect of using both upper and lower stabilizers is better than using one alone. When the upper stabilizer is set in sections, the flutter critical wind speed at positive attack angles will decrease rapidly. The external horizontal guide vane is better than the internal one. Widening the horizontal guide vane can balance the flutter stability at different attack angles. The crash barrier can play the role of the central stabilizer by increasing the height and closing design, effectively improving the flutter critical wind speed of truss suspension bridges at different attack angles. In the wind tunnel test of the sectional model of the Runyang Yangtze River Bridge South Branch suspension bridge, Han and Chen (2008a) studied the influence of the height of the central stabilizer on the dynamic wind resistance stability. The aerodynamic derivatives and three-force coefficients of the original cross-section and the cross-section with the added central stabilizer were obtained. The results show that properly setting the central stabilizer can not only improve the flutter critical wind speed of the bridge but also reduce the structure's vortex-induced-vibration response, while the static wind instability wind speed at positive attack angles will decrease.
Li et al. (2012a) conducted an analysis on two narrow suspension bridges that both exhibited wind-induced vibration and static wind stability that could not meet the specifications. The effects of various wind resistance measures adopted by the two bridges were compared, and the influence of different measure control parameter on the structural flutter stability was analyzed. Based on this, further exploration was made to find a narrow suspension bridge structure system with good wind resistance performance. Combined with the cross-section characteristics and traffic demands of the bridge, the final scheme 10 was recommended as the ultimate solution to the flutter stability of the bridge. The test schematic diagrams are shown in Tabel 13 and the test results are shown in Table 14.
Table 13. Wind resistance measure test program.Scheme number Aerodynamic measure Wind resistance measures Schematic diagram Detailed parameter information 1 Lower central stabilizer 
h1 = 1.12 m 2 Lower central stabilizer and horizontal guide vane combination h1 = 1.12 m, L2 = 1.28 m 3 Lower central stabilizer and oblique guide vane combination h1 = 1.12 m, L2 = 1.28 m, inclination angle 30° 4 Lower central stabilizer and built-in oblique guide vane combination Ⅰ h1 = 1.12 m, L2 = 1.28 m, inclination angle 30° 5 Lower central stabilizer and built-in oblique guide vane combination Ⅱ h1 = 1.12 m, L2 = 1.28 m, inclination angle 30° 6 Upper central stabilizer and lower central stabilizer combination Ⅰ h1 = 1.12 m, h2 = 0.80 m 7 Upper central stabilizer and lower central stabilizer combination Ⅱ h1 = 1.12 m, h2 = 1.28 m 8 Upper central stabilizer and lower central stabilizer combination Ⅲ h1 = 1.12 m, h2 = 1.28 m, interval = 30 m 9 Lower central stabilizer, horizontal guide vane, and partially closed crash barrier combination Ⅰ h1 = 1.12 m, L2 = 2.00 m 10 Lower central stabilizer, horizontal guide vane, and partially closed crash barrier combination Ⅱ h1 = 1.12 m, L2 = 2.00 m 11 Lower central stabilizer, horizontal guide vane, and 0.9 m crash barrier combination h1 = 1.12 m, L2 = 2.00 m, crash barrier = 0.9 m Table 14. Results of wind resistance measure test program.Scheme number Flutter check wind speed (m/s) Flutter critical wind speed at different wind attack angles (m/s) −5° −3° 0° 3° 5° 1 53.07 – > 70.4 50.6 37.4 – 2 – > 70.4 66.0 17.6 – 3 – > 70.4 66.0 39.6 – 4 – 66.0 48.4 41.8 – 5 – 57.2 39.6 33.0 – 6 > 70.4 > 70.4 > 70.4 > 70.4 48.4 7 > 70.4 > 70.4 > 70.4 > 70.4 > 70.4 8 > 70.4 > 70.4 > 70.4 > 68.2 39.6 9 57.2 > 70.4 66.0 > 70.4 > 70.4 10 66.0 > 70.4 66.0 > 70.4 61.6 11 – > 66.00 43.80 41.61 – Taking Liujia Gorge Bridge as an example, the influence of the combination of aerodynamic measures such as central stabilizers, guide vanes, and closed crash barriers on the flutter stability of steel truss suspension bridges was studied through wind tunnel tests by Bai et al. (2013a). The results show that: using both upper and lower stabilizers at the same time is better than using one alone; when the upper stabilizer is designed in sections, the flutter critical wind speed at positive attack angles will drop sharply. The external horizontal guide vane is better than the internal one within the steel truss; widening the horizontal guide vane can balance the flutter stability at different attack angles. Raising and closing the crash barrier can play the role of the central stabilizer and effectively improve the flutter critical wind speed of truss suspension bridges at different attack angles.
Due to many advantages and huge economic benefits of pedestrian suspension bridges, large-span pedestrian suspension bridges are widely constructed by Chen (2022a). However, the structural characteristics of pedestrian suspension bridges lead to prominent wind-induced vibration problems. After replacing the pedestrian bridge surface with steel grating, the change in structural aerodynamic shape will affect the aerodynamic stability of the structure, and there is little and incomplete research on this part at home and abroad. Based on a certain large-span pedestrian suspension bridge, wind tunnel model vibration tests were conducted. From the results as shown in Fig. 119, it was concluded that the torsional stiffness of the pedestrian suspension bridge is extremely small, and the flutter instability is mainly driven by the A-term aerodynamic damping obtained from the calculation of aerodynamic derivatives and the D-term aerodynamic damping obtained from the calculation of cross aerodynamic derivatives.
![]() Figure 119. Flutter critical wind speed with different grid opening rates and grid arrangement methods. (a) Illustration of opening rates. (b) Schematic diagram of different grating layout flutter critical wind speeds.
Figure 119. Flutter critical wind speed with different grid opening rates and grid arrangement methods. (a) Illustration of opening rates. (b) Schematic diagram of different grating layout flutter critical wind speeds.Wu et al. (2023) carried out sectional model wind tunnel tests on steel box girder cross-sections with laminar flow control wind fairings (V-shaped wind fairing, Y-shaped wind fairing) and an inverted-L-shaped wind fairing as shown in Fig. 120. The ultimate span of conventional plane cable suspension bridges was discussed. The new stiffened girder cross-section designed according to the turbulent flow control theory can make the main span of conventional suspension bridges reach 2700 m while ensuring the flutter inspection wind speed is above 80 m/s.
![]() Figure 120. Aerodynamic shape of steel box girder section. (a) V-type wind fairings. (b) Y-type wind fairings. (c) Turbulent vibration wind fairing.
Figure 120. Aerodynamic shape of steel box girder section. (a) V-type wind fairings. (b) Y-type wind fairings. (c) Turbulent vibration wind fairing.5.4.2 Structural measures
Structural measures mainly improve the torsional vibration frequency of the structure by increasing the torsional stiffness, changing the dynamic characteristics of the structure, and improving the static and dynamic stability of the bridge, thereby enhancing the wind resistance stability of the structure. For example, Bai et al. (2010c) systematically studied several different methods to improve the stiffness of the Saiwudaigel Bridge and the testing results from different structural measures are given in Tables 15 and 16.
Table 15. Comparison of calculation results with different wind resistance measures.Static analysis results of wind resistance cable unit at different angles Mid-span wind resistance cable 0° 30° 45° 60° 90° Displacement of wind cable (m) Horizontal −0.0008 −0.1177 −0.1216 −0.0973 0 Vertical 0.3629 0.2054 −0.123 −0.0574 −0.0012 Displacement of main beam (m) Horizontal 0 0 0 0 0 Vertical −0.2879 −0.6314 −0.7521 −0.8312 −0.8883 Cable tension (kN) 3611 3348 3154 2986 2837 Static analysis results of wind resistance cable unit under different initial strains Mid-span wind resistance cable 2500 kN 3000 kN 3500 kN 4000 kN 4500 kN Displacement of wind cable (m) Horizontal 0.1330 0.1270 −0.1216 0.1160 0.1100 Vertical 0.1340 0.1280 −0.1230 0.1180 0.0800 Displacement of main beam (m) Horizontal 0 0 0 0 0 Vertical 0.5603 0.6584 −0.7521 0.8422 0.9290 Cable tension (kN) 2242 2697 3154 3245 4072 Static analysis results of different lengths of tie rods Mid-span wind resistance cable 0.5 1 2 3 4 Displacement of wind cable (m) Horizontal (m) −0.0804 −0.1216 −0.1795 −0.2225 −0.2575 Vertical (m) −0.0811 −0.1230 −0.1821 −0.2264 −0.2667 Displacement of main beam (m) Horizontal (m) 0 0 0 0 0 Vertical (m) −0.7621 −0.7521 −0.7400 −0.7323 −0.7268 Cable tension (kN) 3158 3154 3148 3144 3141 Table 16. Comparison of fundamental frequency with different central buckles.Design scheme with one central buckle (Hz) Design scheme with three central buckle (Hz) Design scheme with one central buckle and 45° wind resistance cable (Hz) Design scheme with three central buckle and 45° wind resistance cable (Hz) Lateral bending Symmetrical 0.1592 0.1595 0.3247 0.3247 Asymmetrical 0.5082 0.5088 0.6152 0.6152 Vertical bending Symmetrical 0.3649 0.3642 0.5614 0.5607 Asymmetrical 0.2389 0.2393 0.4130 0.4130 Torsion Symmetrical 1.3123 1.3090 1.6109 1.7286 Asymmetrical 1.4814 1.4865 1.7741 1.7784 Based on the engineering background of the Saiwudaigel Bridge, He and Liu (2010) studied various wind resistance measures to improve the flutter critical wind speed of suspension bridges as shown in Fig. 121. The authors investigated the wind resistance stability design suitable for large-span and narrow suspension bridges, and optimizes the structural measures taken to determine the comprehensive wind resistance measures. Through sectional model wind tunnel tests and full modal flutter analysis, the results show that structural wind resistance measures such as wind resistance cables, central buckles, and bridge deck railings participating in the main beam stiffness can significantly improve the stiffness of the stiffened beam and the torsional fundamental frequency of large-span and narrow steel truss suspension bridges, thereby significantly improving the flutter critical wind speed of large-span and narrow steel truss suspension bridges.
![]() Figure 121. Flutter stability evaluation with wind resistance measures (unit: m/s). (a) Illustration of the measure. (b) Comparison of test results.
Figure 121. Flutter stability evaluation with wind resistance measures (unit: m/s). (a) Illustration of the measure. (b) Comparison of test results.Bai et al. (2011) investigated a narrow steel truss girder suspension bridge used for pedestrians and livestock passage on pastures. In view of the complex wind climate at the bridge site, cautious designers used wind tunnel tests to confirm the aerodynamic stability of the bridge under wind action. The wind tunnel test analysis and results conducted in the Chang'an Wind Tunnel Laboratory showed that significant changes to the original plan were necessary to improve the aerodynamic stability under wind action. Considering the size characteristics and geographical location of the Xidi'er Gorge Bridge, combined with the analysis, the sectional model was retested in the wind tunnel with auxiliary cables and central buckles as mitigation measures. As indicated from Tables 17 and 18, auxiliary cables and central buckles can significantly increase the bridge's natural frequency, thereby improving the flutter critical wind speed.
Table 17. Effect of auxiliary cable on the natural frequency.Mode shape First asymmetrical bending First symmetrical bending First asymmetrical torsion First symmetrical torsion Original scheme Frequency (Hz) 0.2534 0.3645 0.9092 1.0815 Scheme with auxiliary cable Horizontal Frequency (Hz) 0.3319 0.4491 1.2593 1.5926 Increase (%) 31 23 39 47 45° Frequency (Hz) 0.4119 0.5599 1.2672 1.5824 Increase (%) 62 53 39 46 Vertical Frequency (Hz) 0.4484 0.6082 1.2302 1.5894 Increase (%) 77 67 35 47 Table 18. Effect of mitigation on critical wind speed of flutter.Attack angle Flutter analysis (m/s) Test results (m/s) With mitigation measures (m/s) α = −3° 15.17 25.50 59.5 α = 0° 35.60 > 45.00 > 80.5 α = 3° 28.56 40.50 > 66.5 Through numerical simulation methods, the effects of measures such as main cable sag ratio, spatialization of main cables, and setting up anti-twisting auxiliary cables on the enhancement of structural torsional frequency were studied by Wu et al. (2023). By adding structural measures such as wind resistance cables, the span of the suspension bridge can be further increased to 6000 m, providing possibilities for the construction of larger-span cross-sea bridge projects in the future. Guan (2016) investigated on a 420 m main span stiffened beam pedestrian suspension bridge, the aerodynamic cross-section selection for large-span stiffened beam pedestrian suspension bridges based on flutter stability was studied; the flutter derivatives of the bridge section free vibration were identified using the weighted least squares iteration method, and the random reduction technique was used to process the vibration signals at high wind speeds to improve the identification accuracy of aerodynamic derivatives.
5.4.3 Mechanical measures
The mechanical measures to suppress bridge flutter mainly involve the use of dampers to increase the structural damping ratio, thereby raising the flutter critical wind speed of the main beam and preventing divergent vibrations under the action of wind. Specific measures include the installation of tuned mass dampers (TMD) and other types of dampers, such as hydraulic dampers, viscous shear dampers, and magnetorheological dampers. These dampers reduce or eliminate vortex-induced-vibrations and enhance the flutter stability of the bridge by increasing the structure's damping. The motion equation of the bridge multi-modal coupling flutter system with passive TMD was derived by Zeng and Han (2005) based on the multi-modal coupling flutter theory. Taking the Ya Men Bridge as an example, the effectiveness of TMD on bridge flutter control and the influence of aerodynamic derivatives, structural parameter, TMD parameter, etc., on the flutter control effect were analyzed.
A linear eddy current damper for sectional model tests was disclosed by Gao et al. (2021a), which is set at the end of the sectional model and arranged diagonally as illustrated in Fig. 122. The linear eddy current damper includes a rigid insulating rod, a metal plate, and two permanent magnets. The rigid insulating rod is connected to the metal plate at the lower end and to the lifting arm at the upper end; the two permanent magnets are placed directly below the metal plate, and the two permanent magnets are kept at a distance to form a magnetic field. A vibration device was also disclosed, including a sectional model, springs, two lifting arms, and a linear eddy current damper. The lifting arms are fixedly connected to both ends of the sectional model and are symmetrically arranged. A spring is connected at both ends of the lifting arm, and the other end of the spring is fixedly installed inside the wind tunnel laboratory; the rigid insulating rod is detachably connected to the lifting arm at the upper end. This solves the problem of errors in the current vibration device. An experimental method based on the vibration device was also disclosed, and the calculation formulas for the damping coefficients and damping ratios during the vertical and torsional vibration processes of the wind-induced sectional model were given, respectively. When the wind-induced sectional model undergoes vertical vibration, the lifting arm moves upward with the sectional model, driving the rigid insulating rod and metal plate to move upward. The magnetic field applies a vertical damping force to the metal plate, and the vertical damping coefficient and vertical damping ratio are calculated according to the vertical damping force. The damping ratio change with amplitude before and after the application of the linear eddy current damper is shown is Fig. 123.
![]() Figure 122. Illustration of wind tunnel test program. (a) Schematic diagram of the overall layout of a spring-suspended sectional model vibration device. (b) Schematic diagram of the linear eddy current damper.
Figure 122. Illustration of wind tunnel test program. (a) Schematic diagram of the overall layout of a spring-suspended sectional model vibration device. (b) Schematic diagram of the linear eddy current damper.![]() Figure 123. Damping ratio change with amplitude before and after the application of the linear eddy current damper. (a) Vertical. (b) Torsional.
Figure 123. Damping ratio change with amplitude before and after the application of the linear eddy current damper. (a) Vertical. (b) Torsional.6. Vortex-induced-vibration of bridges
Vortex-induced-vibration is a kind of self-excited limit-cycle vibration caused by the periodic shedding of vortices around the surface of a structure at low wind speeds. Unlike flutter or galloping, which can cause divergent vibrations that severely damage bridge structures, vortex-induced-vibration can seriously affect the comfort of driving and walking on the bridge and can also lead to structural fatigue failure or damage. Vortex-induced-vibration phenomena have been observed in components such as the main beams, bridge towers, arch ribs, vertical hangers, and inclined cables of bridges.
Scholars at home and abroad have carried out a large number of studies on wind-induced vortex-induced-vibration of bridges and have achieved many fruitful results. These studies cover a wide range and involve a broad scope. This paper reviews the current state of research at home and abroad from four aspects: the characteristics of vortex-induced-vibration, factors affecting vortex-induced-vibration, methods of suppressing vortex-induced-vibration, and the limitation of vortex-induced-vibration amplitude. It summarizes the wind tunnel research results of Chang'an University and looks forward to future research directions for vortex-induced-vibration of bridges.
6.1 Characteristics of vortex-induced-vibration
Due to the complexity of the flow around bridge cross-sections, it is difficult to derive an analytical expression for vortex-induced-vibration from the theory of fluid mechanics. Currently, physical sectional models with dynamic pressure measurement are often used to obtain the characteristics of the surface pressure distribution when vortex vibration occurs, or CFD is employed to capture the wake evolution characteristics during the occurrence of vortex-induced-vibration. The following summarizes the current state of research on the characteristics of vortex-induced-vibration from the perspectives of cross-sectional flow, wind speed lock-in range, and vortex shedding.
6.1.1 Main beam cross-section
Long-span highway bridges often adopt the structural forms of cable-stayed bridges or suspension bridges, and their main beam cross-sections are typically streamlined box shapes with a high width-to-height ratio, separated box-shaped cross-sections, π-shaped cross-sections, P-K cross-sections, truss beams, and other forms. Considering that the vortex vibration issue of truss beams is not prominent, the following summarizes the flow field characteristics and vibration characteristics of the other four types of cross-sections for the main beam.
Zheng (2021) used numerical computation methods to study the vortex-induced-vibration performance of a 5:1 rectangular cross-section. The author conducted research on the vortex structure identification method for the flow field around a 5:1 rectangular cross-section. By employing POD and dynamic mode decomposition (DMD) methods for modal decomposition of the flow field at rest and in different stages of vibration under various wind speeds, it was found that the POD method performs poorly in capturing the dynamic characteristics of the flow field. While the DMD method can successfully identify the main frequency spatial modes in the flow field.
Guan et al. (2013) selected a typical bridge cross-section as the research object and analyzed the internal attributes of the bridge cross-section's vertical vortex vibration, the causes of the double vertical vortex vibration area, and the inherent essence of aerodynamic vibration suppression from three aspects: displacement response, pressure coefficient, and aerodynamic force. By using pressure coefficients and aerodynamic forces, a tentative analysis was made of the specific location and relative size of the vertical vortex shedding in the airflow. As illustrated in Fig. 124, for a typical box beam cross-section, the main characteristic of two-dimensional vortex shedding is that when the fluid flows past the blunt body cross-section and separates, the flow velocity at the edge of the boundary layer is relatively large, and at the same time, the separation of two-dimensional fluid vortices occurs more frequently, which can happen both at the sharp edge of the cross-section and at the continuous surface of the blunt body.
Wang (2014) took a typical blunt body cross-section as the research carrier, collected time-history acceleration data and time-history pressure data during the wind tunnel test process of the segmental beam model, and then analyzed the relevant parameter of the collected data (displacement values, pressure coefficient fluctuation values, aerodynamic force contribution values, aerodynamic force dominant frequency values, power spectral density values, phase spectrum values, etc.). Vortex-induced-vibration characteristics were discussed from both time-domain and frequency-domain perspectives. The vertical bending eddy vibration time history is shown in Fig. 125. Through time-domain analysis methods, the study on the vertical bending vortex-induced-vibration characteristics of a typical steel box cross-section showed that the form of the vertical displacement time-history sampling point curve is in the form of a "string" function curve, and the curve frequency is equal to the frequency of a certain order of the structure's vibration mode. The curve frequency locks onto the frequency of the vortex shedding in the vibration system's first-order vertical bending mode. Through time-domain analysis methods, the study on the torsional vortex-induced-vibration characteristics of a typical steel box cross-section showed that the coupling effect of wind and structure makes the amplitude exhibit a very regular pattern, which is disrupted when wind speeds of 18.50 m/s and 24.75 m/s in the non-vortex vibration section act on the structure. The torsional eddy time history analysis is shown in Fig. 126.
Song (2020) took three different web height cross-section models of a continuous steel box beam bridge span at midspan, quarter points, and support points as the research subjects, and studied the vortex-induced-vibration characteristics of the cross-sections of variable cross-section steel box beams with different web heights through wind tunnel tests and numerical simulation methods. Within the vortex vibration lock-in range, the longitudinal correlation coefficient of wind pressure shows a trend of being significantly higher during the vortex vibration amplitude rise stage and the vortex vibration amplitude peak stage compared to other vortex vibration stages, among which the longitudinal correlation coefficient during the amplitude rise stage is the largest. The average pressure distribution on the surface of a fixed model is shown in Fig. 127.
![]() Figure 127. Average pressure distribution on the surface of a fixed model with different angles of attack.
Figure 127. Average pressure distribution on the surface of a fixed model with different angles of attack.![]() Figure 128. Relationship between the amplitude of vertical bending vortex-induced-vibration and resonance and wind speed in a small-scale model. (a) Turbulence intensity is around 17%. (b) Turbulence intensity is around 23%.
Figure 128. Relationship between the amplitude of vertical bending vortex-induced-vibration and resonance and wind speed in a small-scale model. (a) Turbulence intensity is around 17%. (b) Turbulence intensity is around 23%.Dang (2021) conducted an in-depth study on the initiation mechanism of a typical straight web steel box girder by designing conventional sectional models and large-scale phase models, and through wind tunnel vibration tests and numerical simulations. The study by Song (2020) on variable cross-section steel box beams with different web heights revealed consistent wind pressure distribution patterns in both static and vibrating states, with amplitude having a minor impact on the wind pressure distribution. However, within the vortex-induced-vibration lock-in range, the pressure coefficients on the upper and lower surfaces change with the vibration phase. Wang (2022a) designed rigid models of steel box girder segments with four aspect ratios and analyzed the static flow field around the cross-section through CFD numerical simulation. The results indicated that for steel box beams with an aspect ratio of 1:6, the high negative pressure area on the upper surface near the trailing edge and the violent pressure fluctuations in the wake are presumed to be one of the main reasons for vortex-induced-vibration.
Duc et al. (2023) explored the mechanism by which wing plates reduce the amplitude of vortex-induced-vibrations in steel box girders. Wind tunnel tests and CFD technology were used to study the flow field around the bridge deck with and without wing plates, and the results were compared. It was found that the installation of wing plates increases turbulence on the surface and the leeward side, disrupting vortex formation and reducing lift on the structure. The efficiency of the wing plates was related to their position and length.
Cui (2012) studied the vortex-induced response of a quasi-streamlined bridge cross-section under different wind attack angles through wind tunnel tests. The study found that changes in the attack angle essentially altered the aerodynamic shape immersed in the flow field, affecting the flow state around the structure, surface pressure fluctuations, and the correlation of local and overall vortex-induced forces. It was also found that the Strouhal number varied with different attack angles. The use of grilles to create a turbulent flow field revealed significant differences in vortex-induced responses between uniform and turbulent flow fields, with the response being reduced or even disappearing in turbulent flow due to the disruption of flow coherence by the turbulent components (Fig. 128).
In recent years, the analysis of the flow field around typical steel box girder cross-sections and their vortex-induced-vibration characteristics has mainly relied on CFD simulation and wind tunnel testing methods. Both the time-domain method and the frequency-domain method are commonly used to analyze vertical vortex-induced-vibration and torsional vortex-induced-vibration, respectively. The analysis reveals that the amplitude of vortex-induced-vibration, wind speed lock-in range, and disturbed flow field characteristics of typical steel box girder cross-sections are closely related to factors such as the geometric shape of the bridge cross-section, Reynolds number effect, and wind attack angle. The vortex shedding position varies depending on the cross-section.
Laima et al. (2013) conducted static and dynamic wind tunnel tests on a twin-box girder with an aspect ratio (L/D) of 1.70. They observed and analyzed the vortex shedding and vortex-induced-vibrations under static and dynamic conditions. Wang (2019) studied the influence of vibration mechanisms on the flow field characteristics around large-span separated twin-box girders based on wind tunnel tests. The effects of vibration mechanisms on wind pressure distribution characteristics and wind pressure spanwise correlation were deeply analyzed. The results showed that within the vortex-induced-vibration lock-in range, amplitude affects the average pressure on the upper surface of the box girder but not the lower surface; amplitude has a small impact on the average pressure coefficient but a significant effect on the flow field fluctuation RMS values.
Li and Zhu (2021) took a separated twin-box girder bridge as the research object and used segmental model vibration and pressure measurement tests to obtain surface wind pressures under different states of the separated twin-box girder. By analyzing and processing the wind pressures, the main frequency distribution and average wind pressure coefficient distribution under different states were obtained. It was found that within the torsional vortex-induced-vibration lock-in range of the separated twin-box girder, the surface average wind pressure coefficient follows a normal distribution and the trend is consistent. The range of action of the vortices shed on the upper and lower surfaces inside the gap narrows with the increase of wind speed.
Zhu (2021) used wind tunnel tests and numerical simulation to study the vortex-induced-vibration characteristics of separated twin-box girders and revealed the vibration suppression mechanism of a new type of vortex suppression measure-double lower central stabilizing plates. The results showed that the vortex shedding effect around the gap is a necessary condition for the vortex-induced-vibration of separated twin-box girders. The vortex shedding influence range within the lock-in range gradually contracts towards the gap with the increase of wind speed. Zhao (2022) studied the vortex-induced-vibration response of a pedestrian suspension bridge with double-box girders and a central grille section, and analyzed the vortex-induced-vibration characteristics and main beam flow field characteristics of different grille arrangements and different grille opening rates through numerical simulation. Xiao (2022) used synchronous pressure and vibration measurement tests and numerical simulation to study the vibration suppression mechanism of separated twin-box girders under the action of two aerodynamic measures which are inverted L-shaped guide vanes and double lower central stabilizing plates, as well as their combined effect. The results showed that the inverted L-shaped guide vanes and double lower central stabilizing plates have a significant impact on the surface pressure characteristics of the downstream box girder.
Xu (2023) explored the wind barrier wind shielding mechanism and the aerodynamic mechanism affecting the vortex-induced-vibration performance of separated twin-box girders. The results showed that wind barriers can reduce the vortex scale around the section in the low wind speed area, thus suppressing the vertical bending vortex-induced-vibration of the main beam in the low wind speed area. Liu (2023a) conducted synchronous pressure and vibration measurement tests to study the vortex-induced-vibration characteristics of separated twin-box girders and the vibration suppression mechanism when using a vortex splitter as a vibration suppression measure. The results showed that the average pressure coefficient on the model surface is not significantly related to wind speed or whether the model vibrates but is mainly affected by the cross-section shape. Shi (2023) used wind tunnel tests and CFD numerical simulation to analyze the vortex-induced-vibration characteristics and flow field characteristics of separated twin-box girder cross-sections, as well as the vibration suppression mechanism of inverted L-shaped guide vanes. The study found that the initial cross-section of the separated twin-box girder exhibited strong vortex-induced-vibrations, with vertical bending vortex vibration having a single wind speed lock-in range and torsional vortex vibration having a double wind speed lock-in range, with obvious locking phenomena.
Wu (2023a) conducted wind tunnel synchronous vibration and pressure measurement tests on combinations of five central slot widths and four maintenance track positions to study the vortex-induced-vibration characteristics of separated twin-box girders, identify sensitive areas that induce vortex-induced-vibrations, and explore the vortex-induced-vibration mechanism. Cao (2024) captured the surface pressure distribution under various conditions through numerical simulation dynamic pressure measurement methods and analyzed the surface flow field of typical conditions to reveal the mechanism by which changes in aerodynamic shape affect the main beam's vortex vibration. Reducing the slot width weakened the contribution of aerodynamic forces at the slot and downstream sloping web plate, enhancing the main beam's vortex vibration performance. Guan et al. (2013) selected a typical π-shaped bridge cross-section for study and analyzed the causes of the double vertical vortex vibration area from three aspects: displacement response, pressure coefficient, and aerodynamic force. It was pointed out that the Strouhal numbers of the double vertical vortex vibration areas are different, and the airflow vortex shedding is independent.
Wang (2018) used Fluent software for numerical simulation of different π-shaped cross-sections, obtaining flow field trajectory maps around different cross-sections and parameter such as maximum vortex scale, average vortex scale, and surface pressure coefficient that describe flow field characteristics. The study showed that the wind attack angle has a significant effect on the flow field characteristics of the π-shaped main beam. Li (2019) used numerical simulation methods to study the vortex vibration characteristics, occurrence mechanism, and aerodynamic measure vibration suppression mechanism of the main beam of a cable-stayed bridge with a π-shaped cross-section. The study found that the π-shaped bare beam cross-section has a significant overlap phenomenon of high wind speed vertical bending and torsional vortex vibration responses. Under overlapping wind speeds, the development of one vibration mode is not entirely independent but is influenced by the energy transfer of other modes. In the high response section, the two vibration modes often suppress each other, making it difficult to obtain the true vibration development trend.
Zhang (2020) based on the synchronous vibration and pressure measurement tests of the π-shaped cross-section, summarized the variation laws of the vortex vibration response and the characteristics of the vortex excitation force of the π-shaped cross-section. Wang (2020) conducted a study on the vortex-induced-vibration phenomenon of a typical double-sided box-shaped π-section with a width-to-height ratio of 10:1. Using both synchronous pressure and vibration measurement wind tunnel tests and numerical studies, the research analyzed the surface pressure characteristics of the fixed and vibrating states of the original π-section and the changes in surface pressure characteristics after adding aerodynamic measures. The static flow around the main beam cross-section before and after adding aerodynamic measures was simulated, and the vibration suppression mechanism of different aerodynamic measures was inferred.
Li et al. (2020c) studied the vortex-induced-vibration performance of a double-layer π-type girder cable-stayed bridge under different upper- and lower-layer beam spacings and wind attack angles. The results show that the vertical bending vortex-induced-vibration amplitude of the double-layer π-type beam decreases and then increases with the increase of the upper- and lower-layer beam spacing, reaching the lowest when the upper- and lower-layer beam spacing is twice the beam height. The lift coefficient of the double-layer π-type beam is lower than that of the single-layer π-type beam, while the drag coefficient and the moment coefficient are higher than those of the single-layer π-type beam.
Wang (2021) studied the influence of different forms of wind fairings on the vortex-induced-vibration response of double-sided box-shaped π-section by using synchronous pressure and vibration measurement tests combined with numerical simulation technology. By comparing the vortex-induced-vibration response and surface pressure characteristics of the cross-section after installing the wind fairing with the original cross-section, the influence of the wind fairings on the vortex-induced-vibration response of the double-sided box-shaped π-section was explained. Xiong (2021) studied the changes in surface pressure characteristics of a typical edge box-shaped π-section with a width-to-height ratio of 10:1 and after adding an inverted L-shaped guide vane. The study results show that the inverted L-shaped guide vane, due to the height difference between the vertical skirt plate and the front edge box, weakens the separation of the incoming flow on the windward side of the original upper and lower surfaces, changes the pressure distribution on the upper and lower surfaces of the original main beam cross-section.
He (2022) also conducted a study on the dual lock-in ranges of vortex-induced-vibration for the π-shaped main beam cross-section with a width-to-depth ratio B/D = 10, as well as the characteristics of the overlapping ranges of vertical bending and torsional vortex-induced-vibrations. Through wind tunnel tests, the vortex-induced-vibration response and surface pressure distribution characteristics of the main beam were obtained. The characteristics of the multi-lock-in ranges of vortex-induced-vibration and the overlapping ranges of vertical bending and torsional vortex-induced-vibrations were analyzed from the evolution rules of vortices and the perspective of aerodynamic forces.
Qiao (2022) developed a free vibration program based on the NewMark-β method and implemented numerical simulation of vertical bending vortex-induced-vibration for a π-shaped main beam with a width-to-height ratio of 10:1. The CFD numerical simulation model was verified against the results of wind tunnel tests. The verified numerical model was used to simulate vortex-induced-vibration responses under other conditions to expand the learning sample size for training a vortex-induced-vibration prediction model. When the height of the stabilizing plate is relatively large, it effectively improves the flow field morphology around the π-shaped main beam, achieving a vibration suppression effect.
Ma et al. (2024) conducted a study on the nonlinear phenomena such as the surface pressure distribution characteristics, different components of aerodynamic force, and hysteresis characteristics of typical open-section profiles, by combining synchronous vibration and pressure measurement wind tunnel tests with CFD. It indicates that there are complex vortex component structures in the flow field around the profile; by using a custom function, the entire process of vortex-induced-vibration of the open section was accurately reproduced. Xing (2024) conducted a study on the vortex-induced-vibration characteristics and flow field characteristics within the lock-in region of the edge box-shaped π-profile, using a combination of sectional model wind tunnel tests, numerical simulation, and dynamic mode decomposition. The results showed that the edge box-shaped π-profile exhibits vertical bending and torsional vortex vibration phenomena in both low and high wind speeds, with overlapping intervals.
Huo (2020) conducted a study on the vortex-induced-vibration characteristics of single-layer and double-layer box girders as research subjects, using sectional model vibration and pressure measurement wind tunnel tests. Li et al. (2022d) conducted sectional model vibration wind tunnel tests to measure the dimensionless vortex-induced-vibration amplitudes of single-layer and double-layer steel box girders under various conditions. As the girder spacing increases, the airflow at the rear inclined web of the upper girder is less likely to separate, and the reattachment point at the front edge moves further forward. As the wind attack angle changes from positive to negative, the flow separation phenomenon at the front edge of the upper surface of the upper girder of the double-layer steel box girder is suppressed.
Kim et al. (2013) conducted an in-depth study on the potential interference vortex-induced-vibrations that may occur between two parallel cable-stayed bridges. It was found that even in the downstream area of the bridges, interference vortex-induced-vibrations still existed. lyu (2024) employed wind tunnel testing and numerical simulation methods to study the lift coefficient, vortex-induced-vibration performance, and mechanisms of the P-K profile main beam of a typical double-track box-type railway bridge (interference bridge) under parallel conditions. The results showed that when the highway bridge is located upstream and downstream, the sequence of vertical bending and torsional vortex-induced-vibrations changes, and there are significant differences in vortex-induced-vibration characteristics.
Xie et al. (2024) found that when the new bridge to be constructed is located downstream, due to the shielding effect of the existing dual-span bridge upstream, neither the original design profile of the new bridge nor any measures installed resulted in vertical bending or torsional vortex-induced-vibrations. The pressure cloud and streamline diagrams for vertical bending and high-speed torsional vortex-induced-vibrations of the original design profile of the new bridge show almost no change within a cycle, which is consistent with the results of the vibration test. This indicates that the aerodynamic interference from the existing dual-span bridge upstream has a significant impact on the vortex-induced-vibrations of the new bridge to be constructed. Yin (2024) discovered that in different spacing ratio conditions between two adjacent bridges, as the spacing ratio increases, the lock-in range length of the two bridge surfaces gradually tends towards that of a single bridge surface. The vortex-induced-vibration peak of the upstream bridge surface is close to that of a single bridge surface and is always greater than that of the downstream bridge surface. This reflects the shielding effect of the upstream bridge surface on the downstream bridge surface and the reverse aerodynamic interference effect of the downstream bridge surface on the upstream bridge surface.
6.1.2 Other cross-sections
The cross-sections of bridge towers, arch ribs, hangers, and cables have a smaller width-to-height ratio compared to the main beam cross-section, and their vortex-induced-vibrations exhibit characteristics different from those of the main beam. Shu and Zhu (2014) utilized sectional model wind tunnel tests and finite element software analysis to study the effects of wind speed, wind direction, and season on vortex-induced-vibrations. They provided the conditions under which vortex-induced-vibrations occur in real bridges and the wind speed lock-in range. For example, the stress amplitude in the cables due to the overall structural vibration is not less than that produced by the load of vehicles, and the fatigue damage should not be overlooked.
Deng (2020) conducted a comparative study on the effects of integrated lighting fixtures and separate lighting fixtures on the vortex-induced-vibration performance of cable structures in long-span bridges. It was found that the radius of the rounded corners of the three types of lighting fixtures had a similar impact on the vortex-induced resonance performance of the stay cables, with the main difference being that a smaller radius of the rounded corners resulted in a decrease in the wind direction angle corresponding to the abrupt increase in the vortex-induced lock-in wind speed. Ma (2019) conducted stationary flow tests and pressure measurements on H-type hangers under static and dynamic conditions, including galloping and vortex-induced-vibrations. From test results shown in Figs. 129 and 130, it was found that compared to the aerodynamic lift when galloping occurs, the aerodynamic lift amplitude is smaller when vortex-induced-vibrations occur. For vortex-induced-vibrations with larger amplitudes, the aerodynamic lift frequency spectrum shows peaks near the fundamental frequency and its higher harmonics, indicating nonlinear characteristics of the aerodynamic lift. Unlike galloping, the magnitude of the aerodynamic lift during the various stages of vortex-induced-vibration remains relatively consistent, without a clear boundary.
![]() Figure 129. Vortex displacement time history and displacement spectrogram. (a) Vortex displacement time history. (b) Vortex displacement spectrogram.
Figure 129. Vortex displacement time history and displacement spectrogram. (a) Vortex displacement time history. (b) Vortex displacement spectrogram.![]() Figure 130. Pneumatic lift time history and pneumatic lift spectrogram. (a) Pneumatic lift time history. (b) Pneumatic lift spectrogram.
Figure 130. Pneumatic lift time history and pneumatic lift spectrogram. (a) Pneumatic lift time history. (b) Pneumatic lift spectrogram.Wu (2023b) conducted a study on a bridge tower using wind tunnel tests and POD analysis. It was found that both uniform and turbulent flow fields exhibit tower side-face bending and torsional vortex-induced-vibrations for wind directions of 90° and 75°. To suppress tower vibrations, control measures can be targeted at the tower structure above half the tower height.
As can be seen from the literature, the analysis of the flow field around structural cross-sections and vortex-induced-vibration characteristics has mainly been conducted through CFD simulation and dynamic pressure measurement methods in wind tunnel tests in recent years. Both time-domain and frequency-domain methods are commonly used to analyze vertical and torsional vortex-induced-vibrations, respectively. The position of vortex shedding, vortex size, and energy in the flow field are key factors affecting vortex-induced-vibrations. The amplitude of vortex-induced-vibrations, wind speed lock-in range, and characteristics of the disturbed flow field are closely related to the geometric shape of the bridge cross-section, wind attack angle, and inflow characteristics. Research on the vortex-induced-vibration characteristics of bridges in special regional wind environments is expected to be a hot topic for future research.
6.2 Factors affecting vortex-induced-vibration
6.2.1 Scruton number
Ji (2010) found that increasing the damping ratio can change the amplitude of the vertical bending or torsional vortex-induced-vibrations of a bridge, but it does not alter the vortex-induced-vibration lock-in range. This means that the damping ratio cannot change the initiation wind speed and the wind speed lock-in range of the vortex-induced-vibrations. However, the amplitude of the vortex-induced-vibrations decreases as the damping ratio increases. Mannini et al. (2017) studied the interference phenomena between vortex-induced-vibrations and transverse galloping of low-damping rectangular cylinders with an aspect ratio between 0.75 and 3.00. The study focused on the key role played by the mass damping parameter of the vibrating body (Scruton number). It was found that to fully decouple the excitation ranges of vortex-induced-vibrations and galloping, as well as to accurately predict the critical wind speed for galloping, a higher Scruton number is required. Wang (2020) conducted a physical wind tunnel test study on the vortex-induced-vibration phenomenon of a typical double-sided box-shaped π-section. It was found that the mass parameter affects the vortex-induced-vibration amplitude, the initiation wind speed, and the lock-in range of the π-type main beam as indicated from Fig. 131 it was also found that the damping parameter have a significant effect on the amplitude of vortex-induced-vibrations for the main beam but have little impact on the initiation wind speed and the lock-in range of the vortex-induced-vibrations as indicated from Fig. 132.
Zheng (2021) conducted vortex-induced-vibration simulations on a rectangular cross-section with an aspect ratio of 5:1, using a low mass ratio (M = 10) and the same Scruton number for low damping. The damping ratio has a smaller impact on vibration frequency and amplitude than the mass ratio. However, at high deceleration rates, a reduction in damping ratio expands the lock-in region. Differences in initial displacement have a greater impact on the amplitude of competitively induced vibrations and a smaller impact on resonance-induced vibrations. Pan (2021) focused on the π-shaped main beam with a width-to-depth ratio B/D of 10, employing both wind tunnel testing and numerical simulation as research methods. The research indicated that the damping ratio has the most significant impact on the amplitude of vortex-induced-vibrations as shown in Fig. 133.
![]() Figure 133. Vertical bending vortex response of π-type girder with different damping ratios.
Figure 133. Vertical bending vortex response of π-type girder with different damping ratios.![]() Figure 134. Vertical bend and torsional amplitude-wind speed curves at different Sc numbers. (a) Vertical bending amplitude-wind speed curve. (b) Torsional amplitude-wind speed curve.
Figure 134. Vertical bend and torsional amplitude-wind speed curves at different Sc numbers. (a) Vertical bending amplitude-wind speed curve. (b) Torsional amplitude-wind speed curve.Zhu (2021) concluded from wind tunnel tests that the relationship between the maximum amplitude of vortex-induced-vibrations and the Scruton (Sc) number for a separated double-box girder can be fitted using a negative exponential power function. The maximum amplitude of torsional vortex-induced-vibrations is more sensitive to the Scruton number than that of vertical bending vortex-induced-vibrations, and the sensitivity of the first lock-in range of torsional vortex-induced-vibrations to the Scruton number is higher than that of the second lock-in range for torsional vibrations (See Fig. 134).
Xing (2024) investigated the effects of mass and damping parameter on the dual lock-in characteristics of vortex-induced-vibrations for the π-shaped cross-section. The mass parameter has the least impact on vortex-induced-vibrations of the π-profile compared to the aforementioned factors, and it is not ideal to suppress vortex-induced-vibrations of the π-profile by adjusting the system mass. Ma (2019) conducted experimental research on the influence of the Scruton number on the vortex-induced-vibrations of non-main beam cross-sections and found that the vortex-induced-vibration responses of H-type hangers with similar Scruton numbers composed of different damping ratios and mass ratios are not the same as shown in Fig. 135.
![]() Figure 135. Wind speed displacement curves at different angles of attack. (a) Damping ratio of 0.128%. (b) Damping ratio of 0.583%. (c). Damping ratio of 1.092%.
Figure 135. Wind speed displacement curves at different angles of attack. (a) Damping ratio of 0.128%. (b) Damping ratio of 0.583%. (c). Damping ratio of 1.092%.Yan (2023) found that increasing the structural damping ratio or structural mass has a good inhibitory effect on the vortex-induced-vibrations that occur at a 0° wind attack angle for the sectional model. This can effectively reduce the maximum amplitude of vortex-induced-vibrations and narrow the lock-in range of vortex-induced-vibrations.
The relationship between critical wind speed and mass damping parameter was first proposed by Scruton in 1960. Subsequently, the quasi-steady theory successfully predicted the critical wind speeds and critical states for galloping in various bluff body structures. This theory is only applicable to galloping at high reduced wind speeds, where the vortex shedding frequency is much greater than the structural natural frequency, and the influence of vortex excitation can be neglected. When the galloping initiation wind speed approaches or is even lower than the vortex-induced-vibration initiation wind speed, galloping and vortex-induced-vibrations will affect each other, and the classical quasi-steady theory for galloping is no longer applicable. For example, Gao et al. (2023) conducted sectional model wind tunnel tests on H-type cross-sections with a width-to-depth ratio B/D of 1.91, using the H-type hangers to explore the influence of mass damping parameter on the galloping of small width-to-height ratio H-type cross-sections. The study found that within the damping ratio range of 0.583%–1.092%, there was coupling between vortex-induced-vibrations and galloping, and there might be a "lock-in range" causing the non-dimensional wind speed-amplitude response curves not to change with the size of the damping ratio, with the slope of the non-dimensional wind speed-amplitude response curve being locked near 0.0218. It is also found that at a 0° attack angle, as the mass ratio increases, the critical wind speed for galloping increases, and vortex-induced-vibrations and galloping phenomena are separated. The vortex-induced-vibration range advances with an increase in mass ratio, and the maximum amplitude also shows a decreasing trend. The results are presented in Fig. 136.
![]() Figure 136. Illustration of the vibration amplitude with the reduced wind speed of 70°.
Figure 136. Illustration of the vibration amplitude with the reduced wind speed of 70°.Gao et al. (2023) also found that under different comparative conditions at a 0° wind attack angle and with similar Scruton numbers, the impact of different mass and damping parameter on wind-induced vibration response is similar. The results are illustrated in Figs. 137 and 138.
![]() Figure 137. Comparison of the responses at 0° angle of attack at the same number of Sc. (a) A2/B1. (b) A3/B2/B3.
Figure 137. Comparison of the responses at 0° angle of attack at the same number of Sc. (a) A2/B1. (b) A3/B2/B3.![]() Figure 138. Comparison of steady-state amplitude response at 70° angle of attack at the same Sc number. (a) A2/B1. (b) A3/B2/B3.
Figure 138. Comparison of steady-state amplitude response at 70° angle of attack at the same Sc number. (a) A2/B1. (b) A3/B2/B3.From the aforementioned research, it is known that increasing the Scruton number of the structure by increasing the mass ratio or damping ratio is effective in reducing the vortex-induced-vibration amplitude and the lock-in range of the vortex-induced-vibration initiation wind speed for the main beam, but the ways in which they affect the vortex response are different. Increasing the Scruton number by increasing the damping ratio has a good vibration suppression effect on the vortex-induced-vibrations of various main beam cross-sections, but the method of increasing the mass ratio to raise the Scruton number is only effective for the suppression of vortex-induced-vibrations in closed box beam cross-sections. As the slot width ratio increases, the vibration suppression effect of this method decreases.
6.2.2 Inflow characteristics
Li et al. (2014) utilized nonlinear theory and chaotic time series analysis methods to establish a mathematical model for wind-induced vibrations of bridges. They developed a program to calculate the Lyapunov exponents of the acceleration time series of bridge vibrations. Wind tunnel tests for bridge vortex-induced-vibrations and flutter were conducted, and the relationship between the Lyapunov exponent and wind speed, as well as the relationship between vortex-induced-vibration amplitude and wind speed, were analyzed as shown in Fig. 139.
Qiao (2022) obtained vortex-induced-vibration response samples of a representative π-shaped cross-section with a width-to-depth ratio of 10:1 through wind tunnel testing and CFD numerical simulation. These samples were used to train different machine learning models and adjust their control parameter. The predictive performance of three machine learning methods was evaluated in terms of computational speed, parameter tuning difficulty, and prediction accuracy. The study found that support vector machines (SVMs) and back propagation neural networks (BPNNs) can ensure sufficient prediction accuracy even with a small sample size, while the radial basis function neural network (RBFNN) showed overall poor predictive performance. The optimized BP neural network model can also accurately predict the vortex-induced-vibration response characteristic parameter under unknown wind fields.
Chen (2022b) conducted a numerical simulation study on the effects of non-uniform inflow on bridge structures. The simulation calculations revealed that under different conditions, there are differences in the aerodynamic force coefficients and vortex shedding frequencies of the main beam, and the distribution of the effective values of the aerodynamic forces along the span also varies, with the maximum values located at one end of the main beam. Ma (2019) simulated turbulent wind fields with different turbulence intensities and integral scales in a wind tunnel using passive grids and conducted wind tunnel vibration tests on H-type hangers. Compared with a uniform flow field, the four types of turbulent wind fields under different damping conditions can all increase the vortex-induced-vibration amplitude to varying degrees, but there is no clear pattern in the degree of influence of different turbulent wind fields on the vortex-induced-vibration amplitude as shown in Fig. 140.
Wei (2023) utilized a three-degree-of-freedom coupled vibration test rig to conduct wind tunnel sectional model force and vibration tests for wind attack angles ranging from 0° to 90°. The turbulence intensity has a more significant impact on the vibration response of the H-section than the turbulence integral scale. Under turbulent wind fields, not only is the vibration pattern of the H-section altered, but vortex-induced-vibrations and galloping can also be excited. Yan (2023) compared the turbulent wind fields with different turbulence intensities and different turbulence integral scales. From Fig. 141, it was found that the incoming turbulence has a certain inhibitory effect on the vortex-induced-vibrations of the sectional model at a 0° attack angle, and the impact of the turbulence intensity is greater than that of the turbulence integral scale.
![]() Figure 141. Effect of turbulence intensity (left) and turbulence integral scale (right) on vortex vibration.
Figure 141. Effect of turbulence intensity (left) and turbulence integral scale (right) on vortex vibration.Gao et al. (2023) investigated the influence of mass damping parameter on the galloping of H-type cross-sections with a small width-to-height ratio. It was observed that the model exhibited vortex-induced-vibrations at attack angles of 30° and 90° and galloping at attack angles of 0° and 70° as shown in Fig. 142. These findings were largely consistent with the results predicted by the Den Hartog criterion, indicating that this criterion remains applicable even at larger attack angles.
![]() Figure 142. Dimensionless steady-state amplitude response under different wind angles of attack under a working condition.
Figure 142. Dimensionless steady-state amplitude response under different wind angles of attack under a working condition.It is evident that different incoming wind flows can enhance the dissipation of vortex circulation, thereby leading to a reduction in vortex intensity. In turbulent inflow, the motion state of the fluid becomes quite complex, with frequent and intense fluctuations in velocity and pressure. Such fluctuations accelerate the process of energy dissipation, promoting the rapid conversion of kinetic energy within the vortex into internal energy, thus diminishing the vortex intensity. Moreover, turbulent inflow significantly reduces the spanwise coherence of the vortex-induced forces, implying that the interactions between vortices become more random and disordered. This reduction in coherence can effectively decrease the structural vortex-induced-vibration response, thereby preventing potential damage caused by structural resonance.
Wind characteristic parameter acting on bridge structures along the bridge span direction may exhibit non-uniformity in the spanwise direction. Such non-uniform wind fields can disrupt the periodic vortex shedding from the bridge surface. Drawing on this vibration suppression concept, the turbulence control theory has been proposed, and the disturbance flow characteristics around the bridge cross-section have been systematically analyzed through wind tunnel tests and numerical simulations.
6.2.3 Aerodynamic shape (strouhal number)
6.2.3.1 Typical steel box girder cross-section
Guan et al. (2014) conducted wind tunnel tests to study the vortex-induced-vibration responses of bridge cross-sections with and without railings. The experimental study indicated that: the bare beam cross-section did not experience vortex-induced-vibrations in the wind tunnel tests, and the fluctuating pressure on the upper and lower surfaces contributed little to vortex-induced-vibrations; in contrast, the cross-section with railings exhibited a significant vertical vortex-induced-vibration phenomenon, with the fluctuating pressure on the middle and downstream of the upper and lower surfaces contributing more to the vortex-induced-vibrations. Kang et al. (2023) studied the vortex-induced-vibration performance of a streamlined steel box girder through sectional model wind tunnel tests. The study found that: the original design cross-section exhibited vertical bending and torsional vortex-induced-vibrations exceeding the regulatory limit values in the bridge completion state as illustrated from Fig. 143.
![]() Figure 143. The influence of the wind fairing on the vortex vibration of the bridge. (a) Vertical vortex. (b) Torsional vortex.
Figure 143. The influence of the wind fairing on the vortex vibration of the bridge. (a) Vertical vortex. (b) Torsional vortex.6.2.3.2 Separated box section (P-K section)
Laima et al. (2015) conducted sectional model experiments to study the effect of the spacing between separated double-box girders. Wei (2022) conducted wind tunnel tests and numerical simulations to explore the causes of vortex-induced-vibrations in separated double-box girders and the effects of slot width and the position of the maintenance car track on their vortex-induced-vibration performance. Five different slot widths and eight different positions of the maintenance car track were selected for the study. The results are shown in Fig. 144. It was found that the impact of the maintenance car track position on vortex-induced-vibration performance is related to the slot width. The smaller the difference in the contribution value of vortex-induced forces between the downstream box girder upper surface and the inclined webs at the downstream box girder slot, the larger the torsional amplitude of the model.
![]() Figure 144. Torsional vortex locking interval and amplitude of the model under different groove widths. (a) Lock the interval. (b) Maximum torsion angle.
Figure 144. Torsional vortex locking interval and amplitude of the model under different groove widths. (a) Lock the interval. (b) Maximum torsion angle.He et al. (2024) conducted wind tunnel experiments to study the effects of different slotting ratios on the vortex-induced-vibrations of separated double-box girders. The results indicated that reducing the slotting ratio can improve the performance of vertical bending vortex-induced-vibrations, but it does not show significant improvement for torsional vibrations. Cao (2024) conducted wind tunnel tests on six different slot widths, five different inclined web angles, and seven different maintenance car track positions to summarize the influence of aerodynamic shape changes on the vortex-induced-vibration performance of the PK beam. The results of the single-variable experiments showed that changes in all three conditions had a significant impact on the vortex-induced-vibration performance of the main beam.
Qu (2015) analyzed a cable-stayed bridge with a π-shaped main beam cross-section as the background. Based on the force and vibration measurements of the main beam sectional model in the wind tunnel tests, numerical simulation was used to compare the static lift, drag, and moment coefficients of the main beam. The use of the wind fairing was suggested to improve the vortex shedding characteristics of the main beam cross-section. Zhang (2015b) used the π-shaped main beam cross-section to study the impact of the railing ventilation rate on the vortex-induced-vibrations of the π-shaped bridge cross-section through wind tunnel tests. The research identified optimized railing cross-sections, parameterized height factors λ, reasonable inclination angles θ, and ventilation rates φ to suppress the vortex-induced-vibrations of the π-shaped bridge cross-section. An illustration of the tested results is given in Fig. 145.
![]() Figure 145. Diagram of vertical displacement variation of π-shaped bridge section with different railing heights.
Figure 145. Diagram of vertical displacement variation of π-shaped bridge section with different railing heights.Li (2019) conducted a study on the vortex-induced-vibration response of the main beam with a π-shaped cross-section for cable-stayed bridges. The initiation wind speed and range length for low-speed torsional vortex-induced-vibrations showed no clear pattern with the increase of the cross-sectional B/H, but the maximum torsional angle decreased as B/H increased as indicated from Fig. 146.
![]() Figure 146. Original section amplitude-wind speed curves of π-shaped beams with different aspect ratios under wind attack angles. (a) Reduced displacement amplitude. (b) Reduced torsion amplitude.
Figure 146. Original section amplitude-wind speed curves of π-shaped beams with different aspect ratios under wind attack angles. (a) Reduced displacement amplitude. (b) Reduced torsion amplitude.Wang (2021) conducted wind tunnel experiments to study the effect of wind fairings on the vortex-induced-vibration response of a π-shaped cross-section for different forms of wind fairings. The research results indicated that the vibration suppression effect of the wind fairing is related to both the extension length l of the wind fairing and the relative height h to the beam height. Overall, the smaller the value of h/l, the better the vibration suppression effect. Pan (2021) focused on the π-shaped main beam, employing both wind tunnel testing and numerical simulation as research methods. The research results from Fig. 147 indicated that the width-to-depth ratio primarily affects the second lock-in range, with the length of the range and the reduced amplitude peak gradually increasing as the width-to-depth ratio increases. As the mass ratio increases, the amplitude peaks of both lock-in ranges decrease almost linearly, while the range length first increases and then decreases.
![]() Figure 147. Vertical bending, torsional vortex response of π-shaped girder with different aspect ratios. (a) Reduced amplitude. (b) Torsional amplitude.
Figure 147. Vertical bending, torsional vortex response of π-shaped girder with different aspect ratios. (a) Reduced amplitude. (b) Torsional amplitude.Li et al. (2021c) utilized existing wind tunnel test results to verify the CFD calculation model for vortex-induced-vibration responses. The results are presented in Fig. 148. The study found that the vortex-induced-vibration response of π-shaped beams is nonlinear with respect to both shape parameter. The influence of these two shape parameter on the vortex-induced-vibration response can further guide the selection and optimization of aerodynamic measures.
![]() Figure 148. Effect of shape parameter. (a) Vertical dimensionless eddy amplitude. (b) Wind speed of initiation and reduction. (c) Length of the vertical vortex wind velocity region.
Figure 148. Effect of shape parameter. (a) Vertical dimensionless eddy amplitude. (b) Wind speed of initiation and reduction. (c) Length of the vertical vortex wind velocity region.Xing (2024) investigated the influence of the width-to-height ratio on the dual lock-in range characteristics of vortex-induced-vibrations for a π-shaped cross-section and found that the width-to-height ratio significantly affects the amplitude peak, lock-in range length, and the wind speed at the end of the initiation within the high wind speed vortex-induced-vibration area. As the width-to-height ratio decreases, both the vertical bending and torsional vortex-induced-vibration peaks show a downward trend, and the lock-in range length shortens, but the impact on the low wind speed vortex-induced-vibrations is minimal.
Li et al. (2022c) conducted sectional model vibration wind tunnel tests to measure the dimensionless vortex-induced-vibration amplitudes of single-layer and double-layer steel box girders under various conditions. The study found that the impact of girder spacing on the vortex-induced-vibration characteristics of double-layer steel box girders is related to the wind attack angle in the wind tunnel tests. At negative wind attack angles as illustrated in Fig. 149, no obvious vortex-induced-vibration phenomena were observed, indicating better vortex-induced-vibration characteristics.
![]() Figure 149. Illustration of negative wind angle of attack test results. (a) Vertical displacement Ar. (b) Torsion φr.
Figure 149. Illustration of negative wind angle of attack test results. (a) Vertical displacement Ar. (b) Torsion φr.Dong (2023) conducted synchronized vibration and pressure measurement wind tunnel tests and three-dimensional numerical simulation analyses using rigid sectional models with different trellis ventilation rates, heights, and cantilever lengths. The study investigated the impact of L-shaped trellises on the vortex-induced-vibration performance of pedestrian bridges. It was found that the main beam without a trellis exhibited significant vertical bending vortex-induced-vibrations when facing the wind from different sides. Li et al. (2023c) found in their wind tunnel tests studying the impact of decorative trellises on bridge vortex-induced-vibration performance that decorative trellises significantly alter the bridge's vortex-induced-vibration performance. Considering the spatial variation of the overall trellis, the vortex-induced-vibration performance of the bridge after installing spatial decorative trellises was significantly better than that of the no-trellis state.
He (2015) focused on two main types of ice accretion on the main beam. Icing sectional models were made for each type and force measurement wind tunnel tests and vibration measurement wind tunnel tests were conducted, considering the three-force coefficients, flutter, and vortex-induced-vibrations.
The aerodynamic shape of non-main beam cross-sections, the open hole ratio and positioning of the hangers, the cable shape including the presence of helical strands, the bridge tower including the sectional form of the tower and the influence of crossbeams, as well as measures such as the addition of stabilizing flow plates or fairings.
Bai et al. (2020b) used sectional model vibration tests and CFD numerical simulation methods to study the impact of the open area ratio on the aerodynamic performance of hangers when the web and the flange are perforated separately at a low open area ratio, as well as when both the web and the flange are perforated simultaneously. To avoid the risk of buckling instability that may occur in the perforated section, for the first time, they proposed a vibration suppression measure of setting aerodynamic stabilizer plates on both sides of the web as illustrated in Fig. 150. The study found that perforating both the web and the flange can eliminate galloping, it will produce vertical bending vortex-induced-vibration phenomena.
Wei (2023) utilized a three-degree-of-freedom coupled vibration test rig to conduct wind tunnel sectional model force and vibration tests for wind attack angles from 0° to 90°. Different force coefficients and wind-induced vibration responses under various wind attack angles were obtained. It was found that the vibration phenomenon of the H-type hanger without openings is more complex at a 0° attack angle, and soft flutter occurs at a 30° attack angle.
The aerodynamic shape has a significant impact on the initiation wind speed, lock-in range, amplitude, and other parameter of vortex-induced-vibrations in bridge structures. Changes in the aerodynamic shape can lead to changes in the Strouhal number of the structural cross-section, which is an important factor affecting the vortex-induced-vibration performance. The magnitude of the Strouhal number determines the frequency of vortex-induced-vibrations. If the fluid flow speed or the geometric characteristics of the bridge change, the Strouhal number will also change, thereby affecting the vibration characteristics of the bridge. For example, compared with closed box girders, the torsional vortex-induced-vibration performance of open box girders tends to deteriorate with increasing slot width. The width-to-height ratio of the π-shaped cross-section has a greater impact on the vortex-induced-vibration characteristics at high wind speeds than at low wind speeds. An aerodynamic measure to suppress turbulence by setting inverted L-shaped guide vanes in the direction of the incoming wind on the main beam of the π-shaped section has been proposed.
6.2.4 Reynolds number
Li et al. (2009b) conducted a study analyzing the surface pressure to investigate the distribution of the mean pressure coefficient and the fluctuating pressure coefficient on the model surface during vortex-induced-vibrations. The research also examined the impact of Reynolds number on the distribution of mean and fluctuating pressure coefficients during vortex-induced-vibrations. Chen (2009) conducted wind tunnel experiments to study the effect of Reynolds number on the amplitude of vortex-induced-vibrations and the Reynolds number effect on the vibration power spectrum of vortex-induced-vibrations. The analysis of the fluctuating pressure distribution diagrams of large and small models shows that the maximum value of the fluctuating pressure coefficient on the upper and lower surfaces of both large and small models appears at the position of the minimum pressure coefficient, where the airflow separation and pressure fluctuations are large. The magnitude of the fluctuating pressure coefficient is generally higher at low Reynolds numbers than at high Reynolds numbers, but it does not completely follow this pattern. Liu and Cui (2010) studied the Reynolds number effect on the Strouhal number of bridge cross-sections by adjusting the test wind speed to change the Reynolds number and arranging pressure measurement points on the model surface for wind tunnel tests.
Cui et al. (2011) conducted research on the Reynolds number effect of vortex-induced-vibration for quasi-streamlined bridge cross-sections. The research findings indicated that the Reynolds number effect on the fluctuating pressure spectrum leads to a similar effect on the torque coefficient time history, which in turn triggers the Reynolds number effect on the vibration spectrum as shown in Figs. 151 and 152. The study suggests that the characteristics of vortex-induced-vibrations are influenced by the Reynolds number, which is a critical parameter in understanding and predicting the aerodynamic behavior of bridge structures under different flow conditions.
![]() Figure 151. Frequency corresponding to the maximum amplitude of the pressure pulsation spectrum. (a) Upper surface. (b) Lower surface.
Figure 151. Frequency corresponding to the maximum amplitude of the pressure pulsation spectrum. (a) Upper surface. (b) Lower surface.![]() Figure 152. Spectral amplitude of each measurement point corresponding to the eddy frequency. (a) Upper surface. (b) Lower surface.
Figure 152. Spectral amplitude of each measurement point corresponding to the eddy frequency. (a) Upper surface. (b) Lower surface.Cui (2012) studied the Reynolds number effect on the vortex-induced response of streamlined bridge cross-sections and cantilevered cross-sections by changing the model scale. Experiments revealed significant Reynolds number effects on both torsional vortex-induced-vibration and vertical bending vortex-induced-vibration. The results of the vortex-induced-vibration wind tunnel tests at low Reynolds numbers were more conservative, suggesting that the vortex-induced-vibration phenomena observed in wind tunnel tests might not occur in actual bridges. From a safety perspective, the results of vortex-induced-vibration tests at low Reynolds numbers can be used, but this may lead to economic waste. However, Li et al. (2014) showed that when the Reynolds number was between 5.85 × 10³ and 1.12 × 10⁵, the peak amplitude of vortex-induced-vibration increased with the increase of the Reynolds number.
Guan et al. (2013) selected a typical bridge cross-section as the research object, and compared and analyzed the similarities and differences between the vortex-induced-vibration of large and small scale models and aerodynamic suppression, considering the Reynolds number effect as the intrinsic reason for the different vortex-induced-vibration responses. Zheng (2021) validated the aerodynamic degradation model of cylinder vortex vibration near the critical Reynolds number through examples, showing good consistency with existing literature. However, the method failed to establish on rectangular cross-sections. By processing the aerodynamic data obtained from vortex vibration simulation, it was observed that the displacement time history curve and the sectional PSD transformation under different wind speeds not only clearly distinguished between vortex and non-vortex wind speeds but also revealed two different vortex development mechanisms under vortex wind speeds.
Wang (2022c) analyzed the different separation angles of cylinder flow under different Reynolds numbers, and found that at certain range, the separation angle generally tends to decrease with the increase of Reynolds number. The lift coefficient of the downstream cylinder is always greater than that of the upstream cylinder, and the calculation results are basically consistent with other literature. Liu (2023b) compared the vibration test results of the 1:70 small-scale sectional model and the 1:30 large-scale sectional model of the separated box girder, and discussed the Reynolds number effect of the vortex plate aerodynamic measure. The results show that the cross-section models match well in the locking range and amplitude of vertical bending and torsional vortex vibration. However, the vertical vortex vibration response amplitude of the large-scale sectional model with the same ventilation rate of the vortex plate measure is slightly larger than that of the small-scale model. This is due to the Reynolds number effect of the vortex plate, that is, even with the same ventilation rate, the effective ventilation rate of the large-scale model will be greater when the small-scale model is scaled up to the large-scale model.
The pressure distribution on the structure's surface, aerodynamic forces, vortex shedding frequency, and the peak value of the main beam's vortex vibration all exhibit significant Reynolds number effects. Increasing the test wind speed or using a larger scale model can increase the Reynolds number, and a higher Reynolds number typically implies that the inertial effects of the fluid are dominant, which often leads to stronger vortex separation and complex vortex vibration behavior. On the other hand, a lower Reynolds number more clearly demonstrates the viscous effects, which may weaken the structure's vortex vibration response.
From the above studies, it can be seen that changing the structure's Reynolds number can be achieved by altering the geometric dimensions of the structure and adjusting the wind field wind speed, thereby causing changes in the structural vortex vibration response. At low Reynolds numbers (for example less than 1000), the flow is often laminar, and the formation of vortex vibration is more stable. At high Reynolds numbers (such as more than 10000), the flow may transition to turbulence, which can trigger irregular vortex vibrations, causing the bridge to experience more intense vibrations.
6.3 Methods for suppressing vortex-induced-vibration
6.3.1 Mechanical vortex suppression measures
Mechanical measures involve increasing the structural damping or adding additional weights to enhance the aerodynamic stability of the structure and reduce wind-induced vibrations. TMDs are an effective passive method for suppressing vortex-induced-vibrations on bridges. Farhangdoust et al. (2020) proposed a bi-stable tuned mass damper (BTMD) that exhibits good sensitivity to vortex shedding frequencies over a wide bandwidth. Through Monte Carlo simulations, it was demonstrated that the performance of the nonlinear BTMD is superior to that of traditional linear TMDs under both harmonic (sine) and broadband vortex-induced excitations. Cinquemani et al. (2016) discussed the design and testing of a smart aerodynamic model for a suspension bridge, which can actively adjust torsional damping using embedded devices.
Bai et al. (2016c) have provided a method and device for controlling the vibration of bridge towers as illustrated in Fig. 153. By suspending a damping vibration reduction device and utilizing the whip effect of the damping device, the energy of the bridge tower's vibration is dissipated. This patent achieves a comprehensive approach to suppressing possible vortex-induced-vibrations of the bridge tower by integrating measures such as mass pendulum (whip effect), disturbance excitation sources, and increased damping. Moreover, the construction is simple, the cost is low, and the effect is significant, offering broad application prospects in the suppression of bridge tower vibrations.
Bai et al. (2023a) attempted to suppress the wind-induced vibration of bridge towers using underwater dampers. Through numerical calculations and experiments, the effects of different opening rates, hole sizes, and shapes on the suppression effect of the underwater dampers were studied as illustrated in Fig. 154. Dampers with different open-mouth shapes can all generate significant resistance, so there are multiple choices for the style of the damper. Underwater dampers, due to their low cost and convenient installation and removal, are particularly suitable for bridges that only require short-term wind vibration control during the construction period.
Based on the results of the wind tunnel test and the analysis of the TMD dampers, recommendations for the parameter of the TMDs of the main bridge, east channel bridge, and west channel bridge of Xiamen's Second East Channel have been made in the report on the wind resistance of xiamen second east passage bridge and wind tunnel test study (CUWTL, 2018). Tuned liquid dampers (TLDs) are relatively new devices in the application of buildings and structures, but similar devices have been used in the marine and aerospace fields for many years. A TLD is a rectangular water tank fixed to the bridge tower (usually at the top) as illustrated in Fig. 155, which can be a large water tank or a combination of several tanks. When the bridge tower vibrates under the action of the wind, it will drive the water tank to move together. The movement of the water tank will cause the water inside to slosh, and the surface waves will be generated. The pressure difference of the water and waves on the container wall constitutes the vibration reduction force for the structure. It is similar to the principle of tuned mass dampers, both providing a damping vibration system with a larger mass connected to the main system. However, the mass, stiffness, and damping of the additional system are all provided by the moving liquid. The stiffness comes from gravity, and the energy dissipation comes from energy-consuming mechanisms such as viscous boundary layers, incoming turbulence, or wave breaking, depending on the system type. Yan (2017) conducted research on wind-induced vibration control measures for bridge towers as shown in Fig. 156. The author concluded that the application of TLDs in a self-standing configuration effectively reduces the amplitude of pylon vibration acceleration (Fig. 157). It is found that the TLD is most effective when placed at the position of maximum vibration amplitude of the target mode shape.
![]() Figure 156. Wind-induced vibration control measure. (a) Pylon with mounted tank on the beam. (b) Pylon with mounted tank on the column.
Figure 156. Wind-induced vibration control measure. (a) Pylon with mounted tank on the beam. (b) Pylon with mounted tank on the column.![]() Figure 157. Comparison of the acceleration amplitude before and after applying TLDs. (a) No measure acceleration spectrum. (b) Acceleration spectrum with TLD measures applied.
Figure 157. Comparison of the acceleration amplitude before and after applying TLDs. (a) No measure acceleration spectrum. (b) Acceleration spectrum with TLD measures applied.6.3.2 Aerodynamic measures
Chang'an University Wind Tunnel Laboratory research group has proposed the principle of turbulence suppression and the use of turbulence-generating devices as vibration control measures, providing effective reference measures for wind resistance of bridges in special regions. They analyzed the application of closed bridge deck railings, guide vanes, stabilizing plates, and new types of turbulence-generating devices in bridge wind resistance research by combining wind tunnel tests with numerical simulations. In response to the issues of low flutter critical wind speeds and susceptibility to vortex-induced-vibrations in super-long span bridges, they proposed the research idea of turbulence suppression. By setting turbulence-generating devices at appropriate positions on the bridge cross-section, local turbulence can interfere with the periodic shedding of vortices from the bridge surface, thereby suppressing vortex-induced-vibrations.
6.3.2.1 Typical steel box girder cross-section
Guan (2016) conducted wind tunnel tests to examine the vortex-induced-vibration performance of large-span pedestrian suspension bridges with stiffened girders. Vortex-induced-vibration tests were conducted on various aerodynamic cross-sections of stiffened girders and extreme states of the cross-sections. Zhao et al. (2021) used a 1:50 sectional model for wind tunnel tests to study the vortex-induced-vibration response of steel box girders under different wind attack conditions. A 1:150 full-bridge aerodynamic elastic model was also constructed and used to study the aerodynamic stability and characteristics of the entire bridge under different flow fields at various wind attack angles. The results showed that sharp-edged wind attacks have a certain inhibitory effect on the vortex-induced-vibration amplitude of steel box girder cable-stayed bridges. Dang (2021) took a typical straight-web steel box girder as the research object and studied its vortex-induced-vibration performance and the vibration suppression effect of aerodynamic measures on railings through wind tunnel vibration tests. The test results from Figs. 158 and 159 indicated that the aerodynamic stability of the cross-section of this straight-web steel box girder in its completed bridge state is poor. The vibration state of the sectional model is strongly affected by the wind attack angle, with vertical bending vortex vibrations occurring under positive wind attack angles and torsional vortex vibrations under negative attack angles.
![]() Figure 158. Vortex amplitude of the original steel box girder section. (a) Vertical bending vortex result. (b) Torsional results.
Figure 158. Vortex amplitude of the original steel box girder section. (a) Vertical bending vortex result. (b) Torsional results.![]() Figure 159. The amplitude of the vortex amplitude of the box girder section after the closed railing. (a) Vertical bending vortex result. (b) Torsional results.
Figure 159. The amplitude of the vortex amplitude of the box girder section after the closed railing. (a) Vertical bending vortex result. (b) Torsional results.Wang (2022a) designed rigid models of steel box girder bare beam segments with four different height-to-width ratios. Through vibration measurement wind tunnel tests, the study compared the vibration suppression effects of inverted L-shaped flow deflectors with different characteristic parameter on steel box girders with different height-to-width ratios as shown in Fig. 160.
![]() Figure 160. The application of inverted L deflector in steel box girder and the effect of inverted L deflector on the vertical bending vortex vibration of steel box girder with a height-to-width ratio of 1:6 of various sizes.
Figure 160. The application of inverted L deflector in steel box girder and the effect of inverted L deflector on the vertical bending vortex vibration of steel box girder with a height-to-width ratio of 1:6 of various sizes.6.3.2.2 Separated box girder cross-section (P-K cross-section)
Bai et al. (2010d) and Zhou (2010) took the separated box girder cross-section of the main beam of the Hong Kong–Zhuhai–Macao Bridge's direct waterway bridge as the research object and used wind tunnel tests as the research method. The study found that after the installation of wind barriers, although the amplitude of vortex-induced-vibrations was significantly reduced, when the wind speed was high, the amplitude of vortex-induced-vibrations was still large and did not meet the specifications. Wind barriers can be used as auxiliary measures for other aerodynamic measures as illustrated in Fig. 161. It was also found that the addition of bottom plates with different slotting rates can effectively suppress the vortex-induced-vibrations of separated box girders, but it is not the case that the smaller the slotting rate, the better, or the larger the slotting, the better. At the same time, the setting of guide vanes can effectively suppress vortex resonance, especially when the guide vanes are set on both sides of the box girder, the suppression effect is significant as shown in Fig. 162.
![]() Figure 161. Application of typical pneumatic measures in P-K sections. (a) Inverted L deflector. (b) External anti-collision guardrail is fully enclosed. (c) Horizontal deflector and lower central stabilizer plate.
Figure 161. Application of typical pneumatic measures in P-K sections. (a) Inverted L deflector. (b) External anti-collision guardrail is fully enclosed. (c) Horizontal deflector and lower central stabilizer plate.![]() Figure 162. Effect of inverted L deflector at different heights under the same horizontal width on the vortex suppression effect of the separation box section. (a) Torsion. (b) Vertical bend.
Figure 162. Effect of inverted L deflector at different heights under the same horizontal width on the vortex suppression effect of the separation box section. (a) Torsion. (b) Vertical bend.Xin and Wu (2015) conducted a study investigating the effects of three aerodynamic measures, guide vanes, inclined webs, and fairings, on the vortex-induced-vibrations of cable-stayed bridges with a main beam design of separated box girders. The experimental results indicated that guide vanes of different lengths and inclined webs of different angles can effectively control vortex-induced-vibrations. Comparatively, installing baffles on both sides of the inclined webs has a better effect on suppressing vortex resonance. Zhu (2021) proposed a novel vortex suppression measure using dual lower central stabilizing plates for the vortex-induced-vibration phenomenon of separated double-box girders. Zhao (2022) studied the vortex-induced-vibration response of a large-span pedestrian suspension bridge with a double-box girder central grillage cross-section and compared the vortex-induced-vibration response of different grillage arrangements and different grillage opening rates with the original cross-section using a sectional model wind tunnel vibration test. The results showed that both the grillage opening rate, and the arrangement of the grillage have an impact on the vortex-induced-vibration performance of the main beam, with the grillage opening rate having a greater influence than the arrangement form.
Xiao (2022) employed a synchronous pressure and vibration measurement test method to study the vortex-induced-vibration characteristics of separated double-box girders under two aerodynamic measures-inverted L-shaped flow deflectors and dual lower central stabilizing plates, as well as their combined effect. It was found that the inverted L-shaped flow deflectors have a good suppression effect on torsional vortex vibrations, with the width of the horizontal plate playing a major role. Xu (2023) explored the impact of wind barriers on the vortex vibration performance of separated double-box girders, designing five wind barrier rates and four height ratios for wind barrier combinations to conduct wind tunnel tests and numerical simulation studies. Shi (2023) studied the influence of the characteristic dimensions of inverted L-shaped flow deflectors on the vortex-induced-vibration of separated double-box girder cross-sections through wind tunnel tests. Within a certain width-to-height ratio range, the extreme value of vertical bending vortex vibration showed a nonlinear trend of decreasing and then increasing and then decreasing again with the increase of the width-to-height ratio. For torsional vortex vibration, the extreme value of torsional vortex vibration decreased with the increase in size of the vertical plate or horizontal plate.
6.3.2.3 π-shaped cross-section
Qu (2015), taking a cable-stayed bridge with a π-shaped main beam cross-section as the background, proposed an assembled main beam cross-section combination design form. Based on the separate aerodynamic force and vibration wind tunnel tests of the main beam sectional model, different aerodynamic measures were selected for the assembly combination of the main beam. The results showed that: (1) the railing has a significant impact on the wind resistance performance of the main beam cross-section; (2) the central stabilizing plate has a significant impact on improving the wind stability of the π-shaped cross-section. Li (2019) used wind tunnel testing and numerical simulation methods to study the vibration suppression effects of different aerodynamic measures on the main beam of a cable-stayed bridge with a π-shaped cross-section. Wang (2020) conducted a synchronous vibration and pressure measurement wind tunnel vibration suppression test study on the typical double-sided box-shaped π cross-section. Aerodynamic measures (Fig. 163) such as inverted L-shaped guide vanes, lower central stabilizing plates, and wind fairings were selected for the study. The effect of the inverted L-shaped guide vanes is significant on suppressing the vibration amplitude of the deck as indicated from Fig. 164. The aerodynamic measures can improve the vortex vibration performance of the cross-section by changing the flow field around the deck.
![]() Figure 163. Illustration of aerodynamic measures (unit: cm). (a) Wind fairing in π-shaped cross-section. (b) Lower central stabilizer plate in the π-shaped cross-section. (c) Inverted L-shaped deflector in π-shaped cross-section.
Figure 163. Illustration of aerodynamic measures (unit: cm). (a) Wind fairing in π-shaped cross-section. (b) Lower central stabilizer plate in the π-shaped cross-section. (c) Inverted L-shaped deflector in π-shaped cross-section.![]() Figure 164. The effect of the inverted L-shaped inverter plate on the vortex vibration. (a) Torsion. (b) Vertical bend.
Figure 164. The effect of the inverted L-shaped inverter plate on the vortex vibration. (a) Torsion. (b) Vertical bend.Xiong (2021) conducted wind tunnel vibration tests to study the vortex-induced-vibration characteristics of a typical cantilevered box-shaped π cross-section main beam. The study compared the vibration suppression effects of inverted L-shaped guide vanes with different cantilever extension coefficients on the original cross-section. The results showed that the cantilever extension coefficient has limited optimization effect on the aerodynamic shape of the original π-shaped main beam cross-section. Yin (2024) found that the bilateral arrangement and unilateral arrangement of L-shaped guide vanes of different sizes can both suppress the vertical vortex vibration of a dual-span π-shaped cable-stayed bridge. When the size of the L-shaped guide vanes is large, both arrangement schemes can provide good vibration suppression effects for both bridge decks. Bai et al. (2016a) proposed an aerodynamic structure for vortex-induced-vibration of cylindrical cable stays. This structure is achieved by adding flow disturbance plates to the cylindrical cable stays (Fig. 165), which can significantly improve the wind resistance of the cable stays and reduce the vortex-induced forces experienced by the cable stays.
For the vortex vibration phenomenon occurring on box-shaped cross-sections, measures such as changing the aspect ratio of the box-shaped section and setting wind fairings to alter the permeability of the railing are generally taken to change the aerodynamic shape of the box-shaped section and suppress vortex vibrations. In contrast, separated box and π-shaped main beams are more sensitive to flow disturbance measures such as wind fairings, inverted L-plates, and lower central stabilizing plates. The innovatively proposed principle and measures of turbulence suppression such as inverted L-plates, enclosed bridge deck railings, flow disturbance plates, stabilizing plates, etc., have been successfully applied to several large-span bridges in special areas.
6.3.3 Structural measures
For a suspension bridge under construction, the catway structure is typically long, lightweight, and flexible, making it sensitive to dynamic actions. Measures must be taken to enhance its wind-induced vibration stability. Li (2007) studied two vibration suppression measures: connecting ropes and external cables, to determine their roles in the catway and establish guidelines for their placement within it through data analysis. The damping of the connecting ropes is a key factor in their vibration suppression effectiveness. It is found that adding external cables can improve the torsional stiffness of the catway, both in terms of overall and local stiffness. External cables can reduce the twist angle of the catway under wind load, thereby raising the critical wind speed for static wind-induced divergence. To prevent vortex shedding inside and downstream of the catway and similar mesh structures, it is recommended that the side net permeability be designed to be above 70%. Jia (2008) used a combination of static force wind tunnel tests and finite element analysis to conduct a nonlinear static wind response analysis of the catway. Xue et al. (2015) proposed a damping-assisted cable vibration reduction system based on damping auxiliary cables. This system can overcome the shortcomings of steel wire rope auxiliary cables, which have low additional damping, and the hard impact damage that cable clamps can cause to the cable stays during cable net vibration.
6.4 Amplitude limit of vortex-induced-vibration
China's Wind-resistant Design Specification for Highway Bridges (Ministry of Transport of the People's Republic of China, 2018) provides threshold limits for the amplitude of vortex-induced-vibrations in bridges, but these indicators are only applicable to highway bridges with a span of 200 m or less. Scholars have conducted numerous studies from the perspectives of bridge structural safety and the comfort of traffic and pedestrians.
6.4.1 Comfort and structural safety
Zhao et al. (2022) conducted research on the vortex-induced-vibration amplitude limits for a large-span railway bridge, considering its traffic characteristics and performance requirements, and found that the results are more stringent than the requirements. Chen et al. (2015) analyzed the vertical bending vortex-induced-vibration limits of large-span bridges considering the impact of human comfort and traffic safety based on the evaluation methods for human body tolerance to whole-body vibration and the requirements for driving visibility. The research findings indicate that human comfort is a factor that must be considered when determining the vertical bending vortex-induced-vibration limits of bridges.
Che (2013) carried out a comfort assessment for positions on the bridge tower that need to consider human comfort under self-standing conditions. The comfort assessment took into account the influence of acceleration based on the dynamic sensitivity coefficient mentioned in the Design Manual for Roads and Bridges (Ministry of Transport of the People's Republic of China, 2018). Based on the principle of cumulative fatigue damage, the wind-induced fatigue life of the bridge tower structure was analyzed, and the wind-induced fatigue life without considering vortex-induced-vibrations and with considering vortex-induced-vibrations was compared. When not considering vortex-induced-vibrations, the wind-induced fatigue life of the steel bridge tower is 125 years, while considering vortex vibrations, the fatigue life is 121.46 years. Zhang (2012) conducted research on the allowable amplitude values of vortex-induced-vibration for steel bridge towers and the relationship between these allowable amplitude values and the height of steel tower columns. The study found that when the vortex vibration amplitude reaches the maximum allowable value, the stress in the cross-section caused by the vibration, as a ratio of the material's allowable stress, can be used as a basis for calculation.
6.4.2 Aesthetic bridge vortex-induced-vibration amplitude
For aesthetic bridges, pedestrians are more sensitive to bridge vibrations. Under the combined action of crowds and wind loads, the evaluation of vibration comfort for aesthetic and irregular bridges becomes more complex. Therefore, establishing appropriate vortex-induced-vibration amplitude limit criteria for aesthetic bridges is an important issue that needs to be addressed in bridge design and operation and maintenance.
A study on wind resistance performance of irregular bridges was jointly performed by Chang'an University Wind Tunnel Laboratory research team and Lin Tongyan International Engineering Consulting (China) Co., Ltd. The project focused on the issue that the current Wind-resistant Design Specification for Highway Bridges (Ministry of Transport of the People's Republic of China, 2018) vortex-induced-vibration limit standards are not suitable for irregular aesthetic bridges and conducted research on the evaluation criteria for vortex vibration limits. The project evaluated the vortex vibration limit standards for irregular bridges from two aspects: pedestrian comfort and structural safety. From the perspective of pedestrian comfort, the study compared the calculation methods provided in the British specification (BD 49/01), the German guideline (RFS2-CT-2007-00033), and the French design guide (σ). Considering multiple perspectives, the study proposed a calculation method for the vertical bending vortex-induced-vibration amplitude limits of aesthetic pedestrian bridges based on peak acceleration values and structural safety.
6.4.3 Public concern
Vortex-induced-vibrations can occur at relatively low wind speeds, and due to the low fundamental frequency of large-span bridges, the allowable amplitude of vortex vibrations calculated by current standard formulas has a relatively large absolute value. In addition to ensuring structural safety, when setting the vortex-induced-vibration limit targets for bridges, it is necessary to consider not only structural safety and durability but also the comfort and safety of vehicle traffic. This means that vibrations should not cause a decrease in the driver's safe viewing distance due to vibration, should not cause discomfort to drivers, and should avoid social public sentiment caused by public concern.
On May 5, 2020, the Humen Bridge experienced abnormal vibrations. Major media outlets reported on this incident, which quickly spread widely across various platforms in China, causing panic and heated responses among netizens. Although the amplitude of the vortex-induced-vibrations was within the allowable limits and did not pose safety and durability issues for the structure of the suspension bridge, public still had doubts about the safety of the bridge construction and the structure itself. For this case, the wind-induced vibration wind tunnel tests on the Humen Bridge were carried out by Chang'an University Wind Tunnel Laboratory. Effective vibration control measures were proposed to suppress the vortex-induced-vibration.
On the afternoon of April 26, 2020, several car owners in Wuhan reported that while driving through the Yingshuzhou Yangtze River Bridge (Fig. 166), the bridge body exhibited a wavy oscillation, causing dizziness and raising serious concerns about the safety of the bridge. According to the monitoring data, the bridge experienced vibrations with a short duration. It was concluded that the abnormal vibration of the bridge was caused by specific wind conditions, and the amplitude was within the allowable range of the design.
7. Wind environment on bridge decks
7.1 Introduction
The effect of wind loads on bridges is primarily determined by key wind characteristics such as wind speed, wind direction, turbulence, and gusts (Simiu and Scanlan, 1996). The complexity and variability of these parameter require engineers to conduct in-depth studies of the wind environment at the design stage to ensure that the bridge can adapt to various wind conditions. Key factors of the wind environment on the bridge deck include uneven wind speed distribution, which affects the force conditions of the bridge. Local changes in wind direction, determining the direction of the bridge's force, with different impacts from lateral and vertical winds; different levels of turbulence intensity, which directly relate to the bridge's vibration characteristics, with high turbulence intensity potentially causing greater vibrations. And vortex shedding, especially vortices formed around the bridge tower or piers, which, if their shedding frequency matches the bridge's natural frequency, may cause resonance and threaten structural safety. These macro factors that affect the wind environment on the bridge deck are mainly determined by meteorological research, which determines the static force and buffeting force parts of the design wind load (AASHTO, 2020; Ministry of Transport of the People's Republic of China, 2018). The research content and methods have been introduced in detail in Chapter 2 and will not be repeated in this chapter.
In addition, the wind environment on the bridge deck also greatly affects the safety and comfort of the passage of objects on the bridge deck. For example, when the incoming flow passes over the cross-section of the bridge's main beam, the lateral wind forms a boundary layer of a certain thickness on the bridge deck, forming a wind profile that gradually changes with height. There are certain differences in the wind profile at different driving lane positions and at different heights. Generally speaking, at the same height, the lateral wind speed is greater the closer it is to the leading edge of the main beam cross-section. Therefore, designers need to accurately measure the magnitude of the lateral wind speed within the height range of the bridge deck driving lanes to evaluate the quality of the bridge deck driving wind environment and guide the design of wind-induced driving safety. More complex is that vehicles and bridges constitute an interactive and coordinated coupling vibration system under wind-induced vibrations. The study of wind-vehicle-bridge coupling vibration began in the 1980s. Baker (1986) and Baker and Reynolds (1992) conducted extensive and systematic research on the performance of vehicles on highways in crosswinds. Not only cars but also pedestrians, trains, and other bridge-passing objects are also affected by the lateral wind on the bridge deck. Diana and Cheli (1989), Ge et al. (2001) proposed an analytical framework for simulating the actual situation of trains crossing bridges under wind loads and analyzing the response of trains and bridge structures. Research on pedestrians affected by the local bridge deck wind environment started later and was less frequent. Boscato and Dal Cin (2017) and Russo (2016) conducted field measurements on the Rialto Bridge to identify the modal frequencies, damping ratios, and vibration shapes of pedestrian bridges considering wind and crowd loads. Tadeu et al. (2022) measured the acceleration response of pedestrian bridges under different wind speeds and crowd densities.
In order to improve the wind environment on the bridge deck, wind barriers are the first consideration for many large-span bridges with local wind environment problems. Larsen and Gimsing (1992) considered the impact of wind barriers on the wind environment of large-span bridges early on. As the role of wind barriers in ensuring the safety of bridge deck passage becomes increasingly important, more and more countries are incorporating the design specifications and their impact on the bridge deck wind environment into bridge design specifications (AASHTO, CHBDC CAN/CSA-S6-14, etc.). The design of wind barriers should be both practical and safe. If the wind barrier is too small, it has a limited effect on improving the wind environment on the bridge deck. Tall and low air permeability wind barriers can effectively reduce the lateral wind speed on the bridge deck, but they also bear a strong force, which is not only harmful to the aerodynamic stability of the bridge but also greatly increases the construction cost. Therefore, ensuring the aerodynamic stability of the main beam while improving the wind environment within the driving height range on the bridge deck is a factor that must be considered in the design of wind barriers. This chapter mainly focuses on the impact of the local bridge deck wind environment on vehicles and mainly elaborates and presents the relevant research on the bridge deck wind environment from the research group of Chang'an University Wind Tunnel Laboratory.
7.2 Description method
Accurately describing the local wind environment on the bridge deck can mainly be done from several aspects such as wind speed, wind pressure, and turbulence intensity. Based on the principle of equivalent lateral aerodynamic force acting on vehicles, a representation of the lateral wind speed within a certain height range of the bridge deck is established, and the effective wind speed Ueff on the bridge deck is defined in Eq. (23).
(23) where z is the height of the wind speed monitoring point from the bridge deck, Uz is the lateral wind speed at the position z from the bridge deck, Hr is the calculation height of the effective wind speed on the bridge deck, which corresponds to the height range affected by the lateral wind when vehicles are driving on the bridge deck.
After being affected by the bridge's main beam cross-section and bridge deck ancillary structures, the wind speed in a certain range of the bridge deck may be locally increased compared to the incoming flow wind speed. When traffic control measures alone cannot effectively control the safety of wind-induced driving on the bridge deck, it is often necessary to set up appropriate guardrails or wind barriers and other measures to shield the incoming flow, reduce the wind load on vehicles, and thus ensure the driving safety of vehicles on the bridge. For quantitative evaluation, the lateral wind reduction coefficient η is defined as the ratio of the difference between the incoming flow wind speed and the effective bridge deck wind speed to the incoming flow wind speed, as shown in Eq. (24).
(24) where i is the selected calculation height, and U0 is the incoming flow wind speed. The lateral wind reduction coefficient reflects the size of the obstructive or shielding effect of the bridge's main beam cross-section and its ancillary facilities on the incoming flow. The larger the value, the better the wind-blocking effect, and the more favorable it is for the safety of vehicle driving on the bridge deck.
To study the impact of strong winds on the operating resistance, energy consumption, safety, and comfort of moving objects, it is necessary to establish a wind speed spectrum model to accurately describe the characteristics of the fluctuating wind field of moving trains or vehicles. Based on Taylor's frozen turbulence hypothesis and Davenport's (1962) power spectrum model, Balzer (1977) derived the statistical properties of turbulence experienced by moving vehicles in any direction of turbulent wind field. Cooper (1984) established a wind speed spectrum model for moving points based on the characteristics of time and space changes when moving vehicles pass through a fixed ground wind field and proposed their cross-correlation and coherence characteristics based on Taylor's frozen turbulence hypothesis and isotropic turbulence hypothesis. Similarly, Wu et al. (2014) derived the turbulence correlation coefficient function and turbulence power spectrum function relative to moving vehicles using Taylor's frozen turbulence hypothesis and isotropic turbulence hypothesis. Li et al. (2017a), based on Cooper's theory, proposed an analytical model for the longitudinal and transverse fluctuating wind speed spectra of moving vehicles in random wind fields by linearly superimposing the longitudinal and transverse wind speed spectra of fixed points on the ground. The above studies were all conducted under the assumptions of Taylor's frozen turbulence hypothesis and isotropic turbulence hypothesis, which is difficult to fully present the actual conditions in the atmospheric boundary layer. Therefore, Hu et al. (2019) proposed and verified a new fluctuating wind speed spectrum model for moving vehicles under crosswinds without the traditional formulas of isotropic turbulence hypothesis and Taylor's frozen turbulence hypothesis. Hu et al. (2019) proposed that the pulsating wind speed field of a moving vehicle with a wind direction angle θ can be equivalent to a vehicle moving in the direction orthogonal to the average wind direction at an effective vehicle speed Ve (Fig. 167).
And Ve can be defined in Eq. (25).
(25) In which it refers to the speed at which the vehicle runs at the same angle as the wind direction angle θ.
The pulsating wind speed on the bridge deck can be described or simulated using the wind speed spectrum model, and the magnitude of the force experienced by the vehicle is also an important issue that many scholars want to solve. Baker (1986) proposed the basic equation for the force acting on the vehicle. Xu and Guo (2003a), Cai and Chen (2004) established a three-dimensional dynamic model of the vehicle combined with quasi-static wind force. Wyatt (1992) introduced speed limits for the Severn Bridge and the Forth Road Bridge. Smith (1998) summarized typical action plans for the impact of crosswinds on major British bridges. The response of each bridge is different, leading to bridge closures ranging from 16 m/s to 22 m/s. Xu and Guo (2003b) further proposed a systematic analysis framework for analyzing the coupled vibration of vehicles and cable-stayed bridges under crosswinds in the time domain. They used a more reasonable vehicle dynamic analysis model, considering the possible side slip of vehicle tires and the bridge deck, introducing special dampers, and simulating random road roughness through inverse Fourier transform, and assembled the motion equation of the car-bridge under crosswinds with special dampers using a fully computer-integrated method. Cai and Chen (2004) used a holistic and then local approach to analyze the side slip and yaw angle response of the vehicle, and the overall coupled analysis model was based on the assumption that the wheels and the bridge deck are always in full contact and there is no lateral relative displacement between the wheels and the bridge deck, which can predict the response of the bridge in all directions, as well as the vertical displacement, roll, and pitch displacement of the vehicle. The local analysis is used for accident evaluation, and the analysis model is a six degree-of-freedom rigid body. Han and Chen (2008a, b) established a more complete wind-vehicle-bridge system spatial coupling analysis model and embedded it into the self-developed bridge structure dynamic analysis software, and established methods for analyzing the safety of vehicles driving on oscillating bridges in the wind environment and evaluating the driving comfort of vehicles and carried out detailed parameter analysis. Zhou and Ge (2008) established a more accurate analysis model for the interaction of wind, vehicles, and bridges, improved the treatment method of wind loads on the main beam and vehicles, developed wind-vehicle-bridge interaction analysis software, and based on the wind-vehicle-bridge coupling analysis, studied the fatigue problems of the bridge's orthogonal steel bridge deck under vehicle load and wind load, and proposed a reliability analysis technology combined with the Monte Carlo method and stress block.
In the established wind-vehicle-bridge coupling system research, the vertical displacement and mechanical coupling relationship of the bridge have been considered more complete, but the research on lateral sliding and vehicle skidding accidents on the bridge is not yet complete (Han et al., 2022). Correctly analyzing the skidding response of vehicles on the bridge deck requires introducing the independent degree of freedom of the wheel bridge deck contact point, and at the same time considering the adjustment of the wheel direction angle by the driver. Ma Lin, a doctoral student at the Chang'an University Wind Tunnel Laboratory, in his doctoral thesis (Ma, 2008), reviewed the driver behavior model and wind-vehicle-bridge coupling analysis in the wind environment, studied the driver behavior model and bridge deck wheel side slip force model considering the coordinate rotation characteristics of the vehicle's motion, developed the side coupling relationship between the vehicle and the bridge, and established a spatial coupling vibration analysis framework and solution strategy for the wind-vehicle-bridge system considering driver behavior (Fig. 168).
![]() Figure 168. Two-axle vehicle dynamic analysis model considering side slip motion (Ma, 2008).
Figure 168. Two-axle vehicle dynamic analysis model considering side slip motion (Ma, 2008).Ma (2008) based on the driver model in the wind environment proposed by Baker (1987) and Chen (2004), considering the influence of cross slope, further improved the vehicle dynamics equation. The author gave the expression of the aerodynamic force on the car under any wind direction angle using the concept of vector angle shown in Eq. (26).
(26) where FVXW, FVYW, FVZW, MVXW, MVYW, MVZW are the drag force, side force, lift force, roll moment, pitch moment, and yaw moment acting on the center of mass of the vehicle;
, , , , , are the drag coefficient, side force coefficient, lift coefficient, roll moment coefficient, pitch moment coefficient, and yaw moment coefficient of the vehicle; Af is the projected area of the vehicle in the direction of wind and hv is the characteristic height of the vehicle. When , the relative wind speed and wind direction are shown in Eqs. (27) and (28). (27) (28) When
, the relative wind speed and wind direction are shown in Eqs. (29), (30). (29) (30) where
, Uw0 is the average value of the natural wind, u(x, t) is the fluctuating wind, and UV is the relative wind speed caused by the vehicle speed. Furthermore, Ma (2008) analyzed the follow-up coordinate characteristics of the vehicle and developed a driver behavior model considering the follow-up coordinate characteristics of the vehicle's motion; finally, the matrix form of the motion equation of the wind-vehicle system considering driver behavior was given, the nonlinear nature of the equation was analyzed, and the wind-vehicle system response was numerically solved using the separation iteration method, and the corresponding Fortran program was compiled. Using this calculation model, the author established a dynamic model of the wind-vehicle system considering the follow-up coordinate characteristics of the vehicle and driver behavior, and analyzed the influencing factors and critical wind speeds of road traffic accidents. For example, Fig. 169 shows a set of calculated data on the impact of wind speed and direction on the lateral displacement of vehicles.
![]() Figure 169. Impact of wind speed and direction on vehicle lateral displacement. (a) Vehicle lateral displacement under different wind speeds. (b) Vehicle lateral displacement under different wind directions.
Figure 169. Impact of wind speed and direction on vehicle lateral displacement. (a) Vehicle lateral displacement under different wind speeds. (b) Vehicle lateral displacement under different wind directions.The driver behavior model in the paper considers the driver's control of vehicle skidding and yaw, using a driver behavior model that controls the displacement and rate of the center of gravity. The research conclusions related to the paper were further demonstrated and perfected and have been widely cited in related scientific research topics of wind-vehicle-bridge coupling vibration (Han and Chen, 2008a, 2008b; Li et al., 2012b).
7.3 Research methods
Wind tunnel testing is a common method for determining the aerodynamic forces of the vehicle-bridge system. Coleman and Backer (1990, 1994) conducted wind tunnel tests to measure the aerodynamics of high-sided vehicles, where the vehicle model was fixed on the box beam, but no detailed information about the box beam was provided. Zhou and Ge (2008) studied the vortex-induced-vibration of the bridge surface with vehicles in the wind tunnel, with the vehicle fixed on the bridge surface. The results showed that the presence of the vehicle has a significant effect on the vortex-induced-vibration of the bridge surface. Argentine et al. (2011) studied the crosswind effect on vehicles in the wake area of the bridge tower. The flow field and surface pressure patterns around the vehicle were obtained through smoke visualization and pressure measurement. The aerodynamic load on the vehicle was observed to be amplified. Zhu and Chen (2004) conducted wind tunnel tests to study the transient aerodynamic forces when vehicles enter the wake area of the bridge tower. Their test results implied that the bridge surface and tower have a significant impact on the aerodynamic characteristics of the vehicle. Huang et al. (2011) used wind tunnel testing to establish a scaled model of the bridge surface of the Haitan Strait Bridge, simulated the bridge surface, wind barriers, etc., and set up force rakes at various lanes on the bridge surface to measure the wind profile of the bridge surface under different wind direction angles.
CFD technology has gradually become an effective alternative to wind tunnel testing to obtain relevant data on the characteristics of the bridge surface wind environment. The application of CFD in the field of bridge wind engineering can be traced back to the early 1990s, and many scholars have been involved in this field to simulate the local wind field characteristics of the bridge (Fujiwara et al., 1993; Ge et al., 2002; Huang and Liao, 2011; Jeong and Kwon, 2003; Larsen and Walther, 1997; Li and Wang, 2004; Taylor and Vezza, 2009; Zhou and Ma, 2010; Zhu et al., 2007). These studies not only analyzed the wind environment characteristics of the stationary bridge surface but also included the dynamic characteristics of the bridge surface wind field with moving vehicles.
In recent years, the application of CFD has further expanded to the simulation of aerodynamic characteristics of vehicles on the bridge surface under crosswind conditions. For example, Krajnović et al. (2012) used CFD technology to simulate the aerodynamic characteristics of vehicles on the bridge surface. The complexity of this research direction lies in the fact that when vehicles are parked on the bridge surface, the interaction between the bridge and the vehicle needs to be considered at the same time, which is more complex than analyzing the bridge or the vehicle separately. In the research by Bettle et al. (2003), CFD was first attempted to explore the aerodynamic characteristics of the stationary vehicle and bridge system. They used the steady-state Reynolds-averaged Navier-Stokes (RANS) method to simulate the truck on the bridge surface, thereby obtaining key parameter such as aerodynamic lift, drag, and moment coefficients. These research results have not only enriched the theoretical basis of bridge wind engineering but also provided valuable data support for practical engineering applications. In order to accurately assess the impact of the bridge surface wind environment on driving safety, researchers often adopt a combination of CFD simulation calculations and wind tunnel testing. Xu Minjian, a master's student at the CUWTL (2023), took a certain cross-sea channel approach bridge as the engineering background. First, a static flow numerical model was established using the CFD numerical simulation method to analyze the impact of the wind barrier's wind-blocking rate and height ratio on the wind profile of the separated double-box beam bridge surface, and to explore the wind-blocking mechanism of the wind barrier. Finally, the wind-blocking effect of the wind barrier was comprehensively evaluated through the bridge surface equivalent wind speed and the lateral wind reduction coefficient at the bridge lane position. Then, a large-scale sectional model was designed to conduct wind tunnel vibration tests under conditions with and without wind barriers, and the impact of wind barrier structural parameter on the vortex vibration performance of the separated double-box beam was compared and analyzed.
Generally speaking, refining the mesh can improve the quality of the mesh, but after refining to a certain extent, excessive mesh refinement cannot effectively improve the quality of the mesh, but will significantly increase the calculation time, leading to a decrease in calculation efficiency. Therefore, the beginning of CFD simulation calculations usually involves calculating the section static three-force coefficients at different mesh quantities to perform mesh independence verification. For example, Fig. 170 are the mesh divisions of the separated double-box beam without wind barriers when Xu (2023) used CFD to analyze the wind environment of the bridge surface.
![]() Figure 170. Mesh division of the cross-section. (a) Global mesh. (b) Local mesh. (c) Enlarged mesh around the cross-section.
Figure 170. Mesh division of the cross-section. (a) Global mesh. (b) Local mesh. (c) Enlarged mesh around the cross-section.When the grid precision in CFD numerical simulation reaches an acceptable range, Xu (2023) obtained the wind profile and velocity cloud diagram of different lane positions on the windless barrier section, as shown respectively in Figs. 171 and 172.
![]() Figure 171. Wind profile at different lane positions of a cross-section without wind barriers.
Figure 171. Wind profile at different lane positions of a cross-section without wind barriers.In order to obtain more accurate numerical simulation results for vehicle aerodynamic performance, Guo (2013) conducted numerical simulations on the aerodynamic coefficients of three types of cross-sectional objects: streamlined, near-streamlined, and blunt bodies, and compared the results with wind tunnel experimental data (Table 19). The comparison shows that in the numerical simulations of streamlined and near-streamlined bodies, both models obtained aerodynamic coefficients close to the experimental values, with the standard k-ε turbulence model being slightly more accurate. However, in the aerodynamic force calculations for buses, the situation was completely reversed. Under different wind speed conditions, the SST k-ω turbulence model showed results close to the experimental data, demonstrating good reliability. In contrast, the standard k-ε turbulence model provided relatively accurate aerodynamic coefficients for buses at a wind speed of 10 m/s, but as the wind speed increased, the error grew larger, even exceeding 50% of the experimental values. Additionally, the convergence speed of the standard k-ε turbulence model was slow, and the stability of the computational results was not as good as that of the SST k-ω turbulence model.
Table 19. Analysis of CFD computational results for standard k-ε turbulence model and SST k-ω turbulence model.Wind speed 10 m/s 30 m/s 50 m/s 70 m/s Experimental value 0.67 0.61 0.58 0.54 Standard k-ε turbulence model 0.58 0.70 0.76 0.83 SST k-ω turbulence model 0.60 0.57 0.57 0.57 Furthermore, Guo (2013) conducted a typical vehicle aerodynamic performance study using CFD (Fig. 173), and based on the aerodynamic forces acting on the vehicle, the typical vehicle aerodynamic coefficients were obtained through numerical simulation methods, and the relationship between the vehicle aerodynamic coefficients and wind direction was studied. Using the analysis results, the author started from the force state of the vehicle under driving conditions and analyzed the critical conditions for vehicle skidding and rolling over.
![]() Figure 173. CFD vehicle aerodynamics study. (a) Computational domain mesh. (b) Local mesh division around the vehicle body.
Figure 173. CFD vehicle aerodynamics study. (a) Computational domain mesh. (b) Local mesh division around the vehicle body.7.4 Design and application of wind barriers
To improve bridge deck wind characteristics and reduce vehicle operation risks, installing wind barriers is an effective method. Wind barriers can reduce the length of turbulent vortices, thereby increasing the peak frequency of turbulent velocity fluctuations. For bridges, installing wind barriers can improve the wind characteristics of the bridge deck; wind barriers usually cause lower average wind speeds and higher turbulence, thus reducing the forces acting on vehicles (Kozmar et al., 2012). Charuvisit et al. (2004) studied the impact of wind barriers on vehicles passing through the wake area of bridge towers. As for wind barriers, parameter such as porosity, height, and form of wind barriers significantly affect the wind characteristics above the bridge deck (Kozmar et al., 2014; Kwon et al., 2011; Su et al., 2016). Wind barriers with lower porosity will reduce wind speed behind the barrier; taller wind barriers not only reduce wind speed but also expand the protected area behind the barrier (Kozmar et al., 2014). Premoli et al. (2015) studied the impact of wind barriers on train responses, considering the height, form, and porosity of wind barriers.
Xu (2023) established a static flow numerical model in his research to analyze the impact of wind barrier wind-blocking rate and height ratio on the wind profile of the separated double-box beam bridge deck. The author found through CFD numerical simulation that the wind barrier has little effect on the wind speed ratio within 0–2 m, mainly reducing the wind speed ratio in the bridge height range of 3–5 m. As the wind barrier wind-blocking rate increases, the wind speed ratio within the bridge deck wind-blocking height range tends to decrease (Fig. 174). The wind-blocking height ratio and wind-blocking area of the separated double-box beam bridge deck lane position increase with the increase of the wind barrier wind-blocking rate and height ratio (Fig. 175).
![]() Figure 174. Impact of wind barrier wind-blocking rate on the wind profile at each lane position.
Figure 174. Impact of wind barrier wind-blocking rate on the wind profile at each lane position.![]() Figure 175. Impact of wind barrier height ratio on the wind profile at each lane position.
Figure 175. Impact of wind barrier height ratio on the wind profile at each lane position.Furthermore, Xu (2023) confirmed through experiments in the Chang'an University Wind Tunnel Laboratory that wind barriers of different height ratios also completely suppress the vertical bending vortex vibration of the separated double-box beam at low wind speeds, while leading to a deterioration of the vertical bending vortex vibration performance in high wind speed areas. Fig. 176 shows the impact of wind barrier height ratio on the amplitude-wind speed curve of the main beam vertical bending vortex vibration.
![]() Figure 176. Impact of wind barrier height ratio on the amplitude-wind speed curve of the main beam vertical bending vortex vibration.
Figure 176. Impact of wind barrier height ratio on the amplitude-wind speed curve of the main beam vertical bending vortex vibration.Subsequently, Xu (2023) used wind tunnel testing to study the impact of wind barrier wind-blocking rate or wind barrier height ratio on the dimensionless maximum vertical amplitude of the main beam in the high wind speed area of the separated double-box beam (Fig. 177). As can be seen from Fig. 178, after the installation of the wind barrier, the dimensionless maximum vertical amplitude of the separated double-box beam increases with the increase of the wind barrier wind-blocking rate. As can be seen from Fig. 179, after the installation of the wind barrier, the dimensionless maximum vertical amplitude of the separated double-box beam shows an increasing and then decreasing trend with the increase of the wind barrier height ratio.
![]() Figure 177. Large-scale sectional model wind tunnel test. (a) No wind barrier section. (b) With wind barrier section. (c) Spring suspension system. (d) Data acquisition device.
Figure 177. Large-scale sectional model wind tunnel test. (a) No wind barrier section. (b) With wind barrier section. (c) Spring suspension system. (d) Data acquisition device.![]() Figure 178. Impact of wind barrier wind-blocking rate on the dimensionless maximum vertical amplitude.
Figure 178. Impact of wind barrier wind-blocking rate on the dimensionless maximum vertical amplitude.![]() Figure 179. Impact of wind barrier height ratio on the dimensionless maximum vertical amplitude.
Figure 179. Impact of wind barrier height ratio on the dimensionless maximum vertical amplitude.Guo (2013) in his master's thesis used computational fluid dynamics (CFD) technology to conduct an in-depth study of the wind environment in the area near the bridge tower (Fig. 180). Under the condition of lacking wind barriers and railings, the flow lines of the lateral wind showed obvious curling after passing around the upstream bridge tower. In the area between the upstream and downstream bridge towers, the flow lines appear quite chaotic, with the direction of air movement being changeable and unstable. In the area far from the bridge tower, the flow lines appear relatively straight, with the air flow moving parallel to the transverse bridge direction, showing a trend of flow from upstream to downstream. Within a certain range downstream of the bridge tower, the flow line color tends to blue, indicating that the bridge tower has a significant shielding effect on the downstream area, resulting in a significant reduction in wind speed. Relatively, on both sides of the bridge tower, the flow line color tends to red, showing a higher flow speed. This phenomenon is due to the formation of a so-called push boundary layer when the gas flows around the bridge tower, and the wind speed sometimes even exceeds the original lateral wind speed.
8. Wind tunnel testing technology
A wind tunnel, also known as a wind tunnel laboratory, is a tubular experimental apparatus that artificially generates and controls airflow to simulate the movement of gases around a physical entity. It measures the effects of airflow on the entity and observes physical phenomena. Due to its advantages such as excellent controllability, high repeatability, and results that closely match observations from actual wind fields, it is widely used for testing in automotive aerodynamics and wind engineering. This includes the study of wind forces and vibrations on structural elements, flow conditions in complex terrains, and the effectiveness of wind protection measures.
The world's first recognized wind tunnel was built by the British E. Mariotte in 1871. It was a wooden box with both ends open, with a cross-sectional area of 45.7 cm by 45.7 cm and a length of 3.05 m. The National Air and Space Museum in the United States preserves a replica of the Wright brothers' wind tunnel from 1901 (Fig. 181). In 1925, a high-speed wind tunnel was created with a Mach number close to 1; in 1931, the United States built a full-scale wind tunnel with a cross-sectional size of 18.3 by 9.1 m (Fig. 182). In the 1960s, the atmospheric boundary layer wind tunnel for civil buildings was born, and wind tunnel experiments gradually expanded to industrial sectors beyond aerospace, leading to the formation of a new discipline known as "industrial aerodynamics" or "wind engineering."
![]() Figure 181. Wright brothers' wind tunnel (Replica) (https://www.baclcorp.com.cn/show.asp?para=cn_2_7_1744).
Figure 181. Wright brothers' wind tunnel (Replica) (https://www.baclcorp.com.cn/show.asp?para=cn_2_7_1744).![]() Figure 182. Full-scale wind tunnel (http://www.sciencehuman.com/history/history2011/history201105v.htm).
Figure 182. Full-scale wind tunnel (http://www.sciencehuman.com/history/history2011/history201105v.htm).Wind tunnels can generally be categorized based on velocity into low-speed wind tunnels, high-speed wind tunnels, supersonic wind tunnels, and hypersonic wind tunnels. According to the type of airflow, they can be divided into closed-circuit wind tunnels and open-circuit wind tunnels (blowing type, sucking type). Based on the direction of airflow generation, they can be classified as vertical wind tunnels and horizontal wind tunnels. In terms of application, wind tunnels can be used for civilian purposes (atmospheric boundary layer), aviation (military) (Fig. 183), and multifunctional wind tunnels (for automobiles, extreme meteorological conditions) (Fig. 184). So far, China has possessed wind tunnels that are low-speed, high-speed, ultra-high-speed, as well as shock wave and arc wind tunnels.
![]() Figure 183. Aerodynamic wind tunnel (https://www.zhihu.com/question/24656024/answer/71266154).
Figure 183. Aerodynamic wind tunnel (https://www.zhihu.com/question/24656024/answer/71266154).![]() Figure 184. Automotive wind tunnel (https://www.baclcorp.com.cn/show.asp?para=cn_2_7_1744).
Figure 184. Automotive wind tunnel (https://www.baclcorp.com.cn/show.asp?para=cn_2_7_1744).8.1 Bridge wind tunnel testing technology
8.1.1 Sectional model test
Segmental model wind tunnel tests for bridge structures are typically used to study the aerodynamic performance of bridges under wind load effects, which include pressure measurement, force measurement, and vibration measurement tests: pressure measurement tests mainly obtain the wind pressure distribution or generalized wind load on the structural surface through scaled models; vibration measurement tests can obtain the wind-induced vibration response of the segmental model, assess whether the bridge will vibrate under the action of wind, the frequency and amplitude of the vibration, and analyze the stability of the bridge structure under different wind speeds and directions, such as the critical wind speed for instability; force measurement tests can obtain the static three-force coefficients of the segmental model, which can then be used to calculate the static wind load on the bridge structure at any wind speed, and then computational software can be applied to analyze the corresponding deformation of the structure and study the adverse phenomena such as static wind instability.
Segmental model wind tunnels have the advantages of low cost, short cycle, strong repeatability, and high safety, making them an effective research method that can provide important aerodynamic performance data for bridge design and construction, ensuring the safety and stability of the bridge. Therefore, they are widely used in bridge wind resistance research.
The installation of the segmental model uses an internal support system (Fig. 185), connected as a whole with a rigid arm through flanges, and the arm is suspended on the internal support by eight springs in series in pairs, to accurately simulate the vibration characteristics of the two degrees of freedom of vertical bending and torsion of the section. To eliminate the influence of the support system and the model end on the flow field, elliptical two-dimensional end plates are installed on both sides of the model. At the same time, a total of three laser displacement sensors are arranged on both sides of the arm to record the response time history of the segmental model vibration. Vibration signals are collected and recorded by the laser displacement sensor, amplifier, CoinvDASP data acquisition instrument, and computer. During the segmental model test, the wind speed is increased in stages, and data collection is started after the wind speed and model vibration of each working condition are stable, and finally, the vibration amplitude is obtained by data analysis.
![]() Figure 185. Sectional model and internal support. (a) Schematic diagram. (b) Wind tunnel layout.
Figure 185. Sectional model and internal support. (a) Schematic diagram. (b) Wind tunnel layout.In wind tunnel segmental model tests, to ensure that the flow field around the segmental model meets the two-dimensional flow characteristics, it is necessary to set up two-dimensional end plates to reduce the end effect. The setting of the size of the two-dimensional end plates has mostly relied on experience in the past, lacking a quantitative basis. Bai et al. (2023a) used numerical simulation to calculate the two-dimensional flow field of the test section, and introduced a correction coefficient K to consider the impact of the position distance on the end effect. From this value, the reasonable size of the two-dimensional end plate can be calculated to ensure effective suppression of the end effect, and the effectiveness of this method has been verified through wind tunnel tests.
During the pressure measurement test, the pressure holes are non-uniformly arranged in the middle of the model. The DSM4000 electronic pressure scanning valve system produced by Scanivalue in the United States is used in conjunction with a computer (Fig. 186). Data collection is conducted after the wind speed stabilizes in each test condition. The positioning and quantity of the pressure measurement points are limited by the number of scanning valve bodies and the number of channels per single module, which requires appropriate adjustment according to the size of the test model. At the same time, to improve the pipeline system's frequency response error caused by excessively long pressure measurement tubes, a metal flat tube is connected to the pressure measurement tube (Fig. 187).
The aerodynamic forces on the cross-sectional surface can be obtained by integrating the pressure signals collected during the pressure measurement test using the surface pressure method. Fig. 188 is a correlation coefficient plot between aerodynamic forces and vortex-induced forces. Modal vortex cloud diagrams of each order of the model can be obtained through dynamic mode decomposition (DMD) analysis (Fig. 189).
![]() Figure 188. Correlation coefficient plot of aerodynamic forces and vortex-induced forces.
Figure 188. Correlation coefficient plot of aerodynamic forces and vortex-induced forces.8.1.1.1 Vibration measurement test
To address the issue of "distortion" in the vibration form of traditional spring suspension systems under high wind attack angles, Gao et al. (2021c) proposed a wind tunnel experimental device for three-degree-of-freedom coupled vibration under high wind attack angles. This device achieves structural decoupling of the three-degree-of-freedom support system, ensuring good linear stiffness and stable vibration frequency during large amplitude vibrations, meeting the requirements for vibration testing under high wind attack angles and making it possible to conduct three-degree-of-freedom vibration testing of blunt body flexible components under such conditions.
Vibration measurement tests can be divided into sectional model tests based on the scale ratio of the model. Fig. 190 shows a sectional model with a scale ratio of 1:50 and a large-scale of 1:22 for the same actual bridge. The large-scale test uses an internal support type spring suspension two-dimensional rigid body sectional model test method. The test internal support device has a mechanism for changing the relative attack angle between the model and the incoming flow and a constraint mechanism for the model's motion state. The end wall is used to ensure the flow field characteristics of a uniform flow field, avoiding the influence of the flow field by the suspension arm and other factors.
![]() Figure 190. Sectional models and large-scale models in the laboratory. (a) Sectional model (scale ratio = 1:50). (b) Large-scale model (scale ratio = 1:22).
Figure 190. Sectional models and large-scale models in the laboratory. (a) Sectional model (scale ratio = 1:50). (b) Large-scale model (scale ratio = 1:22).For bridge cross-sections such as double-box girders, the core beams can only be arranged on both sides of the cross-section. However, large-scale models require sufficiently large core beam sections to ensure the model's rigidity. As a result, it is inevitable that the equivalent mass and equivalent moment of inertia cannot be satisfied simultaneously. This issue can be resolved by using steel guardrails (Fig. 191) and by adding high-density lead sheets (Fig. 192) at the center of both ends of the model's cross-section to balance the equivalent mass and moment of inertia.
By comparing the test results of the sectional models with different-scales (Fig. 193), it can be observed that the vortex-induced-vibration ranges obtained from both tests are essentially consistent. The vertical bending vortex-induced-vibration range for the large-scale model is a wind speed of 10 to 15 m/s, and the torsional vortex-induced-vibration range is 19 to 25 m/s. However, at wind attack angles of +3° and +5°, the sectional model's starting wind speed for the vertical bending vortex-induced-vibration range is higher than that of the large-scale model. At five different angles, the large-scale model shows an earlier starting wind speed for the torsional vortex-induced-vibration range.
![]() Figure 193. Comparison of test results between the lower sectional model and the large-scale model at a −3° angle of attack. (a) Vertical bending results. (b) Torsional results.
Figure 193. Comparison of test results between the lower sectional model and the large-scale model at a −3° angle of attack. (a) Vertical bending results. (b) Torsional results.8.1.1.2 Force measurement test
The force measurement test utilizes a rod-type five-component strain balance developed by the Chinese Aerodynamics Research Center. The balance system consists of a rod-type balance (Fig. 194), a strain amplifier, an A/D converter, and a computer for data acquisition and processing. Bai et al. (2022a), in order to enhance the reliability of wind tunnel test data and to understand the impact of the end effects of the segmental model on the test results, combined wind tunnel testing with numerical simulation to study the influence of the length-to-width ratio of the segmental model on the three-force coefficients for typical bridge cross-sections (Fig. 195). It was found that to ensure the accuracy and stability of the force measurement test results, the length-to-width ratio of the segmental model is recommended to be greater than or equal to 3. For streamlined box girder cross-sections, the requirements can be appropriately relaxed, with the length-to-width ratio of the segmental model being greater than or equal to 2. When the length-to-width ratio is less than the recommended value, the static wind stability results and the vortex-induced-vibration response results tend to be more dangerous, with greater deviations as the ratio decreases.
The static three-force coefficients of the main girder at the mid-span cross-section, along the body axis and the wind axis, change with the wind attack angle as shown in Fig. 196. By utilizing the measured static three-force coefficients, the static wind load on the bridge structure under any wind speed can be calculated. Further, computational software can be applied to analyze the corresponding deformation of the structure and to study adverse phenomena such as static wind instability that affect the bridge structure.
8.1.2 Aeroelastic model test
Aeroelastic models can simulate the dynamic characteristics of structures more realistically, directly simulating the aerodynamic forces acting on components such as bridge towers, cable stays, suspension cables, and main beams. They accurately reflect the multimodal coupling effects of wind-induced vibrations in long-span bridges and are an essential and irreplaceable means of wind resistance research. They are mainly used to test the aerodynamic performance of bridge structures in uniform flow fields, such as static wind stability, vortex-induced-vibration, flutter, and galloping, as well as the buffeting response under the action of atmospheric boundary layer turbulence. Compared with sectional models, aeroelastic model wind tunnel tests can directly simulate three-dimensional spatial effects and multimodal coupling effects, taking into account various nonlinear factors such as aerodynamic nonlinearity and geometric nonlinearity under large amplitude and large deformation. Moreover, they more closely simulate the dynamic characteristics, boundary conditions, and other structural components (bridge towers, cable stays, suspension cables, etc.) of the actual bridge.
The aeroelastic models for bridge wind resistance and seismic research are mostly conducted in the CA-03 boundary layer wind tunnel test section at Chang'an University. The model design includes components such as cables, bridge towers, and main beams.
The aerodynamic shape, axial rigidity, and mass of the model's main cables must all follow strict similarity criteria to meet design requirements. The equivalent simulation of axial rigidity can be achieved by selecting the appropriate steel wire, which should have the same elastic modulus as the original main cable but with a reduced cross-sectional area (Fig. 197). The aerodynamic performance and mass of the main cables are simulated using specially made perforated copper bars (Fig. 198). The size of these copper bars is calculated based on the reduced scale of the main cable's wind resistance area and the total weight with cable clamps, aiming to ensure the model's weight is similar to the designed wind load.
The stay cables of a cable-stayed bridge are simulated using standardized phosphor bronze wires. The principle of spring series connection is utilized, taking into account the effects of over-tensioning (Fig. 199), to calculate the cable force. The force in the stay cables is adjusted by using sandbags of a certain mass (Fig. 200).
The design of the reinforced beam must consider its cross-sectional shape. For closed cross-sections, a single core beam can be used to simulate the stiffness of the main beam. The core beam runs through the entire model, and the rigid arms extended from the core beam form the rigid skeleton of the fishbone beam, which is used to fix the outer skin. The rigid outer skin simulates the aerodynamic shape; to ensure that the rigid outer skin does not provide stiffness.
For reinforced beams with open cross-sections, a single core beam cannot be completely hidden within the model's external structure. The stiffness of the main beam can be simulated by using "U" type springs (Fig. 201) in series with the rigid outer skin. The "U" type springs are compact, cause minimal disturbance to the surrounding flow field, and their installation angles can be finely adjusted to ensure that the shear center does not shift. Compared to the design method using a single core beam, this can significantly improve the accuracy of the full-bridge aeroelastic model wind tunnel test. A geometric parameter design program for "U" type springs (Fig. 202) has been developed. When designing the reinforced beam of the aeroelastic model, only the target stiffness needs to be input to directly obtain the geometric dimensions of the "U" type springs that meet the dynamic characteristics requirements, greatly improving computational efficiency.
The construction of the bridge tower in the full-bridge aeroelastic model is complex, including the core beam of the tower, the outer skin, and the counterweights. The core beam is made of steel or aluminum materials, while the outer skin is made of wood, ABS board, carbon fiber, or 3D printing, with dimensions calculated based on the scale ratio to accurately simulate the aerodynamic shape of the bridge tower. To achieve mass similarity, lead blocks are used for precise weighting in the model to ensure that the mass distribution of the model is consistent with that of the actual bridge tower. Considering the significant impact of the bending stiffness of the bridge tower in the direction of the bridge on the overall structural stiffness of the suspension bridge, the bending stiffness in this direction is given priority in the design process. The layout of the test instruments is shown in Figs. 203 and 204.
During the testing process, different wind direction angles are adjusted using a turntable. The most mature and widely used method for simulating the wind attack angle is the slope board method. However, slope boards are generally designed with a fixed slope and are quite large in volume. To meet the need for continuous variation of the wind attack angle at different positions along the bridge, the laboratory designed the slope board device shown in Fig. 205. This device consists of a single component made up of two flow-directing boards and a base support. In practical use, computational fluid dynamics (CFD) is utilized to calculate the height and position of the slope board at different attack angles, enabling the setting of different wind attack angles at various positions along the bridge. In addition, Bai et al. (2023b) invented a three-directionally adjustable device for bridge sectional models in particle image velocimetry (PIV) wind tunnel tests.
When conducting wind tunnel test studies on bridge flutter in non-uniform wind fields of mountainous areas, it is required that the model span is sufficiently large and that the influence of structures such as tower cables is avoided. A strut model (Fig. 206) can be selected to carry out the relevant research, which better reflects the vibration characteristics of the main beam. At the same time, the strut model does not need to consider the similarity of the Froude number, making the setting of the wind speed ratio more flexible. In addition, a complete set of wind tunnel test research methods for the flutter characteristics of bridges in non-uniform wind fields has been established, and the impact of different types of non-uniform wind fields on the flutter stability of bridges has been studied using these methods.
8.1.3 Damping control technology
In wind tunnel experiments, precise damping control technology is a crucial component. It effectively controls the dynamic characteristics of the model and its vibration state in the flow field, thereby ensuring the accuracy and repeatability of the experimental results. Dampers absorb vibrational energy and gradually convert it into other forms of energy dissipation. Commonly used dampers include oil can liquid viscous dampers, steel wire rope coil dampers, and eddy current dampers. In this technology, key parameter include the type of damper, its location, and the damping material selected. By optimizing the design and layout of the damping devices, the impact of model vibration on the flow field characteristics and data acquisition can be effectively reduced, which has been widely verified and applied in academia. Therefore, accurate damping control not only enhances the precision of wind tunnel experimental results but also strengthens the credibility of experimental data, providing important support for engineering design and performance assessment in fields such as bridge wind resistance and seismic resistance, and aerospace.
The working principle of the tape damper involves winding adhesive tape around the spring in the sectional model system to adjust the system damping, as shown in Fig. 207. The mechanism is such that when the spring pitch increases, the relative sliding between the tape and the spring coil generates a viscous damping force, effectively suppressing the increase in pitch, thereby adding a damping effect to the model system. This damper is a composite type dominated by viscous damping force and is often used as a convenient means of adjusting model damping in wind tunnel tests due to its easy manufacturing and application (Fig. 208). There are also limitations to the electrical tape damper: as the number of vibrations increases, the tape may loosen, causing the damping effect to gradually weaken; the thickness of the tape affects its deformation resistance, thereby changing the relative movement between the spring and the tape and the energy consumption per cycle, resulting in different additional damping effects; the winding width is also a factor that cannot be ignored. In summary, although the tape damper is easy to operate, in practical application, it is necessary to consider various factors such as the number of vibrations, tape specifications, and layout position comprehensively to ensure the accuracy and reliability of its damping adjustment.
Gao et al. (2023) utilized a novel experimental damping adjustment device in their experiments (Fig. 209), which includes a rigid insulating rod, metal plates, an electromagnet, a sliding rheostat, and a power supply. By moving a closed conductor copper plate through the magnetic field lines, it is capable of linearly and continuously adjusting the structural vertical and torsional damping ratios independently. Compared to traditional steel wire rope dampers, this device has the advantages of being continuously adjustable, having good linearity, and not being affected by the model's static wind displacement. In addition to these, the device is easy to install, simple in construction, capable of achieving linear and stable structural damping under large static wind deformation and large amplitude vibrations, and it allows for continuous adjustment of the damping coefficient.
![]() Figure 209. Linear damping device. (a) Schematic diagram. (b) Overall layout schematic diagram of the spring suspended vibration system.
Figure 209. Linear damping device. (a) Schematic diagram. (b) Overall layout schematic diagram of the spring suspended vibration system.Yan (2023) conducted research to study the impact of different damping ratios on the wind-induced vibration characteristics of H-shaped hangers. To achieve this, two types of linear damping devices capable of precisely controlling the structural damping ratio were designed specifically for sectional models and aeroelastic models (Fig. 210). The experimental results indicated that the structural damping ratio significantly affects the wind-induced vibration characteristics of the H-shaped hanger models. Building upon this, Ma (2019) utilized these dampers to conduct wind tunnel tests under eight different damping ratio conditions, delving into and systematically studying the wind vibration characteristics of H-shaped hangers under various damping ratios.
![]() Figure 210. Linear damping device. (a) Damping adjustment device for the sectional model. (b) Damping adjustment device for the aeroelastic model.
Figure 210. Linear damping device. (a) Damping adjustment device for the sectional model. (b) Damping adjustment device for the aeroelastic model.8.1.4 Topographic testing
Topographic testing is one of the primary methods for studying the characteristics of wind fields in complex terrains. By simulating real terrain in a wind tunnel, it is possible to conduct detailed studies on wind speed, wind attack angle, turbulence intensity, and other wind field characteristic parameter in areas with complex terrain. This method has the advantages of a short testing period, clear research objectives, and high reliability of results, and has been widely applied.
Topographic testing is suitable for studying the effects of terrain on wind field characteristics and the aerodynamic effects on structures such as buildings and bridges. In mountainous canyon areas, influenced by atmospheric circulation and local terrain, the wind field is more complex and variable, with phenomena such as variability in wind speed profiles, mountain wind effects, canyon wind effects, mountain top acceleration effects, and mountain range shielding effects. The wind parameter for mountainous canyons described in specifications are not easily applicable to the wind resistance design of all mountainous canyon bridges. Therefore, it is recommended to conduct special studies on wind fields in special terrains, and the study of wind parameter in mountainous canyons is also one of the hot topics in the field of wind engineering at present.
Typically, topographic models are made by scaling down the actual terrain's geometric shape according to a certain ratio to ensure that the model can truly reflect the actual terrain features (Fig. 211). The selected terrain should as much as possible cover areas with topographic features, such as mountain tops, valleys, and other uneven terrain; the center of the selected terrain should be centered on the bridge span. To reduce the Coriolis effect, it is advisable to select an area no larger than 5 km, the coverage radius of the topographic wind environment test model should not be less than 2 km, the inflow can choose a turbulent field of the same scale B-type surface category, and the test model ratio should be greater than 1:1000.
When conducting wind tunnel topographic tests, the topographic model usually needs to be truncated at a certain distance from the bridge or other structures. This may lead to an abrupt change in height between the upper edge of the topographic model and the bottom of the wind tunnel or the computational domain, creating a so-called "artificial cliff" that should not be ignored in terms of its impact on the flow. To ensure that the flow is as smooth as possible, a transition section called a slope is required between the bottom of the wind tunnel or the computational domain and the top of the topographic model to reduce the impact of this unfavorable influence.
However, this transition curve is not suitable for topographic models with a large height difference. For topographic models with a large scale and height difference, a straight-line transition section that is easy to process in the laboratory is adopted, and the horizontal projection width of the transition section is used as a variable to explore its impact on the wind field characteristics in the canyon area (Fig. 212). The study found that as the width-to-diameter ratio decreases, the wind speed at all positions in the terrain wind field continues to decrease, and the turbulence intensity continues to increase. The change in the wind attack angle is not monotonic; the impact of the width-to-diameter ratio on the energy distribution of the power spectrum is mainly concentrated in the low-frequency region. By comprehensively comparing the measured data and the test results under various width-to-diameter ratios, it is recommended to control the transition section size with a width-to-diameter ratio not less than 0.480 for terrains with a large height difference.
![]() Figure 212. Terrain models at different width-to-diameter ratios. (a) Width-to-diameter ratio is 0.587. (b) Width-to-diameter ratio is 0.373.
Figure 212. Terrain models at different width-to-diameter ratios. (a) Width-to-diameter ratio is 0.587. (b) Width-to-diameter ratio is 0.373.Topographic model wind tunnel test studies are primarily focused on simple, regular terrains as well as complex actual terrains found on-site. Research on simple, regular terrains helps in understanding the fundamental principles of airflow. Wang (2022b) analyzed the topographical and geomorphological characteristics of actual U-shaped canyons, simplified the complexity, and proposed a simplified topographic model of U-shaped canyons. By considering inflow parameter (inflow wind speed, inflow wind speed profile, inflow direction, inflow development length, and inflow surface roughness) and canyon parameter (interior roughness of the canyon and the width-to-depth ratio of the canyon) as variables of study, the spatial distribution characteristics of wind parameter in U-shaped canyons were explored (Figs. 213 and 214). On this basis, taking the inflow distribution pattern, inflow wind speed, and the position of the bridge relative to the canyon as starting points, the study compared current wind resistance specifications to investigate the buffeting response patterns of long-span bridges within U-shaped canyons.
The use of the analytic hierarchy process (AHP) to study the impact weights of inflow characteristic study variables on wind parameter revealed the following: (1) the inflow wind direction has the greatest influence on wind speed and wind bias angle at the bridge site, with corresponding weights of 0.608 and 0.500, respectively; (2) the inflow wind speed profile and inflow wind direction have an equivalent and significant effect on wind speed at the bridge site, both reaching 0.387; (3) the inflow surface roughness and inflow wind speed have the least impact on the wind parameter at the bridge site, neither exceeding 0.21. The weight matrix of the influencing factors of the inflow characteristic study variables is as Table 20 shows.
Table 20. Inflow characteristic study variable weight matrix.Index weight Upstream surface roughness Incoming wind speed Incoming wind speed profile Incoming wind direction Wind speed 0.132 0.100 0.387 0.387 Wind attack angle 0.203 0.107 0.083 0.608 Wind bias angle 0.100 0.094 0.300 0.500 The results of wind tunnel tests on simple and regular mountain models are relatively reliable and have a high degree of accuracy, and certain patterns can be summarized. However, the abstract and simplified terrain differs significantly from actual mountainous terrain, so the research results may not be directly applicable to actual complex mountainous terrain (Fig. 215). For real complex terrains, Bai et al. (2012b) and others studied the wind field characteristics of the Sanshui River bridge site in the western valley area, simulating the terrain within a 1.5 km range around the Sanshui River Bridge at a scale of 1:600. They analyzed how the wind profile, turbulence intensity, integral scale, and fluctuating wind power spectrum change at the bridge site under different wind directions. When the inflow is consistent with the direction of the valley, the wind profile is close to a power law distribution, and it was found that the average wind profile index in the valley is smaller than in other directions; the turbulence in the valley is relatively large, especially near the slopes, where the turbulence at the bridge height is greater than 15%.
In addition, when there is a lack of observational data at the bridge site, the mountainous wind profile index provides a basis for the design of the reference wind speed for bridge heights (Fig. 216). To obtain a wind profile more suitable for mountainous areas, our research group conducted a study on the gradient wind height and the wind profile index applicable to mountainous areas based on the measured results of wind tunnel tests for a certain mountainous bridge site. The study found that the local boundary layer fitting results are more suitable for calculating the design wind speed for the bridge deck.
8.1.5 Aeolian vibration wind tunnel test for stay cables
For large-span bridges located in the high-cold mountainous areas of Western China and other regions, due to the frequent occurrence of disastrous weather and the complexity of wind resistance issues, it is necessary to carry out specialized studies on the anti-icing forms and dimensions of stay cables. Understanding the types of ice formation on stay cables and statistical geometric characteristics of various forms provides necessary parameter for the study of bridge wind resistance, facilitating the design and construction of bridges.
The test equipment for cable icing tests includes artificial rainmakers, plastic sleeves with a smoothness close to that of the actual bridge stay cables, and various supporting structures. The test needs to be conducted outdoors in a temperature range of −10 ℃ to −5 ℃ with natural wind.
The main process of the experiment is as follows: first, a sturdy "gantry" frame is assembled, and the artificial rainmaker is fixed to the top of the frame; then, foam boards are glued to form a structure for placing plastic sleeves, which are placed under the "gantry" frame and secured to the ground, with the test sleeves inclined at 35° and 30° to simulate the actual stay cable sleeves with smaller inclination angles, placed on the foam board; finally, the artificial rainmaker is turned on, and after simulating the rainfall environment for 8 h, the experimental results are observed and recorded (Fig. 217). The above experiment is conducted three times under the same conditions and in the same location, observing the results and recording data.
![]() Figure 217. Icing test setup for stay cables. (a) Test sleeves on foam boards. (b) Gateway frame.
Figure 217. Icing test setup for stay cables. (a) Test sleeves on foam boards. (b) Gateway frame.Through the experiments, it was found that the main forms of ice formation on the cables are discrete icicles, non-uniform expansion (with and without ice crystal clusters), and an "ice blanket" similar to axial flow (Fig. 218). Parameter regarding the types of ice formation and their geometric characteristics have been summarized, which are used to guide computational fluid dynamics (CFD) numerical calculations.
![]() Figure 218. Icing patterns on stay cables. (a) Discrete icicles. (b) Non-uniform expansion (with ice crystal clusters). (c) Non-uniform expansion (without ice crystal clusters). (d) Axial-flow-like ice blanket.
Figure 218. Icing patterns on stay cables. (a) Discrete icicles. (b) Non-uniform expansion (with ice crystal clusters). (c) Non-uniform expansion (without ice crystal clusters). (d) Axial-flow-like ice blanket.There are two common methods for designing the aerodynamic model of stay cables in wind tunnel tests: First, a steel wire rope is used as the load-bearing skeleton, with multiple layers of foam and other materials wrapped around it to form the aerodynamic shape, and the outermost layer is covered with an outer skin, making the model a complete component. This method results in a cable model with higher damping, which cannot effectively simulate the low damping ratio characteristics of high-order vibration of the cables. Second, a steel wire rope serves as the core, and the cable is divided into multiple segments, which are then spliced together to form a complete cable model. This simulation method can more accurately model the high-order vibrations of the cables.
The aerodynamic model test of the stay cables uses a video displacement meter system for data collection (Fig. 219), which includes a video collection device, lighting device, and signal collection and processing system. This system can collect and analyze the displacement and vibration mode of multiple measurement points in the experiment through the image video collected by the video displacement meter. It identifies the natural texture of the surface of the object to be tested and tracks its movement to obtain the displacement-time curve. Its biggest advantage is the ability to collect displacement data from a large number of measurement points on a relatively complex system in a non-contact manner, obtaining important information such as the actual displacement and frequency characteristics of the structural response. Currently, the maximum sampling frequency of this system is 60 Hz, and the sampling time in the experiment is the same as that of the accelerometer, which is 80 s.
![]() Figure 219. Video displacement meter system (Li, 2021). (a) Video collector. (b) Fill light. (c) Data acquisition and processing system.
Figure 219. Video displacement meter system (Li, 2021). (a) Video collector. (b) Fill light. (c) Data acquisition and processing system.8.2 Other structural wind tunnel test technologies
8.2.1 Photovoltaic panels
In recent years, under the "dual carbon" policy, solar photovoltaic components have been widely applied. Photovoltaic supports can generally be divided into fixed photovoltaic supports, tracking photovoltaic supports, flexible photovoltaic supports, and photovoltaic for highway slopes.
Wang et al. (2023) conducted a wind tunnel test study on the wind load characteristics of flat single-axis photovoltaic components with a large aspect ratio (Fig. 220). It was found that the distribution of local body coefficients shows a gradient change along the direction of the incoming wind flow. The separation of the airflow leads to drastic changes and extreme values in the local wind load at the windward corner positions (Fig. 221).
![]() Figure 221. Local shape coefficient distribution diagrams for each photovoltaic panel.
Figure 221. Local shape coefficient distribution diagrams for each photovoltaic panel.Flexible photovoltaic supports are a new type of photovoltaic support, mainly composed of steel columns, diagonal cables, and flexible cables (i.e., steel wires or strand). They have the characteristics of large span, flexible adjustability, and saving on land and materials. They can be widely used under complex terrain conditions. However, their low stiffness, light weight, and low vibration frequency make the flexible photovoltaic supports more sensitive to wind loads. Therefore, it is necessary to carry out aeroelastic experiments on flexible photovoltaic components to evaluate their wind resistance performance and wind-induced vibration response.
The aeroelastic model test of photovoltaic panels mainly includes flutter tests and buffeting tests (Fig. 222). Flutter tests are conducted in a uniform wind field, while buffeting tests consider the impact of turbulence. As shown in Fig. 223, for photovoltaic components with an angle of inclination not equal to 0, their critical flutter wind speed is always less than the flutter check wind speed (30.94 m/s).
![]() Figure 222. Aeroelastic model of photovoltaic panels in the laboratory. (a) Test model under turbulent flow conditions. (b) Test model under uniform flow conditions.
Figure 222. Aeroelastic model of photovoltaic panels in the laboratory. (a) Test model under turbulent flow conditions. (b) Test model under uniform flow conditions.![]() Figure 223. Flutter critical wind speed. (a) Flutter critical wind speed of photovoltaic modules at different wind incidence angles. (b) Flutter critical wind speed of photovoltaic modules at different tilt angles.
Figure 223. Flutter critical wind speed. (a) Flutter critical wind speed of photovoltaic modules at different wind incidence angles. (b) Flutter critical wind speed of photovoltaic modules at different tilt angles.Applying bridge wind resistance experience to flexible photovoltaic supports, it can be observed that vertical guide vanes can effectively reduce the amplitudes of various vibrations in flexible photovoltaic components (Fig. 224).
![]() Figure 224. Effectiveness of measures in reducing vibrations for flexible photovoltaic modules. (a) The vibration suppression effect of the measures on the vertical displacement response. (b) The vibration suppression effect of the measures on the torsional displacement response.
Figure 224. Effectiveness of measures in reducing vibrations for flexible photovoltaic modules. (a) The vibration suppression effect of the measures on the vertical displacement response. (b) The vibration suppression effect of the measures on the torsional displacement response.8.2.2 Lightning rods
Crosswind-induced vortex resonance can lead to fatigue cracking of the connecting bolts at the base flange of steel lightning rods, ultimately causing the overall collapse of the steel lightning rods. Therefore, it is necessary to conduct aeroelastic model wind tunnel tests on steel lightning rods to study their vortex vibration performance and propose effective vibration suppression measures.
The aeroelastic models of steel lightning rods (330 kV, 500 kV, 750 kV) were tested in the CA-01 atmospheric boundary layer wind tunnel at the Chang'an University Wind Tunnel Laboratory (Figs. 225 and 226). The wind speed in the test flow field was measured and monitored using a pitot tube and a micromanometer. Measurement points were arranged at the top of the lightning rods, with along-wind and crosswind accelerom installed respectively. The study found that all three models of steel lightning rods experienced vortex vibrations of different orders; subtle changes in the frequency of the steel lightning rods could lead to changes in the locked order of vortex vibrations and the wind speed of vortex vibration.
Existing specifications for vortex generators and parameter such as vortex shedding plates are derived from steel pipe beams with constant cross-section and constant wind speed, which are not applicable to steel lightning rods with variable cross-section and wind speed. Therefore, wind tunnel tests were conducted to evaluate the vibration suppression effects of various measures (continuous vertical pipes, spiral lines, rectangular vortex strips, circular horizontal flow dividers, combined flow dividers, rough surface treatment, low wind pressure vortex generators, etc.). It was found that low wind pressure vortex generators had good vibration suppression effects on all three types of steel lightning rods.
To facilitate manufacturing and reduce the workload in actual engineering projects, based on the principle of equivalent area, a single-layer low wind pressure vortex generator was proposed by combining two layers of low wind pressure vortex generators into one and appropriately enlarging the diameter of individual vortex shedding holes (Figs. 227 and 228). In Fig. 228, black represents the original low wind pressure vortex generator measure, and blue represents the single-layer low wind pressure vortex generator measure. From the acceleration amplitude variation curve with wind speed (Fig. 229), it can be seen that after the addition of low wind pressure vortex generators, there is no obvious vortex vibration range, and the improved single-layer low wind pressure vortex generator has a more pronounced vortex vibration control effect. The test results prove that the single-layer low wind pressure vortex generator has better vibration suppression effects than the original low wind pressure vortex generator.
![]() Figure 227. Arrangement diagram of vortex generators along the lightning rod. (a) Original low wind pressure vortex generators (total 16 layers). (b) Single-layer low wind pressure vortex generators (total 8 layers).
Figure 227. Arrangement diagram of vortex generators along the lightning rod. (a) Original low wind pressure vortex generators (total 16 layers). (b) Single-layer low wind pressure vortex generators (total 8 layers).![]() Figure 228. Detail diagrams of vortex generators. (a) Original low wind pressure vortex generators (total 16 layers). (b) Single-layer low wind pressure vortex generators (total 8 layers).
Figure 228. Detail diagrams of vortex generators. (a) Original low wind pressure vortex generators (total 16 layers). (b) Single-layer low wind pressure vortex generators (total 8 layers).![]() Figure 229. Comparison of acceleration time history curves in the vortex-induced-vibration lock-in region. (a) Without vibration suppression measures. (b) Original low wind pressure vortex generators. (c) Single-layer low wind pressure vortex generators.
Figure 229. Comparison of acceleration time history curves in the vortex-induced-vibration lock-in region. (a) Without vibration suppression measures. (b) Original low wind pressure vortex generators. (c) Single-layer low wind pressure vortex generators.8.2.3 Building surface pressure and velocity measurement tests
For certain buildings with special structures or located in unique geographical positions, wind load is one of the main loads for structural design. To ensure wind resistance safety, wind tunnel testing is necessary. These tests can determine relevant parameter such as the average pressure coefficient, fluctuating pressure coefficient, extreme value pressure coefficient, gust load, extreme wind load, and extreme average wind load on the building surface. Measures for structural wind resistance design can be taken based on the results of wind tunnel tests. Such buildings include archaeological sheds without intermediate columns and without excavation foundations (Fig. 230), buildings with high main structures (Fig. 231), buildings with complex shapes, buildings with large-span roof structures (Fig. 232), and groups of buildings located at high altitudes (Fig. 233), etc.
![]() Figure 233. Wind tunnel testing of a rigid body model of high-altitude building clusters.
Figure 233. Wind tunnel testing of a rigid body model of high-altitude building clusters.Test conditions must be arranged according to the actual situation of the building. For example, for archaeological sheds, both the open and closed states of the shed should be considered. The arrangement of measurement points should take into account the number of scanning valves and the characteristics of the building. Double-sided measurement points should be set at positions where the pressure difference between the inside and outside needs to be considered; dense measurement points are required at key areas such as the roof, while other areas may only require single-sided pressure measurement.
In addition to using electronic pressure scanning valves for pressure measurement tests on rigid models, the velocity distribution on the building surface can also be measured by Irwin probes (Fig. 234). The Irwin probe is cylindrical in shape, with the upper end of the column flush with the surface being measured, and there is a pressure measurement hole in the middle, from which a very thin probe extends. The data obtained by the Irwin probe are the wind pressure data at the location of the probe, including both total pressure and static pressure. The wind pressure data can be converted by a coefficient to obtain the wind speed data at the Irwin probe location. Therefore, the Irwin probe is a non-directional velocity probe, and the obtained speed is the vector sum of the velocity at the measurement point.
![]() Figure 234. Owen probe. (a) Schematic diagram of the Owen probe structure. (b) The Owen probe used in the experiment.
Figure 234. Owen probe. (a) Schematic diagram of the Owen probe structure. (b) The Owen probe used in the experiment.Before the experiment, Irwin probes must be embedded at the center of the model surface, perpendicular to the surface, and a calibration test for the Irwin probe must be conducted to determine the conversion coefficient corresponding to each Irwin probe.
During the stack production process, based on the data collection requirements of the test site, the Irwin probe pre-embedding scheme is divided into two layout forms: normal hole opening and staggered hole drilling. The layout of the Irwin probes in the stack model is shown in Fig. 235.
![]() Figure 235. Model with Owen probes arranged. (a) Schematic diagram. (b) Wind tunnel setup diagram.
Figure 235. Model with Owen probes arranged. (a) Schematic diagram. (b) Wind tunnel setup diagram.8.3 Flow field simulation techniques
8.3.1 Two-dimensional flow field control
In wind tunnel tests, the uniform flow field is often disturbed by the three-dimensional flow around the ends of the sectional model and the aerodynamics of auxiliary components. To address this issue, Gao et al. (2021a) proposed a wind tunnel internal support test device that ensures the two-dimensional flow characteristics of the sectional model (Fig. 236), which includes a streamlined shell in the shape of an airfoil and an internal support structure.
![]() Figure 236. Wing-type support structure. (a) Schematic diagram. (b) Wind tunnel setup diagram.
Figure 236. Wing-type support structure. (a) Schematic diagram. (b) Wind tunnel setup diagram.In Fig. 236(a), the structures are as follows: mounting plate 1, support frame 3, horizontal partition 4, jack 5, universal wheel 6, metal ring 7, support rod 8, T-shaped pulley 10, brake pad 11, sectional model 12, and leaf spring 15.
Yan (2023) utilized computational fluid dynamics (CFD) numerical simulation technology to analyze and improve the uniformity of the flow field and the thickness of the boundary layer for a new type of wind tunnel internal wing-shaped support. It was found that the uniformity of the wind field between the newly adopted wind tunnel internal wing-shaped support devices was good (Fig. 237), with no significant vortex shedding (Fig. 238).
![]() Figure 237. Wind speed along the spanwise direction of the wing-type support structure.
Figure 237. Wind speed along the spanwise direction of the wing-type support structure.In sectional model tests with large scales, the uniform flow field is also subject to interference from three-dimensional end flows and aerodynamics of auxiliary components such as suspension arms. To address this issue, the Chang'an University Wind Tunnel Laboratory has designed end walls for large-scale models (Fig. 239). Due to the larger mass of large-scale models, the supports for these models require greater strength and stability compared to the wing-shaped supports of sectional models. Considering the handling issues, the wing-shaped supports were not adopted, but a uniform flow field quality can still be ensured.
8.3.2 Three-dimensional flow field simulation
Simulating the atmospheric boundary layer wind field in a wind tunnel is an important aspect of wind tunnel experiments. Sharp-edged wedges and roughness elements are widely used in atmospheric boundary layer simulations within wind tunnel tests (Fig. 240). This technique can simulate the average wind speed and turbulence profiles characteristic of different terrain features. The wind profile is fitted by changing the shape, quantity, and spacing of the wedges and roughness elements (Fig. 241).
![]() Figure 241. Results of simulating a turbulent wind field. (a) Wind profile. (b) Turbulence intensity profile.
Figure 241. Results of simulating a turbulent wind field. (a) Wind profile. (b) Turbulence intensity profile.Data collection is performed using a three-dimensional fully automatic traversing system (Fig. 242) equipped with a three-dimensional pulsating anemometer for sampling. It can simultaneously collect parameter such as wind speed, wind attack angle, wind pressure, and turbulence intensity. The three-dimensional traversing system is an advanced measurement device with translational freedom on the three spatial axes (X, Y, Z), allowing for full-orientation precise positioning within the wind tunnel test section and significantly reducing test time.
In addition to the traversing system, the pipe array (Fig. 243) is also an important means of measuring wind profiles. When the wind flows over the pressure holes on the outer wall of the pipe array, a pressure difference is generated at the hole mouth. The captured small pressure difference is converted into the wind speed value of the corresponding point through Bernoulli's equation. A single measurement can obtain data from multiple points, and after summarizing all the measurement point data, a wind speed distribution map can be depicted for that linear path. This design greatly improves the efficiency of wind speed measurement, and according to the spacing of the pressure holes, the measurement precision can be flexibly adjusted, suitable for studying the details of complex flow fields.
In addition to simulating turbulent wind fields with sharp-edged wedges and roughness elements, grid turbulence is another passive simulation method commonly used in various wind tunnel tests. The parameter of the turbulent wind field simulated by the grid are mainly related to the distance between the measurement point and the grid section, the thickness of the grid plate bars, and the edge length of the grid unit. Bai et al. (2016b) used the wind tunnel test method to test the local turbulent wind field parameter formed by grids of different forms (Fig. 244) and found that a cross-section 3.5 m away from the grid can form a locally uniform turbulent wind field. They provided formulas for estimating turbulence intensity and turbulence integral scale based on grid spacing and grid width, which facilitates the adjustment of local turbulent wind fields.
Due to the large aspect ratio of the CA-03 wind tunnel cross-section, the design and installation of sharp-edged wedge devices can be quite troublesome. To address this, the team has developed a variable spacing grid device. The principle of this device is consistent with that of the sharp-edged wedge system, both adjusting wind speed by changing the blockage ratio. The grid rails are fixed to the wind tunnel's floor and ceiling, with grid bars that can slide within the rails and be secured in place by clips at specific positions (Fig. 245). When there is a change in wind speed conditions, it is only necessary to move the grid position and adjust the number of grid bars. The small cross-sectional size of the grid bars allows for more precise adjustments to the incoming flow.
![]() Figure 245. Grid apparatus in the laboratory. (a) Schematic diagram. (b) Wind tunnel setup diagram.
Figure 245. Grid apparatus in the laboratory. (a) Schematic diagram. (b) Wind tunnel setup diagram.8.3.3 Special wind simulation
The downburst-like outflows simulation device at the CA-04 Chang'an University Wind Tunnel Laboratory is shown in Fig. 246. It has a nozzle diameter of 500 mm and a height of 1000 mm from the nozzle to the ground. The device is cylindrical with an inner diameter of 810 mm. Casters are installed beneath the device, which, in conjunction with a 6-m-long rail system below, allows for the simulation of moving downburst-like outflows. The schematic diagram of the downburst occurrence device is depicted in Fig. 246. The experimental device's wind tunnel is composed of four parts, the inlet section, the power section, the stabilization section, and the contraction section. To better adapt to the designed linearity of the wind tunnel curve, the inlet section uses a circular curve, the power and stabilization sections use straight lines, and the contraction section features a double cubic curve that is relatively gentle at both the inlet and outlet.
![]() Figure 246. CA-04 downburst simulation apparatus in the laboratory. (a) Schematic diagram (unit: mm). (b) Wind tunnel setup diagram.
Figure 246. CA-04 downburst simulation apparatus in the laboratory. (a) Schematic diagram (unit: mm). (b) Wind tunnel setup diagram.To reduce the significant vibration that occurs during the operation of the equipment, 10 mm thick foam pads are installed between each section. A hexagonal honeycomb device is installed in the stabilization section to reduce the turbulence of the wind field. The power section uses a low-noise axial flow fan made entirely of copper, with four blades, and is equipped with a GDB series frequency converter to adjust the fan speed.
The downburst simulation device's wind tunnel is equipped with an electric angular adjustment device on the side, allowing the downburst to rotate at an angle of −60°–60° along the direction of movement. The downburst instrument is mainly supported by a steel square tube bracket with a thickness of 3 mm. Fig. 247 shows the front view and side view of the downburst device's support structure.
![]() Figure 247. Schematic diagram of the downburst apparatus support structure (unit: mm). (a) Front view. (b) Side view.
Figure 247. Schematic diagram of the downburst apparatus support structure (unit: mm). (a) Front view. (b) Side view.When simulating moving downbursts in experiments, the device is placed inside the CA-01 wind tunnel at the Chang'an University Wind Tunnel Laboratory, which relies on an atmospheric boundary layer wind tunnel to provide ambient wind for the downburst simulation. The wind speed at specific measurement points within the jet wind field provided by the downburst simulation device is measured using the Cobra probe, a three-dimensional pulsating anemometer produced by Turbulent Flow Instrumentation from Australia.
9. The application of wind resistance theory and technology in typical engineering projects
9.1 Introduction
Vortex-induced-vibration (VIV) and flutter have always been two key concerns in the wind resistance of long-span bridges. As the primary factor in the wind-resistant design of long-span cable-stayed bridges, the traditional linear analysis theory of bridge flutter has become increasingly refined over decades of development. For the "hard flutter" of long-span bridges, when considering nonlinear effects such as the additional attack angle caused by the mean wind load, the linear theory can provide predictions with a precision comparable to that of full-bridge aeroelastic model wind tunnel tests. With the development of ultra-long-span bridges, due to the decreasing scale ratio of full-bridge aeroelastic models, wind-resistant design will increasingly rely on high-precision three-dimensional flutter analysis. For the "soft flutter" of long-span bridges, which lacks a clear critical state of flutter and exhibits significant aerodynamic nonlinearity, the linear flutter analysis theory based on eigenvalue analysis cannot describe the characteristics of soft flutter. Therefore, in recent years, the nonlinear flutter of bridges and its computational theory have become new research hotspots.
The main hazard of vortex-induced-vibration in bridge main beams lies in affecting driving comfort and safety, while vortex-induced-vibration of bridge components can lead to structural fatigue, and has always been a focus of attention. In the first half of 2020, vortex-induced-vibration events in long-span bridges such as the Humen Bridge further increased the intensity of research on bridge vortex-induced-vibration. To suppress bridge vortex vibration, vibration suppression measures are mainly taken to control it and ensure it meets regulatory requirements, but current research on vibration suppression measures is still focused on traditional aerodynamic measures. Since vortex vibration heavily depends on the aerodynamic shape of the main beam, traditional measures are currently unable to completely change the status quo of "one bridge, one case."
This chapter takes six long-span bridges as research objects to explore the enhancement of their flutter performance and vortex vibration suppression measures. It includes the vortex vibration issues of the Hong Kong-Zhuhai-Macao Bridge, Humen Bridge, Huangmaohai Bridge, and Longmen Bridge, proposing appropriate vibration suppression measures. For the Shenzhong Bridge and Zhangjinggao Bridge, optimization plans for flutter performance are proposed and applied to practical engineering, effectively solving the wind-induced vibration problems encountered in the operation of the bridges.
9.2 Vortex-induced-vibration control of the Hong Kong-Zhuhai-Macao bridge
9.2.1 Project overview
9.2.1.1 Project background
The Hong Kong-Zhuhai-Macao Bridge spans the Lingdingyang Sea area of the Pearl River Estuary, connecting the Hong Kong Special Administrative Region, Zhuhai City in Guangdong Province, and the Macao Special Administrative Region. It is a large-scale cross-sea channel and a key traffic construction project included in the "National Expressway Network Plan." The bridge has a total length of approximately 22.9 km, which includes three navigable openings—Qingzhou Navigation Bridge (a double-tower spatial cable-stayed steel box girder bridge with a main span of 458 m), Jianghai Direct Ship Navigation Bridge (a three-tower central cable-stayed steel box girder bridge with a main span of 2 × 258 m), and Jiuzhou Navigation Bridge (a double-tower central cable-stayed steel box girder bridge with a main span of 268 m)—as well as other non-navigable span bridges.
The Jianghai Direct Ship Navigation Bridge, a three-tower cable-stayed bridge, has a span arrangement of (110 + 129 + 258 + 258 + 129 + 110) m, with a total length of 994 m. The bridge features steel towers, with the central tower reaching a height of 109.8 m and the side towers at 108.50 m. The main beam is a steel box girder. For the steel tower scheme, the full width of the main beam at the lamp post location is 39.75 m, narrowing to 38.80 m where there are no lamp posts, with a height of 4.58 m at the centerline. The bridge layout, main beam cross-section, and general structure of the towers are shown in Figs. 248 to 250.
9.2.1.2 Design wind parameter
According to the "Hong Kong–Zhuhai–Macao Bridge Site Continuous Meteorological Observation and Wind Parameter Special Research Annual Report, " the design wind parameter for the Jianghai Direct Ship Navigation Bridge are obtained, as shown in Table 21.
Table 21. Design basic wind speed for the Jianghai Direct Ship Navigation Bridge.Reference wind speed (m/s) Flutter test wind speed (m/s) Bridge completion stage 52.83 79.88 Construction stage 44.38 67.10 9.2.1.3 Dynamic characteristic calculation
By analyzing and calculating the frequencies and modes of vibration of the bridge structure, one can understand its inherent dynamic characteristics. This understanding is crucial for improving the structure's wind resistance and providing ideas for design modifications. The results of the dynamic characteristic calculations for the bridge tower in its self-standing state and in the completed bridge state are presented in Tables 22 and 23, respectively.
Table 22. Natural frequencies, equivalent masses, and mode shapes of the main vibration modes for the self-standing cable tower.Mode shape Frequency Equivalent mass Vibration mode description 1 0.5757 3.22 t/m First-order lateral bending of the cable tower 2 0.8296 3.49 t/m First-order longitudinal bending of the cable tower 3 2.8970 2.82 t/m Second-order lateral bending of the cable tower 4 3.7194 2450 t·m2/m First-order torsion of the cable tower 5 5.4113 4.69 t/m Second-order longitudinal bending of the cable tower 7 8.9452 530 t·m2/m Second-order torsion of the cable tower Table 23. Natural frequencies, equivalent masses, and mode descriptions of the first 15 principal vibration modes before bridge completion.Mode shape Frequency Equivalent mass Vibration mode description 1 0.3373 35 t/m First-order anti-symmetric symmetric vertical bending of the main beam 2 0.3375 33.4 t/m First-order anti-symmetric symmetric vertical bending of the main beam 4 0.5217 34.2 t/m First-order symmetric same-direction vertical bending of the main beam 9 0.8811 31.4 t/m First-order anti-symmetric same-direction vertical bending of the main beam 10 0.9082 32.7 t/m First-order anti-symmetric opposite-direction lateral bending of the main beam 11 1.0214 3630 t·m2/m First-order torsion of the main beam 13 1.0780 3590 t·m2/m Second-order torsion of the main beam 14 1.1190 28.4 t/m Second-order anti-symmetric same-direction vertical bending of the main beam 9.2.2 Main beam segmental model vibration test
9.2.2.1 Experimental model and param
The sectional model vibration test (CUWTL, 2012), was conducted in the CA-01 atmospheric boundary layer wind tunnel of the Chang'an University Wind Tunnel Laboratory. Based on the actual bridge main beam cross-section dimensions, the wind tunnel test section size, and the requirements of the direct testing method, a scale ratio of 1:50 was selected for the sectional model. The rigid sectional model was made of lightweight synthetic materials. The suspension schematic for the construction state and the bridge completion state is shown in Fig. 251. The model design parameter are shown in Table 24.
![]() Figure 251. Schematic diagram of the suspension of the main beam vibration measurement sectional model. (a) Construction stage. (b) Bridge completion stage.Table 24. Design parameter of the vortex-induced-vibration test sectional model.
Figure 251. Schematic diagram of the suspension of the main beam vibration measurement sectional model. (a) Construction stage. (b) Bridge completion stage.Table 24. Design parameter of the vortex-induced-vibration test sectional model.Working condition Parameter name Symbol Unit Actual bridge value Scale ratio Designed model value Measured model value Error (%) Bridge completion stage Equivalent mass m kg/m 29,200 1/502 11.68 11.54 1.20 Equivalent mass moment of inertia Jm kg·m2/m 2,850,000 1/504 0.46 – – Vertical bending fundamental frequency fv Hz 0.1764 50/2.5 3.53 3.50 0.85 Torsional fundamental frequency ft Hz 1.1111 50/5.8 9.58 9.58 0 Vertical bending damping ratio ζv – – – – 0.0028 – Torsional damping ratio ζt – – – – 0.0031 – Construction stage Equivalent mass m kg/m 35,000 1/502 14.00 13.93 0.50 Equivalent mass moment of inertia Jm kg·m2/m 3,630,000 1/504 0.58 – – Vertical bending Fundamental frequency fv Hz 0.3373 50/2.5 6.75 6.67 1.19 Torsional fundamental frequency ft Hz 1.0214 50/2.5 20.43 20.02 2.01 Vertical bending damping ratio ζv – – – – 0.0025 – Torsional damping ratio ζt – – – – 0.0027 – 9.2.2.2 Experimental condition setup
According to the test requirements of the "Hong Kong–Zhuhai–Macao Bridge Main Project Bridge Construction Drawing Design Stage Jianghai Direct Ship Channel Bridge Structural Wind Resistance Performance Test Research Work Outline", the incoming wind attack angles were set at −5°, −3°, 0°, +3°, and +5°. The main beam was tested in both the construction and completion states of the bridge. The wind speed ratio for vertical bending vibration was 1:2.5, and for torsional vibration, it was 1:5.8.
9.2.2.3 Original cross-section experimental results
The experimental results for the construction state and bridge completion state are shown in Fig. 252.
![]() Figure 252. Experimental results of the original cross-section. (a) Construction state vertical bending vortex-induced-vibration. (b) Construction state torsional vortex-induced-vibration. (c) Bridge completion state vertical bending vortex-induced-vibration. (d) Bridge completion state torsional vortex-induced-vibration.
Figure 252. Experimental results of the original cross-section. (a) Construction state vertical bending vortex-induced-vibration. (b) Construction state torsional vortex-induced-vibration. (c) Bridge completion state vertical bending vortex-induced-vibration. (d) Bridge completion state torsional vortex-induced-vibration.From Table 25, it can be seen that the main beam of the Jianghai Direct Ship Channel Bridge exhibits vertical bending and torsional vortex-induced-vibration exceeding the specified values in the construction state at angles of +5° and −5°, −3°.
Table 25. Comparison of maximum amplitudes of vortex-induced-vibration.Actual bridge frequency (Hz) Amplitude allowable value calculation formula Allowable value Maximum amplitude Conclusion Bridge completion stage Vertical 0.1764 0.04/fv 0.227 m 0.0165 m Meets requirements Torsional 1.1111 4.56/(B × ft) 0.106° 0.0527° Meets requirements Construction stage Vertical 0.3373 0.04/fv 0.119 m 0.3940 m Exceeds allowable value Torsional 1.0214 4.56/(B × ft) 0.115° 0.2483° Exceeds allowable value Note: fv represents the first-order symmetric vertical bending frequency; B is the bridge width; ft is the first-order symmetric torsional frequency. 9.2.2.4 Vibration damping measures
The sectional model test of the main beam for the Jianghai Direct Ship Channel Bridge showed obvious vertical bending and torsional vortex-induced-vibration phenomena, and the vortex vibration amplitude exceeded the value required by the specifications. Therefore, it is very necessary to conduct research on vibration suppression measures. A series of vibration suppression measures have been studied for the cross-section of the main beam of the Jianghai Direct Ship Channel Bridge, including solid railing with three open sections (Measure One), solid railing with two open sections (Measure Two), and sealing one-quarter of the railing (Measure Three), as shown in Fig. 253. The experimental results are shown in Fig. 254.
![]() Figure 253. Vortex-induced-vibration suppression measures. (a) Railing with one solid section and three sections. (b) Railing with one solid section and two sections. (c) Quarter of the railing sealed.
Figure 253. Vortex-induced-vibration suppression measures. (a) Railing with one solid section and three sections. (b) Railing with one solid section and two sections. (c) Quarter of the railing sealed.![]() Figure 254. Experimental results of vibration suppression measures. (a) Results of Measure One experiment, amplitude. (b) Results of Measure One experiment, torsion angle. (c) Results of Measure Two experiment, amplitude. (d) Results of Measure Two experiment, torsion angle. (e) Results of Measure Three experiment, amplitude. (f) Results of Measure Three experiment, torsion angle.
Figure 254. Experimental results of vibration suppression measures. (a) Results of Measure One experiment, amplitude. (b) Results of Measure One experiment, torsion angle. (c) Results of Measure Two experiment, amplitude. (d) Results of Measure Two experiment, torsion angle. (e) Results of Measure Three experiment, amplitude. (f) Results of Measure Three experiment, torsion angle.Based on the results, it can be observed that the railing with one solid section and two open sections (Measure Two) and sealing one-quarter of the railing (Measure Three) can effectively control the vortex-induced-vibration amplitude within the specified range for the bridge completion state. Therefore, it is planned to conduct validation experiments on the vibration suppression effects of Measure Two and Measure Three in a large-scale test.
9.2.3 Large-scale sectional model vibration suppression measures effectiveness verification experiment
The sectional model test of the main beam for the Jianghai Direct Ship Channel Bridge exhibited significant vertical bending and torsional vortex-induced-vibration phenomena, with vortex vibration amplitudes exceeding the values required by specifications. Therefore, research on vibration suppression measures was conducted. A series of vortex-induced-vibration suppression measures were studied on a small-scale model, including railing with one solid section and three open sections (Measure One), railing with one solid section and two open sections (Measure Two), and sealing one-quarter of the railing (Measure Three). According to the test results, the railing with one solid section and two open sections (Measure Two) and sealing one-quarter of the railing (Measure Three) can effectively control the amplitude of vertical bending and torsional vortex vibrations within the range specified by the regulations. Therefore, verification experiments were conducted on the large-scale sectional model for the railing with one solid section and two open sections (Measure Two) and sealing one-quarter of the railing (Measure Three) (Fig. 253).
9.2.3.1 Experimental model and param
The large-scale sectional model vibration test (CUWTL, 2012) was conducted in the CA-01 atmospheric boundary layer wind tunnel at the Chang'an University Wind Tunnel Laboratory. Based on the actual bridge main beam cross-section size, the wind tunnel test section size, and the requirements of the direct testing method, a scale ratio of 1:20 was selected for the sectional model. The rigid sectional model was made of lightweight synthetic materials. In this experiment, the simulation of elastic parameter modeled the first-order symmetric vertical bending and the first-order symmetric torsional vibration in the bridge completion state. For the model attitude at different attack angles, the measured vertical bending and torsional damping ratios fluctuated slightly within a certain range. The model suspension is shown in Fig. 255. The model parameter are shown in Table 26.
Table 26. Design parameter of the large-scale vortex-induced-vibration test sectional model.Working condition Parameter name Symbol Unit Actual bridge value Scale ratio Designed model value Measured model value Error (%) Bridge completion stage Equivalent mass m kg/m 35,000 1/202 87.50 86.67 0.95 Equivalent mass moment of inertia Jm kg·m2/m 3,630,000 1/204 22.69 – – Vertical bending fundamental frequency fv Hz 0.3373 20/2 3.37 3.38 0.30 Torsional fundamental frequency ft Hz 1.0214 20/2 10.21 10.15 0.59 Vertical bending damping ratio ζv – – – – 0.0036 – Torsional damping ratio ζt – – – – 0.0033 – 9.2.3.2 Working condition
Following the test requirements outlined in the "Hong Kong-Zhuhai-Macao Bridge Main Project Bridge Construction Drawing Design Phase Jianghai Direct Ship Channel Bridge Structural Wind Resistance Performance Test Research Work Outline, " the incoming wind attack angles were set at −5°, −3°, 0°, +3°, and +5°, conducted in a uniform flow with a wind speed ratio of 1:2.
9.2.3.3 Analysis of experimental results
The experimental validation results of the large-scale sectional model vibration suppression measures are shown in Fig. 256. During the experiment, vortex-induced-vibrations occurred, but the maximum amplitudes of vertical bending and torsional vibrations did not exceed the regulatory limits (vertical bending limit value of 0.119 m; torsional angle limit value of 0.115°), meeting the regulatory requirements. Therefore, Measure Two (railing with one solid section and two open sections) and Measure Three (sealing one-quarter of the railing) can be adopted as the final vibration suppression measures. One of them can be selected based on the ease of construction.
![]() Figure 256. Test results of vibration suppression measures for large-scale sectional model. (a) Results of Measure Two experiment, amplitude. (b) Results of Measure Two experiment, torsion angle. (c) Results of Measure Three experiment, amplitude. (d) Results of Measure Three experiment, torsion angle.
Figure 256. Test results of vibration suppression measures for large-scale sectional model. (a) Results of Measure Two experiment, amplitude. (b) Results of Measure Two experiment, torsion angle. (c) Results of Measure Three experiment, amplitude. (d) Results of Measure Three experiment, torsion angle.9.3 Humeng Bridge vortex-induced-vibration emergency response
9.3.1 Project overview
9.3.1.1 Project background
The Humen Bridge is a single-span suspension bridge with a main span of 888 m and a total length of 4588 m, consisting of 3 × 70 m prestressed concrete box girder continuous rigid frame bridges +888 m steel box girder suspension bridge +14 × 50 m prestressed concrete T-beam continuous rigid frame bridges +570 m prestressed concrete box girder continuous rigid frame bridge +16 × 50 + 15 × 30 m prestressed concrete T-beam continuous rigid frame bridges +48 × 20 m prestressed concrete hollow slab bridges. The layout of the main bridge spans is shown in Fig. 257. The stiffening girder is a fully welded flat closed streamline monocoque steel box girder, with a height of 3 m and a width of 35.6 m. The entire bridge's stiffening girder is divided into 34 standard sections, 1 middle section, 2 side sections, and 2 closure sections. The standard section is 24 m long. The standard cross-section of the main beam is shown in Fig. 258.
![]() Figure 258. Schematic diagram of the standard cross-section of the stiffening girder (unit: mm) (Ge et al., 2022).
Figure 258. Schematic diagram of the standard cross-section of the stiffening girder (unit: mm) (Ge et al., 2022).9.3.1.2 Fundamental dynamic properties
The dynamic characteristic analysis of the Humen Bridge employs the finite element method for discrete structures. To more accurately analyze the structural dynamic characteristics of this type of suspension bridge, a solid model was established with certain simplifications while ensuring that its mass and stiffness are consistent with the actual structure. The main vibration mode frequencies, equivalent masses, and mode descriptions are shown in Table 27.
Table 27. Computational results of dynamic characteristics.Vibration mode Solid model frequency (Hz) Equivalent mass Mode description 1 0.0875 – First-order symmetric lateral bending 2 0.1658 – First-order symmetric vertical bending 3 0.2345 – Second-order symmetric vertical bending* 4 0.2705 – Second-order antisymmetric vertical bending* 5 0.2822 23.4 t/m First-order antisymmetric lateral bending 6 0.3596 23.61 t/m First-order antisymmetric torsion 7 0.3646 – Third-order symmetric vertical bending 8 0.3663 2910 t·m2/m First-order symmetric torsion 9.3.1.3 Background of vortex-induced-vibration occurrence
When the Humen Bridge experienced vortex-induced-vibrations, the measured wind direction was from the southeast. The incoming flow was essentially perpendicular to the main beam, with a deviation angle of 90° ± 7°. The entire temporary barrier extended continuously from a quarter of the span to the bridge tower, exceeding a length of 600 m, severely disrupting the aerodynamic structure of the streamlined box girder, which led to the occurrence of vortex-induced-vibrations. The multiple occurrences of vortex-induced-vibrations after the removal of the temporary water-filled barriers were due to the reduced damping ratio caused by the large amplitude vortex-induced-vibrations that had occurred earlier.
9.3.2 Main beam sectional model vibration measurement experiment
9.3.2.1 Dynamic sectional model
The sectional model vortex-induced-vibration test (Chang'an University Wind Tunnel Laboratory, 2020a) was conducted in the CA-01 wind tunnel at Chang'an University. The model had a geometric scale ratio of 1:60, with the stiffening girder made from aviation wood, and accessories such as railings and maintenance tracks were carved from plastic sheets according to the drawing dimensions, forming a two-degree-of-freedom vibration system that could move vertically and rotate around the model axis. The model was suspended from the frame by eight tension springs, simulating the two-dimensional flow in wind tunnel tests with end plates installed at both ends. The test rig was placed outside the tunnel wall to avoid flow field interference. The dynamic sectional model installed in the wind tunnel is shown in Fig. 259.
![]() Figure 259. Schematic diagram of the main beam sectional model suspended in the wind tunnel.
Figure 259. Schematic diagram of the main beam sectional model suspended in the wind tunnel.The experiment used the measured vortex-induced-vibration mode of the Humen Bridge as a reference, specifically the second-order antisymmetric vertical bending mode (other vertical bending modes were converted according to the corresponding wind speed ratio), and conducted vortex-induced-vibration tests with a vertical damping ratio of about 0.30%. The dynamic system design parameter of the vortex vibration model is detailed in Table 28.
Table 28. Vortex-induced-vibration test model parameter for bridge completion state.Parameter Symbol Unit Scale ratio Actual bridge Model design value Model measured value Girder height H m 1/60 3 0.05 0.05 Girder width B m 1/60 35.6 0.59 0.59 Equivalent mass per meter of length m kg/m 1/602 24,376.6 6.771 6.771 Equivalent mass moment of inertia per meter of length Jm kg·m2/m 1/604 5,551,970 0.428 0.431 Vertical bending frequency fv Hz – 0.2765 – 3.125 Vertical bending damping ratio ζv – 1 0.3% 0.3% 0.22% Wind speed ratio – – – – 1:5.31 Torsional frequency ft Hz – 0.3612 6.688 6.67 Torsional damping ratio ζt – 1 0.3% 0.3% 0.29% Wind speed ratio – – – – 1:3.24 9.3.2.2 Original cross-section vortex-induced-vibration performance
For the original design cross-section of the Humen Bridge, experiments were conducted under five attack angle conditions. The test inflow was a uniform flow, and the relationship curve between the actual bridge vertical amplitude and wind speed is shown in Fig. 260. According to the test results, it is indicated that the Humen Bridge is prone to vortex-induced-vibrations under low modal damping.
9.3.2.3 Vibration damping measures
In response to the vertical bending vortex-induced-vibrations occurring on the Humen Bridge, several aerodynamic measures have been proposed for control. The main adjustments involve changing the ventilation rate of the railings and the position of the maintenance car tracks, as well as adding spoiler and central stabilizers to optimize vortex-induced-vibration performance. To simplify the description and facilitate the combination of various measures in the following text, each vibration suppression measure is specifically numbered. A summary of the vibration suppression measures is shown in Table 29.
Table 29. Summary of vibration suppression measures.Measure type Specific content Schematic diagram Railing turbulence generators 40 cm, 45° (A) 
30 cm, 45° (B) 50 cm, 45° (C) Maintenance car track Inner turbulence boards adjacent to outer maintenance car tracks (D) Removal of central maintenance car track (E) Removal of outer maintenance car track (F) Inner maintenance car track spacing of 8.2 m (G) Inner maintenance car track spacing of 6 m (H) Outer maintenance car track moved inward to 1.8 m from the bottom of the diagonal web plate (I) Railing Railing closed at every third step (K) Railing closed at every second step (L) Upper central stabilizer Upper central stabilizer (M) Now, the aerodynamic measures are combined to form a summary table of combined aerodynamic measures, and the experimental results at different attack angles are uniformly included (vortex vibration did not occur when the attack angle is not listed). As shown in Table 30.
Table 30. Experimental results of vibration suppression measures.Wind attack angle Actual bridge wind speed Amplitude (mm) Specification value (mm) Conclusion +5° 8.70 430.00 145 Not satisfied +3° 8.70 435.00 145 Not satisfied 0° 8.30 412.00 145 Not satisfied −3° 6.40 345.00 145 Not satisfied −5° 7.50 301.00 145 Not satisfied +5° 8.30 173.00 145 Not satisfied 0° 8.30 35.00 145 Satisfied −3° 8.30 23.00 145 Satisfied −5° 7.00 12.00 145 Satisfied +5° 11.50 19.00 145 Satisfied +5° 17.00 100.00 145 Satisfied −3° 6.90 31.00 145 Satisfied +5° 8.49 474.60 145 Not satisfied +5° 8.49 441.69 145 Not satisfied +3° 8.49 183.60 145 Not satisfied +5° 8.49 138.57 145 Satisfied +5° 7.70 75.00 145 Satisfied +3° 8.50 65.00 145 Satisfied 0° 8.30 64.00 145 Satisfied −3° 8.20 57.00 145 Satisfied −5° 6.80 83.00 145 Satisfied +5° 8.70 36.00 145 Satisfied +3° 7.80 50.00 145 Satisfied 0° 7.90 52.00 145 Satisfied −3° 7.30 55.00 145 Satisfied −5° 7.20 75.00 145 Satisfied Through experimental studies, it was determined to adopt the installation of 45°, 50 cm turbulence generators on the windward side of the railings as a temporary vibration suppression measure. The experimental results showed that under this measure, the maximum vertical bending amplitude of the model's vortex vibration was only 66 mm, which meets the specification requirements. The vortex vibration performance of the Humen Bridge is greatly affected by the maintenance car, and the long duration, large amplitude vortex vibration that occurred on the Humen Bridge reduced the damping of the bridge system. Therefore, TMD dampers were ultimately installed as additional measures. The temporary measure of turbulence boards, the removal of the outer maintenance car track, and TMD were adopted as the final long-term permanent measures. The experimental results showed that under these long-term permanent measures, no obvious vortex vibration phenomena occurred on the model at all attack angles, and the vibration suppression effect was significant. The vibration suppression measures are shown in Fig. 261.
![]() Figure 261. Temporary and permanent vibration suppression measures for the Humen Bridge vortex-induced-vibrations. (a) Turbulence generators experimental setup. (b) Actual bridge installation. (c) Removal of outer maintenance car track. (d) Picture.
Figure 261. Temporary and permanent vibration suppression measures for the Humen Bridge vortex-induced-vibrations. (a) Turbulence generators experimental setup. (b) Actual bridge installation. (c) Removal of outer maintenance car track. (d) Picture.9.3.3 Vortex-induced-vibration related topics
Ge et al. (2022) proposed aerodynamic control and damping control measures in response to the causes of vortex-induced-vibrations on the Humen Bridge. Aerodynamic control measures included the installation of vibration suppression boards on the handrail tops and the removal of maintenance car tracks under the girders, while structural damping control measures involved the installation of tuned mass dampers (TMDs) to compensate for the reduced damping caused by the large-amplitude vortex-induced-vibration performance. These measures were successfully applied to the Humen Bridge after being validated through wind tunnel tests on sectional models with scales of 1:20 and 1:50.
Cui et al. (2023) proposed an analytical framework for assessing the probability of vortex-induced-vibration occurrence. Initially, a nonlinear aeroelastic model with multiple stable limit cycles was used to simulate the bridge deck's vortex-induced-vibration response under wind conditions that trigger vortex excitation. The first structural dynamic equilibrium point is usually unstable; the bridge deck's instantaneous oscillation amplitude, excited by external environmental loads, must exceed this fixed point to initiate vibration. By identifying the external excitation applied to the bridge deck that does not cause vibration, the probability of vortex-induced-vibration occurrence is then calculated using the Fokker-Planck-Kolmogorov equation. By combining environmental wind information, stochastic deck excitation intensity, and the nonlinear aeroelastic vortex-induced-vibration model, the probability of the bridge deck experiencing vortex-induced-vibration is assessed. The results show that the proposed method can approximate the probability of vortex-induced-vibration occurrence compared to empirical estimates from field measurements.
Gao et al. (2021c) proposed a method for identifying the Griffin plot based on the instantaneous development process of vortex-induced-vibration amplitude, specifically for the vertical bending vortex-induced-vibration of the Humen Bridge cross-section. The evolution of the vortex-induced-vibration stable amplitude with structural damping ratio and mass was identified, considering changes in structural damping ratio and mass to adjust the Scruton number. Detailed vibration parameter are listed in Table 31. Fig. 262(a) shows the vortex-induced-vibration response under different Scruton numbers, and Fig. 262(b) shows the results of the Griffin plot identification. It can be found that the A-Sc curve identified based on the instantaneous amplitude development process matches well with the stable amplitude measured in experiments, and the A-Sc curves identified under different Scruton numbers also match well. Changing the structural damping ratio or the system mass corresponds to the same Griffin curve, proving the rationality of the Scruton number's reflection of the comprehensive impact of structural mass-damping parameter.
Table 31. Vibration parameter of vortex-induced-vibration test for closed-box girder cross-section.Working Condition Frequency f (Hz) Mass M (kg) Damping ζs (%) Sc m* 1# 4.248 8.806 0.305 5.192 172.4 2# 4.346 8.806 0.442 7.529 172.4 3# 4.492 8.806 0.624 10.621 172.4 4# 4.492 8.806 0.859 14.620 172.4 5# 5.078 8.806 2.113 35.952 172.4 6# 4.199 10.546 0.874 17.797 206.4 7# 4.102 10.546 0.437 8.905 206.4 ![]() Figure 262. Humen Bridge stiffening girder cross-section vertical bending vortex-induced-vibration. (a) Vertical vortex vibration response at different Scruton numbers. (b) Identification results of the stable amplitude variation with Scruton number.
Figure 262. Humen Bridge stiffening girder cross-section vertical bending vortex-induced-vibration. (a) Vertical vortex vibration response at different Scruton numbers. (b) Identification results of the stable amplitude variation with Scruton number.With the Humen Bridge as the backdrop, Gao et al. (2021c) studied the impact of wind attack angle on the vortex-induced-vibration performance of its main beam, and conducted in-situ observations of the bridge, with a summary of wind conditions shown in Fig. 263. Using a sectional model for vibration measurement tests, they obtained vortex-induced-vibration responses at six wind direction angles from 0° to 25°. To more intuitively observe the impact of the wind attack angle, the ratio of vortex-induced-vibration amplitudes at each wind attack angle to those at 0° was taken as the experimental result. A comparison of the vertical bending vortex-induced-vibration amplitudes at different attack angles is shown in Fig. 264. Overall, under attack angles from 5° to 25°, the model's vertical bending vortex-induced-vibration still exists, but its amplitude shows a clear trend of decrease with the increase of the wind attack angle. A comparison of the torsional vortex-induced-vibration amplitudes at different attack angles is shown in Fig. 265. Compared with vertical bending vortex-induced-vibration, the impact pattern of the wind attack angle on torsional vortex-induced-vibration performance is not obvious. At the 0° and +3° attack angles, the existence of the wind attack angle amplifies the torsional vortex-induced-vibration amplitudes, while at the −3° attack angle, the amplitude is suppressed.
![]() Figure 264. Comparison chart of vertical bending vortex-induced-vibration amplitudes of the Humen Bridge stiffening girder at different wind attack angles.
Figure 264. Comparison chart of vertical bending vortex-induced-vibration amplitudes of the Humen Bridge stiffening girder at different wind attack angles.![]() Figure 265. Comparison chart of torsional vortex-induced-vibration amplitudes of the Humen Bridge stiffening girder at different wind attack angles.
Figure 265. Comparison chart of torsional vortex-induced-vibration amplitudes of the Humen Bridge stiffening girder at different wind attack angles.9.4 Huangmaohai Bridge vortex-induced-vibration suppression technology
9.4.1 Project overview
9.4.1.1 Project background
The Huangmaohai Cross-sea Channel project starts in Pingsha Town, Gaolan Port Economic Zone, Zhuhai City, connects to the Hezhou–Gaolan Port Expressway, and joins the Gaolan Port Expressway. It spans the Huangmaohai waters to the west and lands in Chixi Town, Taishan City, Jiangmen, ending at the junction with the Western Coastal Expressway and the Xintai Expressway, with a total route length of about 30 km. The cross-sea section of the Huangmaohai Cross-sea Channel is designed with two main bridges crossing three shipping lanes. Among them, the Huangmaohai Bridge is a three-tower cable-stayed bridge with a main span of 2 × 720 m.
The Huangmaohai Bridge adopts a three-tower cable-stayed bridge with a bridge length of 2200 m. The bridge span layout is (100 + 280 + 720 + 720 + 280 + 100) m, with a side-to-span ratio of 0.53 and a height-to-span ratio of 0.25. To enhance the structural flutter stability, the main beam uses a split steel box girder with a height of 4 m. The bridge layout and the main beam profile are shown in Fig. 266.
![]() Figure 266. Schematic diagram of the Huangmaohai Bridge. (a) Span layout (unit: m). (b) Photo of span. (c) Main beam cross-section (unit: mm).
Figure 266. Schematic diagram of the Huangmaohai Bridge. (a) Span layout (unit: m). (b) Photo of span. (c) Main beam cross-section (unit: mm).9.4.1.2 Design wind param
The design basic wind speed at the bridge deck is Vs10 = 46 m/s.
9.4.2 Main beam sectional model vibration measurement experiment
9.4.2.1 Spring-suspended sectional model experiment
Based on the wind environment and cross-sectional form of the Huangmaohai Bridge, the Chang'an University Wind Tunnel Laboratory proposed two types of bottom beams: zigzag bottom beam and curved bottom beam. As shown in Fig. 267. And designed models for wind tunnel tests. The vortex vibration test of the sectional model (Chang'an University Wind Tunnel Laboratory, 2020b) was carried out in the CA-01 wind tunnel of Chang'an University. The geometric scale ratio of both models is 1:70, and the stiffened beams are made of aviation wood. Fences, maintenance tracks and other ancillary facilities are made of plastic plates, which are carved according to the drawing size. They are suspended on the bracket by 8 tension springs, forming a two-degree-of-freedom vibration system that can move vertically and rotate around the model axis. The model is equipped with end plates at both ends to simulate the two-dimensional flow in the wind tunnel test. The test bracket is placed outside the tunnel wall to avoid disturbing the flow field. The spring-suspended two-dimensional rigid sectional model wind tunnel test requires the model to be geometrically similar to the actual bridge. The dynamic sectional model installed in the wind tunnel is shown in Fig. 268.
![]() Figure 267. Two types of linear beam bottom cross-sectional diagrams (unit: mm). (a) Curved bottom beam cross-section. (b) Zigzag bottom beam cross-section.
Figure 267. Two types of linear beam bottom cross-sectional diagrams (unit: mm). (a) Curved bottom beam cross-section. (b) Zigzag bottom beam cross-section.The vortex-induced-vibration test is designed based on the dynamic characteristics of the first-order vertical bending mode and the first-order torsional mode, conducted in a uniform flow field. The design parameter of the main beam model's dynamic system are detailed in Tables 32 and 33.
Table 32. Curved bottom beam model parameter.Parameter Symbol Unit Scale Actual bridge Model measured value Girder height H m 1/70 4.01 0.058 Girder width B m 1/70 50 0.722 Equivalent mass m kg/m 1/702 7.560 Equivalent mass moment of inertia Jm kg⋅m2/m 1/704 8.49 × 10⁶ 0.548 Vertical bending frequency fv Hz – 0.1432 3.711 Torsional frequency ft Hz – 0.6295 9.570 Table 33. Zigzag bottom beam model experimental parameter.Parameter Symbol Unit Scale Actual bridge Model measured value Girder height H m 1/70 3.90 0.0560 Girder width B m 1/70 49.057 0.7000 Equivalent mass m kg/m 1/702 3.70 × 10⁴ 7.2680 Equivalent mass moment of inertia Jm kg⋅m2/m 1/704 8.49 × 10⁶ 0.5678 Vertical bending frequency fv Hz – 0.1432 3.7840 Torsional frequency ft Hz – 0.6295 9.3990 9.4.2.2 Curved bottom beam original cross-section vortex-induced-vibration performance and damping measures
The curved bottom beam cross-section, under the conditions of a vertical bending damping ratio of 2.50‰, a torsional damping ratio of 0.84‰, and attack angles of 0°, +3°, and −3°, did not exceed the limit for vertical bending amplitudes, but had relatively large peak values, approaching the limit. The torsional amplitudes, however, exceeded the limit and had large peak values. The peak values of vertical bending amplitudes occurred at a lower wind speed range, and it was difficult to maintain such low wind speeds during the test, hence the actual bridge's wind speed at which vibration starts might be slightly different. The results are shown in Fig. 269. The applied measures applied and the experimental results are shown in Table 34.
![]() Figure 269. Curved bottom beam original cross-section (Fig. 267(a)) vortex-induced-vibration test results. (a) Vertical displacement (with the limit of 279 mm). (b) Torsion (with the limit of 0.145°).Table 34. Test numbers and corresponding damping effects.
Figure 269. Curved bottom beam original cross-section (Fig. 267(a)) vortex-induced-vibration test results. (a) Vertical displacement (with the limit of 279 mm). (b) Torsion (with the limit of 0.145°).Table 34. Test numbers and corresponding damping effects.Scheme number and description Angle of attack (°) Vortex-induced-vibration range (m/s) Maximum amplitude value Whether it meets the specification requirements Vertical (mm) Torsion (°) Vertical (mm) Torsion (°) 1. Maintenance vehicle track guide vane 
0 2.71–6.26 13.26–14.91 352.330 0.200 Not 2. Maintenance vehicle track guide vane + full enclosure of maintenance path railings + full enclosure of inner railings 
0 4.05–6.76 12.96–17.86 369.410 0.090 Not 3. Maintenance vehicle track guide vane + full enclosure of maintenance path railings + full enclosure of inner railings + bridge deck cover 
0 – 14.11–18.55 – 0.210 Not 4. Maintenance vehicle track guide vane + full enclosure of maintenance path railings + full enclosure of inner railings + vortex shedding plate 
0 3.52–6.22 – 387.840 – Not 5. Maintenance vehicle track guide vane + full enclosure of maintenance path railings + full enclosure of inner railings + vortex shedding plate + bridge deck cover 
0 4.56–6.75 14.05–16.71 134.290 0.190 Not 6. Maintenance vehicle track guide vane + full enclosure of maintenance path railings + full enclosure of inner railings + single-sided vortex shedding plate + bridge deck cover 
0 4.59–5.94 13.36–16.64 187.990 0.180 Not 7. Maintenance vehicle track guide vane + full enclosure of maintenance path railings + full enclosure of inner railings + upper central stabilizing plate 
0 4.05–6.78 – 418.830 – Not 8. Maintenance vehicle track guide vane + full enclosure of maintenance path railings + full enclosure of inner railings + bridge deck cover + upper central stabilizing plate 
3 – 11.84–17.85 – 0.160 Not 0 – 10.28–11.98 – 0.100 Yes 9. Maintenance vehicle track guide vane + full enclosure of inner railings + bridge deck cover + central stabilizing plate 
3 – – – – Yes 0 – – – – Yes −3 – – – – Yes 10. Maintenance vehicle track guide vane + bridge deck cover + central stabilizing plate 
0 4.6–6.79 21.47–28.98 250.650 0.970 Not 11. Maintenance vehicle track guide vane + horizontal guide vane 
3 – 21.49–27.51 – 0.310 Not 0 2.18–2.78 – 119.800 – Yes 12. Maintenance vehicle track guide vane + horizontal guide vane + vortex shedding plate 
3 – 22.94–26.31 – 0.036 Yes 0 – – – – Yes −3 – – – – Yes 13. Maintenance vehicle track guide vane + vortex shedding plate 
3 2.71–6.03 12.62–15.55 177.380 0.160 Not 0 – 11.89–15.6 – 0.070 Yes −3 2.75–5.18 12.25–16.65 85.690 0.010 Yes 14. Maintenance vehicle track guide vane + bottom beam guide vane 
0 2.71–4.60 20.04–27.88 278.440 0.280 Not 15. Maintenance vehicle track guide vane + vortex shedding plate + bottom beam guide vane 
0 4.07–6.03 21.47–29.67 90.260 0.840 Not 16. Maintenance vehicle track guide vane + bottom beam guide vane 
0 2.71–4.57 19.59–27.06 158.860 0.580 Not 17. Maintenance vehicle track guide vane + full enclosure of inner railings 
0 0.78–1.03 15.14–24.05 72.990 1.030 Not 18. Maintenance vehicle track guide vane + full enclosure of inner railings + double lower central stabilizing plates 
0 2.68–4.40 19.68–27.06 17.490 0.560 Not 19. Maintenance vehicle track guide vane +2.8 m spaced 2.1 m double lower central stabilizing plates 
3 – 19.31–25.18 – 0.020 Yes 0 2.18–2.71 2.90–3.78 54.340 0.030 Yes −3 – – – – Yes 20. Maintenance vehicle track guide vane + double lower central stabilizing plates 
0 2.7–6.21 23.31–29.6 258.300 0.320 Not 21. Maintenance vehicle track guide vane +2.8 m spaced 0.7 m double lower central stabilizing plates 
3 2.7–4.86 20.72–26.64 247.450 0.608 Not 0 2.7–5.13 11.47–15.17 192.700 0.015 Yes 22. Maintenance vehicle track guide vane +2.8 m spaced 1.4 m double lower central stabilizing plates 
3 2.7–4.86 19.24–25.53 18.880 0.012 Yes 0 – – – – Yes −3 – – – – Yes 23. Maintenance vehicle track guide vane +11 m spaced 1.4 m double lower central stabilizing plates 
3 2.16–4.86 16.28–23.31 123.750 0.036 Yes 0 2.16–4.32 18.5–25.9 21.670 0.032 Yes −3 – 22.94–27.75 – 0.012 Yes Based on the experimental results, two recommended schemes can be proposed to increase the damping measures for the Huangmaohai Bridge. Test number 22 is the recommended Scheme 1, with specific measures being: on the basis of the original cross-section, two 1.4 m lower central stabilizing plates are added to the bottom of the beam (with a center-to-center distance of 2.8 m). As shown in Fig. 270. The test results for this scheme are shown in Fig. 271.
![]() Figure 271. Recommended Scheme 1 experimental results. (a) Vertical bending damping ratio 2.50‰ (with a limit of 279 mm). (b)Torsional damping ratio 0.84‰ (with a limit of 0.145°).
Figure 271. Recommended Scheme 1 experimental results. (a) Vertical bending damping ratio 2.50‰ (with a limit of 279 mm). (b)Torsional damping ratio 0.84‰ (with a limit of 0.145°).Test number 19 is the recommended Scheme 2, with specific measures being: on the basis of the original cross-section, two 2.1 m lower central stabilizing plates are added to the bottom of the beam (with a center-to-center distance of 2.8 m) (Fig. 272). The test results for this scheme are shown in Fig. 273.
![]() Figure 273. Recommended Scheme 2 experimental results. (a) Vertical bending damping ratio 2.50‰ (with a limit of 279 mm). (b) Torsional damping ratio 0.84‰ (with a limit of 0.145°).
Figure 273. Recommended Scheme 2 experimental results. (a) Vertical bending damping ratio 2.50‰ (with a limit of 279 mm). (b) Torsional damping ratio 0.84‰ (with a limit of 0.145°).9.4.2.3 Zigzag bottom beam original cross-section vortex-induced-vibration performance and damping measures
Under the conditions of a vertical bending damping ratio of 2.62‰ and a torsional damping ratio of 2.68‰ at an attack angle of 0°, both vertical bending and torsional amplitudes exceed the limit. The vertical bending amplitude exceeds the limit at a lower wind speed range, and it is difficult to maintain such low wind speeds during the test, so the actual bridge's wind speed at which vibration starts may be slightly different. The results are shown in Fig. 274. The applied measures applied and the experimental results are shown in Table 35.
![]() Figure 274. Vortex-induced-vibration test results for the original design scheme of the zigzag bottom beam (as depicted in Fig. 267(b)). (a) Vertical displacement (with the limit of 279 mm). (b) Torsion (with the limit of 0.145°).Table 35. Test numbers and corresponding damping effects.
Figure 274. Vortex-induced-vibration test results for the original design scheme of the zigzag bottom beam (as depicted in Fig. 267(b)). (a) Vertical displacement (with the limit of 279 mm). (b) Torsion (with the limit of 0.145°).Table 35. Test numbers and corresponding damping effects.Scheme number and description Angle of attack (°) Vortex-induced-vibration range (m/s) Maximum amplitude value Whether it meets the specification requirements Vertical (mm) Torsion (°) Vertical (mm) Torsion (°) 2 m internal girder height + double lower central stabilizing plates + maintenance vehicle track guide vane + inverted L-shaped guide vane 
0 – 22.44–26.17 – 0.010 Yes 3 – 23.82–26.17 – 0.021 Yes −3 – – – – Yes 2 m internal girder height + double lower central stabilizing plates + inverted L-shaped guide vane 
0 – 12.96–17.86 – 0.090 Yes 3 – 22.13–26.30 – 0.017 Yes −3 – – – – Yes 1 m internal girder height + double lower central stabilizing plates + maintenance vehicle track guide vane + inverted L-shaped guide vane 
0 – 22.52–24.61 – 0.015 Yes 3 – 12.26–16.94 – 0.150 Not −3 – – – – Yes 1.5 m internal girder height + double lower central stabilizing plates + maintenance vehicle track guide vane + inverted L-shaped guide vane 
0 – 22.91–25.27 – 0.012 Yes 3 – 13.37–17.15 – 0.031 Yes −3 – – – – Yes 1.5 m internal girder height + maintenance vehicle track guide vane + inverted L-shaped guide vane 
0 – 11.28–14.16 22.11–28.98 – 0.497 Not Based on the experimental results, two recommended schemes are proposed. Test number 1 is the recommended Scheme 1, with specific measures being: an internal girder height of 2 m, replacement of the wind fairing with an inverted L type horizontal guide vane, relocation of the maintenance vehicle track, addition of a maintenance track guide vane, and the installation of double lower central stabilizing plates. As shown in Fig. 275. The experimental results for this scheme are shown in Fig. 276.
![]() Figure 276. Recommended Scheme 1 test results. (a) Vertical bending damping ratio 1.90‰ (with the limit of 279 mm). (b) Torsional damping ratio 1.40‰ (with the limit of 0.145°).
Figure 276. Recommended Scheme 1 test results. (a) Vertical bending damping ratio 1.90‰ (with the limit of 279 mm). (b) Torsional damping ratio 1.40‰ (with the limit of 0.145°).Test number 2 is the recommended Scheme 2, with specific measures being: an internal girder height of 2 m, replacement of the wind fairing with an inverted "L" type horizontal guide vane, relocation of the maintenance vehicle track, no maintenance track guide vane, and the installation of double lower central stabilizing plates. As shown in Fig. 277. The experimental results for this scheme are depicted in Fig. 278.
![]() Figure 278. Recommended Scheme 2 test results. (a) Vertical bending damping ratio 1.90‰ (with the limit of 279 mm). (b) Torsional damping ratio 1.40‰ (with the limit of 0.145°).
Figure 278. Recommended Scheme 2 test results. (a) Vertical bending damping ratio 1.90‰ (with the limit of 279 mm). (b) Torsional damping ratio 1.40‰ (with the limit of 0.145°).9.4.2.4 Conclusions
Based on the experimental results, adding two vertical boards at the slots of the separated main beams has a significant effect on suppressing vortex-induced-vibrations. Through a series of comparative experiments, four main beam shapes and damping schemes have been identified, all of which meet the requirements of the specifications for damping effects.
9.4.3 Related topics
9.4.3.1 Inverted L-shaped plate feature size damping pattern
Shi (2023) conducted a wind tunnel experimental study on the impact of different size combinations of the horizontal and vertical plates of inverted L-shaped guide vanes on the vortex-induced-vibration performance of the Huangmaohai Bridge. A variety of inverted L-shaped guide vanes with characteristic dimensions were designed for the experiment. The specific characteristic dimension parameter of the inverted L-shaped guide vanes are shown in Table 9.16. The width of the horizontal plate of the inverted L-shaped guide vane is denoted as b, and the height of the vertical plate is h. The width-to-height ratio n = b/h of the inverted L-shaped guide vane is used to normalize the results for better reference and ease of comparison. A total of 21 different characteristic dimension inverted L-shaped guide vanes were designed to study the effect of inverted L-shaped guide vanes on the vortex-induced vibration performance of the separated dual-box beams. Fig. 279 indicates that for vertical bending vortex-induced-vibrations, the size variation of the horizontal plate of the inverted L-shaped guide vane plays a key role. Within a certain ratio range, the peak value of vertical bending vortex-induced-vibrations tends to decrease and then increase with the increase of the aspect ratio. When the aspect ratio exceeds a certain threshold, the peak value of vertical bending vortex-induced-vibrations tends to decrease with the increase of the aspect ratio.
![]() Figure 279. Vortex-induced-vibration under different vertical plate heights. (a) Vertical amplitude. (b) Torsion.
Figure 279. Vortex-induced-vibration under different vertical plate heights. (a) Vertical amplitude. (b) Torsion.Fig. 280 indicates that for torsional vortex-induced-vibrations, there is a clear and discernible pattern in the changes of the vertical or horizontal plate sizes. The peak values of torsional vortex-induced-vibrations tend to decrease as the size of the vertical or horizontal plates increases. Changes in the vertical plate size not only improve the peak values of torsional vortex-induced-vibrations but also alter the number of wind speed lock-in ranges, playing a more significant role in the improvement of torsional vortex-induced-vibrations.
![]() Figure 280. Vortex-induced-vibration under different vertical plate heights. (a) Vertical amplitude. (b) Torsion.
Figure 280. Vortex-induced-vibration under different vertical plate heights. (a) Vertical amplitude. (b) Torsion.9.4.3.2 Mass damping parameter influence on vortex-induced-vibration pattern
Damping and mass are crucial parameter that affect the onset wind speed and amplitude of vortex-induced-vibrations. It is generally believed that an increase in mass and damping parameter will reduce the amplitude of vortex-induced-vibrations: with a constant vortex excitation force, the more work done to overcome the mass and damping, the smaller the amplitude of the vortex-induced-vibrations will be. However, experimental studies on the Huangmaohai Bridge have yielded different findings.
Zhu (2021) conducted a wind tunnel test on the sectional model to study the impact of mass ratio (here, the mass ratio is the ratio of the model mass to the fluid mass for the same volume) and damping parameter on the vortex-induced-vibration performance of the Huangmaohai Bridge. The study found that the Huangmaohai section is more sensitive to changes in damping parameter, while changes in the mass ratio have a smaller impact. It can be seen from Figs. 281 and 282 that as the damping ratio increases, the amplitude of vertical bending vortex-induced-vibrations gradually decreases, and the vortex-induced-vibration lock-in range shifts to the right relatively, with the second lock-in range of torsional vortex-induced-vibrations even disappearing directly; whereas changes in the mass ratio result in little change in the amplitude and lock-in range of torsional vortex-induced-vibrations.
![]() Figure 281. Amplitude-wind speed curve under different damping ratios. (a) Vertical reduced amplitude. (b)Torsional degree.
Figure 281. Amplitude-wind speed curve under different damping ratios. (a) Vertical reduced amplitude. (b)Torsional degree.9.4.3.3 Vortex shedding plate influence pattern
Liu (2023a) investigated the impact of vortex shedding plates on the vortex-induced-vibration performance of the Huangmao Sea Bridge. By comparing the vibration test results of the initial cross-section of the main beam sectional model with those of the cross-section with a vortex shedding plate permeability of 0, it was found that the initial cross-section had poor vortex-induced-vibration performance, while a fully enclosed central slot could effectively suppress vortex-induced-vibrations. Furthermore, by changing the permeability and hole pattern of the vortex shedding plate and conducting synchronous vibration and pressure measurements, the results showed as belows.
- The lower the permeability of the vortex shedding plate, the better the suppression effect on vertical bending vortex-induced-vibrations.
- Changes in the hole pattern have a significant impact on the vertical bending and torsional vortex-induced-vibrations of the separated dual-box beams.
- Under the same permeability, the suppression effects on vertical bending vortex-induced-vibrations of the three types of vortex shedding plate arrangements (large hole diameter multi-hole plate, small hole diameter multi-hole plate, and strip grating) are different, with the strip grating having the largest amplitude and the large hole diameter multi-hole plate having the smallest amplitude.
- For torsional vortex-induced-vibrations, the large hole diameter multi-hole plate has the best suppression effect; when the permeability exceeds 9.36%, the small hole diameter multi-hole plate and strip grating may exacerbate torsional vortex-induced-vibrations.
9.4.3.4 The influence pattern of the lower central stabilizing plate
Xiao (2022) focused on the cross-section with a slotting rate of 24.4% as the main subject of study, exploring the influence pattern of the height and spacing of the double lower central stabilizing plates on the vortex-induced-vibration performance of the Huangmao Sea Bridge. To normalize the data, the model width is defined as B, the model height as H, the height of the double lower central stabilizing plates as wh, and the spacing as wb; CB is the gap width of the twin-box girder.
Fig. 283 indicates that the double lower central stabilizing plates have an impact on the vortex-induced-vibration performance of the main beam cross-section, but the pattern is not distinct. For vertical bending vortex-induced-vibrations, no obvious vertical bending vortex-induced-vibrations occurred after the addition of the double lower central stabilizing plates, which can effectively suppress vertical bending vortex-induced-vibrations.
![]() Figure 283. Model amplitude-wind speed curve of double lower central stabilizing plates at different spacings. (a) Torsional degree, wh = 0.7 m. (b) Vertical reduced amplitude, wh = 0.7 m. (c) Torsional degree, wh = 0.7 m. (d) Vertical reduced amplitude, wh = 1.4 m. (e) Torsional degree, wh = 2.1 m. (f) Vertical reduced amplitude, wh = 2.1 m.
Figure 283. Model amplitude-wind speed curve of double lower central stabilizing plates at different spacings. (a) Torsional degree, wh = 0.7 m. (b) Vertical reduced amplitude, wh = 0.7 m. (c) Torsional degree, wh = 0.7 m. (d) Vertical reduced amplitude, wh = 1.4 m. (e) Torsional degree, wh = 2.1 m. (f) Vertical reduced amplitude, wh = 2.1 m.9.5 Shen Zhong Bridge flutter performance enhancement
9.5.1 Project overview
9.5.1.1 Project background
The Shen Zhong Bridge is a double-gate tower parallel cable plane steel box girder suspension bridge, an important link connecting Shenzhen City and Zhongshan City in Guangdong Province. The span combination is (500 + 1666 + 500) m, the main beam width is 49.7 m, and the bridge deck is 91 m high. The project is located about 30 km north of the Humen Bridge and about 38 km south of the Hong Kong–Zhuhai–Macao Bridge, in the central position of the Pearl River Delta West Bank. Fig. 284 is the rendering of the completed Shen Zhong Bridge, Fig. 285 is the elevation layout of the bridge, and Fig. 289 is the cross-sectional view of the main beam (See Fig. 286).
![]() Figure 287. Typical mode shape diagram of Shenzhong Bridge. (a) Symmetric vertical bending mode shape diagram. (b) Symmetric torsional mode shape diagram.
Figure 287. Typical mode shape diagram of Shenzhong Bridge. (a) Symmetric vertical bending mode shape diagram. (b) Symmetric torsional mode shape diagram.9.5.1.2 Design wind param
Based on the meteorological observation report at the bridge site and in accordance with the 'Specifications' (JTG/T 3360-01-2018), the design wind parameter for the Shen Zhong Bridge are obtained, as shown in Table 36.
Table 36. Design wind parameter for Shen Zhong Bridge.Design reference wind speed for the main beam (m/s) Flutter test wind speed (m/s) Based on actual measurements from observation stations 46.9 67.0 Statistical results based on typhoon wind speeds from meteorological data 53.6 76.5 Based on the method specified in the code/standard 58.5 83.5 9.5.1.3 Structural dynamic characteristics
The Shenzhen-Zhongshan Bridge employs large-scale general finite element software to conduct dynamic characteristic analyses on both the original proposal and the final recommended optimized scheme. This process provides design frequencies, equivalent masses, and relevant modes for the wind tunnel test models. The main modal dynamic characteristic results are shown in Table 37. Representative mode shape diagrams can be found in Fig. 287.
Table 37. Results of main modal dynamic characteristics.Main modes Original plan Recommended optimized plan Frequency (Hz) Equivalent mass Frequency (Hz) Equivalent mass MY (t/m) JX (t·m2/m) MY (t/m) JX (t·m2/m) First-order symmetric vertical bending 0.1014 42.4 – 0.1001 46.4 – First-order anti-symmetric vertical bending 0.1006 67.7 – 0.1009 73.1 – First-order symmetric torsion 0.2197 – 9915.4 0.2177 – 10622.0 First-order anti-symmetric torsion 0.2182 – 10903.0 0.2229 – 11525.9 9.5.2 The flutter characteristics of bridges and their enhancement schemes
9.5.2.1 Segmental model vibration measurement wind tunnel test
The vibration measurement experiment of the segmental model of the Shenzhong Bridge (CUWTL, 2017) was conducted in the CA-01 atmospheric boundary layer wind tunnel of the Chang'an University Wind Tunnel Laboratory. The model had a scale ratio of 1:75, with a model length of 2 m and a width of 0.663 m, resulting in a length-to-width ratio of approximately 1:3. Fig. 288 shows the segmental model for vibration measurement mounted on a support in the wind tunnel. Table 38 presents the design parameter of the segmental model for the vibration measurement experiment.
Table 38. Design parameter of the original scheme vibration measurement segmental model for the test.Parameter name Unit Actual bridge value Scale ratio Design value Experimental value Equivalent mass (m) kg/m 42411 1/75 15.080 15.080 Equivalent mass moment of inertia (Jm) kg·m2/m 9,838,000 1/752 0.311 – Vertical bending fundamental frequency (fv) Hz 0.1 75/6 1.250 1.221 Torsional fundamental frequency (ft) Hz 0.2228 75/6 2.785 2.810 Vertical bending damping ratio (ζv) – – – – 5.0‰ Torsional damping ratio (ζt) – – – – 2.2‰ This experiment utilized an internal support-type spring-suspended dual rigid sectional model test method. The test internal support device features a mechanism to change the relative angle of attack between the model and the incoming flow, as well as a constraint mechanism for the model's motion state. Table 39 and Fig. 289 display the main aerodynamic optimization measures adopted. The results of the original scheme test and the results after aerodynamic optimization measures are shown in Table 40.
Table 39. Aerodynamic optimization measures table.Aerodynamic measures Item number Upper central stabilizer plates of 1.2, 1.4, and 1.6 m A, B, C Lower central stabilizer plate of 1.125 m D Horizontal guide vane extended by 0.75 m E Pedestrian railings sealed every two steps, fully enclosed F, G Pedestrian railings moved to the edge H Removal of pedestrian railings (ventilation rate of 100%) I Two lower quarter-point stabilizer plates (1.2 m) J Border anti-collision guardrails sealed every two steps, fully enclosed K, L Maintenance car track moved to the quarter points M Maintenance car track with openings N Maintenance car track heights of 0.7 and 0.43 m O, P Width of the pedestrian walkway of 0, 1, and 1.8 m Q, R, S Bottom plate thickened to 14 mm T Table 40. Experimental results of the original scheme and the results after aerodynamic optimization measures.Specific aerodynamic measures Test wind attack angle Flutter critical wind speed (m/s) Original scheme +3° 87.1 0° 76.7 −3° – Installation of upper central stabilizer platess A +3° 84.1 0° – −3° 76.7 Installation of lower central stabilizer plates A + D −3° 76.7 Optimization of horizontal guide vanes A + D + E −3° 75.5 A + E −3° 75.5 A + F −3° 77.3 A + E + F −3° 77.3 A + E + G −3° 81.6 Relocation of pedestrian guardrails A + G + H −3° 82.8 A + G + H + J −3° 89.0 0° 84.7 +3° 64.4 A + H + J +3° 74.9 A + H + J + K +3° 75.5 A + H + J + L +3° 82.2 −3° 70.0 A + I +3° 83.4 Adjustment of maintenance vehicle tracks A + M −3° 78.5 +3° 72.1 A + M + G +3° 74.3 A + M + I +3° > 89.2 −3° 82.8 A + M + I + N −3° 80.4 Optimization of pedestrian walkway width A + Q + M −3° 88 +3° 66–72 A + R + M +3° 60–70 A + S + M +3° 60–70 A + I + M + O +3° > 90 Thickening of the pedestrian walkway base plate to achieve a more closed shape A + M + O +3° 80.9 −3° 78.0 A + M + O + T +3° 88.2 −3° 81.5 B + M + O + T +3° > 90 −3° 83.9 C + M + O + T +3° 90.6 −3° 87.5 B + M + O + T +3° 90.6 −3° 84.5 Through the segmental model wind tunnel tests, it was found that the flutter stability of the original design cross-section of the Shenzhong Bridge does not meet the requirements. Various aerodynamic optimization measures were attempted on the original design cross-section. It was discovered that reducing the ventilation rate of the pedestrian guardrail is beneficial for increasing the flutter critical wind speed at negative angles of attack, but not at positive angles; reducing the ventilation rate of the border anti-collision guardrail is beneficial for increasing the flutter critical wind speed at positive angles of attack, but not at negative angles; moving the maintenance vehicle track to the lower quarter points or increasing the track height slightly improves the flutter critical wind speed for both positive and negative angles of attack; increasing the height of the upper central stabilizer plate significantly increases the flutter critical wind speed at all angles of attack, eliminating the soft flutter phenomenon at 0° angle of attack; thickening the base plate and the diagonal web plate increases the critical wind speed of the new model at all angles of attack compared to the old model; the effects of other aerodynamic measures are not significant. During the test, it was also found that the presence of the pedestrian guardrail can cause high wind speed torsional vortex vibration at +3° angle of attack. When the structural damping is low, the torsional vortex vibration may be coupled with the flutter, leading to significant torsion at low wind speeds at positive angles of attack. This phenomenon still requires further testing and research.
Considering all factors, the combination of 1.6 m upper central stabilizer plate +0.7 m maintenance vehicle track (moved to the quarter points), namely the C + M + O + T combination measures in Table 40, showed the best results. No divergent vibrations were observed at all tested angles of attack, up to and beyond the flutter critical wind speed, and the test phenomena of the two schemes were similar, with a slight improvement in the soft flutter stability of the thickening scheme. The verification results are shown in the following Table 41. The cross-sectional shape with the best flutter performance and the upper central stabilizer plate and high ventilation rate railing used are shown in Figs. 290 and 291.
Table 41. Flutter critical wind speed of the final recommended scheme (unit: m/s).Recommended optimization plan +3° +2° +1° 0° −1° −2° −3° C + M + O 94.0 89.5* 85.1* 90.8 89.6 90.8 88.3 C + M + O + T > 91.3 89.1* 85.4* 89.1 89.8 89.8 89.8 Note: * indicates the occurrence of soft flutter phenomenon. ![]() Figure 291. Application of recommended aerodynamic measures on Shenzhong Bridge in the actual bridge. (a) Upper central stabilizer plate. (b) High ventilation rate guardrail.
Figure 291. Application of recommended aerodynamic measures on Shenzhong Bridge in the actual bridge. (a) Upper central stabilizer plate. (b) High ventilation rate guardrail.9.5.2.2 Parallel test results from relevant units
The aerodynamic shape is crucial to the wind resistance performance of a structure, so its wind-induced response should be considered in the early stages of design. Zhao et al. (2019b) compared the sectional models of three preliminary design schemes through wind tunnel tests. Scheme 1, which uses a central-slotted split cross-section, meets the flutter requirements but occupies a large space and has poor economic performance. Scheme 2 has soft flutter issues, and its spatial main cable form is more complex in construction and force. Although Scheme 3 does not meet the flutter critical wind speed, it has the potential to be optimized through aerodynamic measures. Based on these considerations, the structural system of the plane double main cable with an integrated box girder (Scheme 3) was ultimately selected. The basic parameter and test results of the three schemes are detailed in Table 42.
Table 42. Basic parameter and test results of the three schemes.Param Scheme 1 Scheme 2 Scheme 3 Tower type Single-column shape Diamond shape Gate shape Cable configuration Spatial main cable Spatial main cable Parallel main cables Beam cross-section Centrally slotted split steel box girder Integral steel box girder Integral steel box girder Span-to-rise ratio 1/9.8 1/9.83 – Suspension cable spacing (m) 12.8 12.8 12.8 Model prototype 


Wind attack angle (°) −5 > 90 87.60 66.79 −3 > 90 92.20 77.42 0 > 90 92.20 77.92 3 90 78.40–92.20* 82.48 5 > 90 87.60 68.31 Flutter test wind speed (m/s) 83.50 83.50 83.50 On this basis, large-scale sectional model tests and full-bridge aeroelastic model tests were carried out for the 4 m beam height scheme and the 5 m beam height scheme of Scheme 3, respectively, to compare the impact of different beam height schemes and different heights of central stabilizer plates, pedestrian guardrail forms and ventilation rates, and maintenance track schemes on the structure's wind resistance performance. Ultimately, the 4 m beam height, 1.2 m upper central stabilizer plate, 95% ventilation rate pedestrian guardrail, and the maintenance track set at the 1/10 position of the bottom plate of the beam were selected as the comprehensive disaster control measures for the wind resistance performance scheme of the Shenzhong Bridge.
9.5.3 Related thematic research
9.5.3.1 The method for determining the flutter critical wind speed based on pushover analysis
The classical linear bridge flutter theory indicates that once the critical wind speed is reached, the main beam will undergo divergent self-excited vibrations, which may lead to structural damage. However, due to the blunt body characteristics of the bridge cross-section, nonlinear features may appear during the flutter process, potentially resulting in limit cycle vibrations with non-divergent amplitudes, known as soft flutter. Therefore, the classical flutter theory cannot fully describe the nonlinear phenomena after flutter: the self-excited forces after flutter are no longer linear, the vibration modes exceed the "small-amplitude vibration" category, and the magnitude of aerodynamic self-excited forces must also consider the instantaneous additional wind attack angle of the bridge cross-section. Currently, the research on nonlinear vibration theory is still immature, and there is a lack of a clear and effective method for confirming the critical wind speed for soft flutter. Therefore, there is an urgent need to develop a new method that can evaluate the soft flutter stability of long-span bridges.
Gai (2019) used the Pushover analysis method to conduct a pushover analysis of the post-flutter bridge structure and established a new criterion for judging the critical wind speed of soft flutter. Finally, a complete soft flutter Pushover analysis of the Shenzhong Channel was carried out using finite element software. The steps of the bridge soft flutter Pushover analysis are shown in the following Fig. 292. The soft flutter phenomenon in the torsional response is shown in Fig. 293.
![]() Figure 292. Schematic diagram of the pushover analysis procedure for bridge soft flutter.
Figure 292. Schematic diagram of the pushover analysis procedure for bridge soft flutter.![]() Figure 293. Soft flutter phenomenon in the torsional response at (a+1)° angle of attack.
Figure 293. Soft flutter phenomenon in the torsional response at (a+1)° angle of attack.In the Pushover analysis of bridge soft flutter, the Pushover load applied is, in fact, a combination of the static wind load at a given wind speed and the maximum vibration displacement load at that wind speed. It can be considered that the Pushover analysis after bridge flutter includes two pushover analysis processes: the first process is a gradual check of the overall static wind stability of the bridge with the gradual increase of wind speed; the second process is equivalent to a sub-process of the overall analysis, which can be implemented through the load step of nonlinear static analysis, and the ultimate bearing capacity of the bridge under high wind speeds can be judged by the internal force state and possible plastic deformation of key components of the bridge under the flutter form.
From Fig. 294, it can be seen that the torsional angle and lateral displacement of each measurement point have a high degree of conformity with the test results, and the calculated values are slightly larger than the test values; while the vertical displacement calculated value is slightly lower than the test value at lower wind speeds, that is, when the steady-state amplitude is small, and as the wind speed increases, the calculated value of the vertical displacement has exceeded the test value. In addition, the high degree of conformity of lateral displacement in the results of the dual-modal soft flutter Pushover calculation indicates that the main cause of lateral displacement in the actual bridge soft flutter is the static wind effect, the high degree of conformity of the torsional angle indicates that the dominant torsional mode in the actual bridge vibration is basically consistent with the positive symmetric torsional mode used in the calculation, and the large deviation of vertical displacement at low wind speeds indicates that the participating mode of the bridge in soft flutter at low wind speeds is not only the first-order positive symmetric vertical bending selected in the calculation. Preliminary calculation results show that this method, based on the dual-modal coupled flutter theory, has basically restored the vibration behavior of the sectional model on the three-dimensional whole-bridge finite element model, and the effectiveness of this method has been verified by comparing the displacement results of the whole-bridge aeroelastic model test.
![]() Figure 294. Comparison of calculated and experimental displacement values at the midspan cross-section.
Figure 294. Comparison of calculated and experimental displacement values at the midspan cross-section.9.5.3.2 Research on the mechanism of aerodynamic flutter suppression measures based on energy characteristics
Aerodynamic measure optimization is one of the most direct and effective methods to enhance the flutter performance of bridges. In the process of improving the flutter performance of the Shenzhong Channel, a total of 57 different measures and 111 working conditions were attempted, which not only consumed a large amount of resources but also showed a great deal of blindness. Guo (2019) started from the perspective of energy exchange of model vibration, combined with wind tunnel tests and numerical simulations, to conduct macroscopic and microscopic research on the mechanism of aerodynamic flutter suppression measures for the flutter of flat steel box beams. The macroscopic level analyzed the overall energy input characteristics, while the microscopic level studied the regional energy input characteristics. Computational fluid dynamics (CFD) numerical simulation was used to verify the effectiveness and accuracy of the suppression measures, providing a reference for subsequent wind tunnel tests and effectively reducing the blindness of the tests.
Guo (2019) took the central stabilizer plate and horizontal guide vane, two common suppression measures on the flat steel box beam, as the research objects and drew the following main conclusions. The effective mechanism of the central stabilizer plate measure is that after applying a 0.30H/0.40H central stabilizer plate on the original cross-section, the cumulative work of the aerodynamic force after a vibration cycle was significantly reduced. Among them, the aerodynamic force in the upstream area on the upper surface of the model played a role in dissipating energy during the vibration, which is the 'key area' for vibration suppression. In contrast, the ineffectiveness of the horizontal guide vane measure is due to the fact that after applying a 0.056B horizontal guide vane on the original cross-section, the cumulative work of the upper and lower surfaces of the model both changed from the original negative value to a positive value. Both the upper and lower surfaces have energy input, and the vibration is continuously exciting, eventually leading to the occurrence of flutter.
9.6 Flutter performance enhancement of Zhangjinggao Bridge
9.6.1 Project overview
9.6.1.1 Project background
The Zhang-Gao River Crossing consists of the South Navigation Bridge, the North Navigation Bridge, the Causeway Bridge, and the approach bridges. The main span of the South Navigation Bridge is 2300 m, using a two-span suspension form, with a side span of 717 m, and a cable-stayed tower is set up. The bridge span arrangement is (1220 + 2300 + 660) m. The main cable has a span-to-rise ratio of 1:9.2. The main beam adopts a single-box steel box girder cross-section, designed for an eight-lane dual carriageway, with the total bridge width of 49.7 m, and the beam height is 4.5 m, as shown in Figs. 295 and 296.
![]() Figure 296. Cross-sectional diagram of the main beam for the South Navigation Bridge (unit: mm).
Figure 296. Cross-sectional diagram of the main beam for the South Navigation Bridge (unit: mm).9.6.1.2 Design wind param
Table 43 presents the design wind parameter for the South Navigation Bridge.
Table 43. Design wind parameter for Zhangjinggao Bridge.Design basic wind speed (m/s) Flutter test wind speed (m/s) Wind attack angle (±3°, 0°) Wind attack angle (±5°) South navigation bridge as-built condition 47.50 62.80 43.96 9.6.1.3 Basic dynamic properties
Table 44 presents the dynamic property results for the 4.5 m and 5 m beam height schemes of the South Navigation Bridge.
Table 44. Dynamic property results for the as-built condition of the Zhangjinggao Bridge.Mode description Frequency (Hz) Equivalent mass MY (t/m) JX (t·m2/m) 4.5 m beam height First-order symmetric vertical bending mode 0.083 5.17E+01 – First-order anti-symmetric vertical bending mode 0.089 6.78E+01 – First-order symmetric torsion mode 0.160 – 1.23E+04 First-order anti-symmetric torsion mode 0.168 – 1.29E+04 5 m beam height First-order symmetric vertical bending mode 0.084 5.21E+01 – First-order anti-symmetric vertical bending mode 0.089 6.74E+01 – First-order symmetric torsion mode 0.158 – 1.28E+04 First-order anti-symmetric torsion mode 0.169 – 1.35E+04 9.6.2 The flutter characteristics of bridges and their enhancement strategies
9.6.2.1 Flutter characteristics and enhancement strategies of the South Navigation Bridge
According to the cross-sectional dimensions of the Zhangjinggao River Crossing South Navigation Bridge, the wind tunnel test section size, and the requirements of the direct test method, a scale ratio of 1:50 was chosen for the sectional model, with the model being 2 m long and 0.95 m wide (excluding the guide vane), and the length-to-width ratio is 2.1:1 (CUWTL, 2021). Fig. 300 shows the vibration measurement sectional model of the South Navigation Bridge in the as-built condition (See Fig. 297).
![]() Figure 298. Schematic diagram of main aerodynamic measures. (a) Dimension of the measure (unit: mm). (b) Illustration of the measures.
Figure 298. Schematic diagram of main aerodynamic measures. (a) Dimension of the measure (unit: mm). (b) Illustration of the measures.![]() Figure 299. Final optimization plan measures and final cross-section schematic diagram (unit: mm).
Figure 299. Final optimization plan measures and final cross-section schematic diagram (unit: mm).![]() Figure 300. Schematic diagram of the original cross-section state of the completed bridge (upper) and the state with added measures (lower) (unit: mm).
Figure 300. Schematic diagram of the original cross-section state of the completed bridge (upper) and the state with added measures (lower) (unit: mm).In this experiment, the simulation of elastic parameter modeled the first-order vertical bending for the as-built state, and for the model posture at different angles of attack, the measured vertical bending damping ratio fluctuated slightly within a certain range. Table 45 presents the design parameter of the flutter test sectional model. The critical wind speeds for flutter at various angles of attack for the original cross-section are shown in Table 46.
Table 45. Design parameter of the flutter test sectional model.Condition Parameter Symbol Unit Actual bridge value Scale ratio Design value Experimental value Error (%) Completed bridge condition Equivalent mass m kg/m 51,830 1/502 20.732 20.761 0.14 Equivalent mass moment of inertia Jm kg⋅m2/m 12,258,100 1/504 1.961 2.021 2.95 Fundamental frequency of vertical bending fb Hz 0.0821 50/4.2 0.977 0.992 0.15 Fundamental frequency of torsion ft Hz 0.1583 50/4.2 1.904 1.907 0.16 Damping ratio of vertical bending ξv – – – 0.3% 0.45%–0.50% – Torsional damping ratio ξt – – – 0.3% 0.24%–0.30% – Table 46. Summary of parallel test results for flutter critical wind speed of the original cross-section.Wind attack angle Actual bridge critical wind speed (m/s) Flutter test wind speed (m/s) Chang'an University Southwest Jiaotong University Tongji University −5° 44.16 – 45.40 43.96 −3° 48.48 45.90 47.60 62.80 0° 55.68 56.80 57.80 62.80 +3° 54.24 53.70 55.00 62.80 +5° 50.40 – 45.40 43.96 The parallel test results from different laboratories match well. Based on the test results, the following conclusion can be drawn. The original cross-section of the main beam in the as-built condition has a flutter critical wind speed that is less than the flutter test wind speed at the three wind attack angles of −3°, 0°, +3°, which does not meet the requirements, while it meets the requirements at the two wind attack angles of −5°, +5°.
For the aerodynamic shape optimization of the original cross-section of the South Navigation Bridge of the Zhangjinggao Bridge, under empirical guidance, 17 combinations of measures were mainly tried, and the flutter critical wind speeds were compared to draw the following conclusions. Comparing cases 1–9, it can be concluded that the effect of the hollowed-out maintenance track is better than the fully enclosed one; the maintenance track at the lower bottom plate six-point position (6.75 m) is more effective than at other positions. Comparing cases 10–13, it can be concluded that changing the ventilation rate of the pedestrian guardrail at intervals has a limited effect on the flutter critical wind speed of the bridge. From the test results of cases 14–17, it can be concluded that after the skirt plate is inclined at 45°, the influence of the lower central stabilizer plate on the flutter critical wind speed is reduced. Based on the above conclusions and test results, case 17 is the best scheme: 0.9 m skirt plate inclined at 45° + 1.5 m upper central stabilizer plate +0.7 m hollowed-out maintenance track moved to the six-point position. The main aerodynamic measures are shown in Fig. 298. The flutter performance enhancement plan and test results for the South Navigation Bridge are shown in Table 47.
Table 47. Flutter performance enhancement plan and test results for the South Navigation Bridge.Test condition Specific aerodynamic measures Wind attack angle Flutter test wind speed (m/s) 1 A(1.6 m) + B(0.9 m) + C(0.8 m) + D(6.75 m) −5° > 52.8 −3° 63.84 0° 63.36 +3° 63.84 +5° > 48 2 A(1.6 m) + B(0.9 m) + C(0.8 m) + D(6.75 m) + E −3° – 0° 66.72 +3° 60.96 3 A(1.35 m) + B(0.9 m) + C(0.8 m) + D(6.75 m) + E −3° 65.52 0° 64.32 +3° 61.96 4 A(1.35 m) + B(0.9 m) + C(0.8 m) + D(6.75 m) +3° 59.52 5 A(1.35 m) + B(0.9 m) + C(0.8 m) + D(4.25 m) + E +3° 59.76 6 A(1.35 m) + B(0.9 m) + C(0.8 m) + D(4.25 m) +3° 56.16 7 A(1.35 m) + B(0.9 m) + C(0.8 m) + D(8.5 m) + E +3° 61.92 8 A(1.35 m) + B(0.9 m) + C(0.8 m) + D(8.5 m) +3° 60.96 9 A(1.35 m) + B(0.9 m) + C(0.8 m) + D(9.56 m) + E +3° 60.72 10 A(1.35 m) + B(0.9 m) + C(0.8 m) + D(6.75 m) + E + G +3° 60.72 11 A(1.35 m) + B(0.9 m) + C(0.8 m) + D(6.75 m) + E + H +3° 61.44 12 A(1.35 m) + B(0.9 m) + C(0.8 m) + D(6.75 m) + E + I +3° 61.92 13 A(1.35 m) + B(0.9 m) + C(0.8 m) + D(6.75 m) + E + J −3° 46.80 +3° 63.60 14 A(1.5 m) + B(0.9 m) + C(0.8 m) + D(6.75 m) + E −3° 63.84 0° 66.00 +3° 61.44 15 A(1.5 m) + B(0.9 m) + C(0.8 m) + D(6.75 m) + E + F −5° 52.08 −3° 64.80 0° 65.76 +3° 65.52 +5° > 50.88 16 A(1.5 m) + B(0.9 m) + C(0.5 m) + D(6.75 m) + E + F −5° > 50.88 −3° 64.56 0° 65.04 +3° 64.80 +5° > 50.88 17 A(1.5 m) + B(0.9 m) + C(0 m) + D(6.75 m) + E + F −5° > 48.96 −3° 64.56 0° 64.80 +3° 63.84 +5° > 48.96 In summary, the final optimization plan is determined. This measure mainly includes a 1.2 m long skirt plate inclined at 45°, a 1.5 m upper central stabilizer plate, a 0.7 m elevated maintenance track, and a 0.8 m lower central stabilizer plate, as shown in Fig. 299. Further flutter and vortex-induced-vibration tests were conducted on this scheme, and it was found that the flutter critical wind speed in all test conditions was greater than the flutter test wind speed. The final optimization plan's flutter test results can be seen in Table 48 (Yang et al., 2023). Moreover, under this aerodynamic scheme, within the wind attack angle range of −5°–5°, no vortex-induced-vibration phenomenon was observed.
Table 48. Final optimization plan flutter test results.Wind attack angle Actual bridge critical wind speed (m/s) Flutter test wind speed (m/s) Chang'an University Southwest Jiaotong University Tongji University +5° > 51.7 46.7 > 51.2 44.0 +3° 64.7 63.1 63.8 62.8 0° 65.5 64.5 63.8 62.8 −3° 65.3 63.1 63.4 62.8 −5° > 50.9 56.9 49.6 44.0 9.6.3 Related research topics
9.6.3.1 Comparison of 4.5 m and 5 m beam heights
The Zhang-Gao River Crossing South Navigation Bridge project is located in the lower reaches of the Yangtze River, spanning the river in the Yangtze River Delta region, where wind speeds are relatively high. The South Navigation Bridge is a typical large-span flexible structure over a kilometer long, and the height-to-width ratio of the main beam cross-section has an important impact on the wind-induced vibration stability of the bridge. The original plan had a beam height of 4.5 m. To ensure the wind resistance of the main navigation bridge, a long-term effective vibration suppression plan is proposed, and a comparison test with a 5 m beam height is now being conducted.
Combined with the aerodynamic shape optimization measures from the previous section, the final recommended measures are added to the original cross-section as a new cross-section for vibration measurement in the wind tunnel test to check its vortex-induced-vibration and flutter performance. Fig. 303 shows a schematic diagram of the original cross-section state and the cross-section state with added measures in the as-built condition.
As shown in Table 49, for the two sets of tests with 4.5 m and 5 m beam heights, the main beam in the original cross-section state of the completed bridge showed that the flutter critical wind speed was less than the flutter test wind speed under the three wind attack angle conditions of −3°, 0°, and +3°. However, after the measures were applied, both reached the flutter test wind speed. In addition, for the ±3° and 0° conditions, the 4.5 m beam height demonstrated superior flutter performance compared to the 5 m beam height, while the opposite conclusion was drawn for the ±5° conditions.
Table 49. Flutter critical wind speeds for bridge cross-sections of the 4.5 m and 5 m schemes.Wind attack angle Actual bridge critical wind speed (m/s) Flutter test wind speed (m/s) Original cross-section state State with added measures 4.5 m beam height 5 m beam height 4.5 m beam height 5 m beam height −5° 44.16 46.55 > 51.70 55.37 44.00 −3° 48.48 46.06 64.70 67.13 62.80 0° 55.68 48.02 65.50 63.70 62.80 + 3° 54.24 52.43 65.30 65.17 62.80 + 5° 50.40 53.90 > 50.90 63.21 44.00 The vortex-induced-vibration test results indicate that neither the original cross-section state nor the state with added measures of the completed bridge experienced vertical bending vortex vibration at wind attack angles of −5°, −3°, 0°, +3°, and +5°. However, as shown in Fig. 301, under the 5 m beam height scheme's state with added measures, torsional vortex vibration occurred at attack angles of −5° and −3°, with a maximum amplitude of 1.34° and a torsional damping of 0.27%. This result is similar to the vortex vibration conclusion for the 4.5 m beam height model. In the 4.5 m beam height model, torsional vortex vibration occurred at the same attack angles of −5° and −3°, with a maximum amplitude of 1.2° when the torsional damping was 0.14%.
![]() Figure 301. Torsional vibration response in the 5 m beam height scheme under state with added measures.
Figure 301. Torsional vibration response in the 5 m beam height scheme under state with added measures.9.6.3.2 The influence pattern of tornado characteristics
Meteorological statistical data indicates that there is a high probability of EF2-level tornadoes occurring in the bridge site area. Considering the extremely large span of the bridge and the high structural importance, a higher level EF3 tornado model was adopted in the design. The basic parameter of this tornado model are shown in Fig. 302, where the maximum transverse average wind speed u generated on the main beam is 73.4 m per second, the most unfavorable path makes an angle β of 20° with the transverse direction of the main beam, and the calculation time for the tornado response is 140 s. The selection of the tornado's moving path is detailed in Fig. 303.
Based on the parameter and the analysis method from Chapter 2 (Hao and Wu, 2020), a bridge response analysis under the influence of tornadoes for the South Navigation Bridge was conducted. The numerical results of the tornado simulation can be seen in Fig. 304. The analysis shows that under different conditions, the midspan of the main beam experienced significant displacement changes in an extremely short period of time. At an attack angle of −3°, the maximum rotational displacement can reach approximately −1.2°; at an attack angle of +3°, the vertical displacement can reach up to about 4.8 m, equivalent to 1/460 of the span length. Although these displacements are large in magnitude, they are short in duration and only occur in the local area near midspan, as shown in Fig. 305.
![]() Figure 305. Bridge response analysis under tornado influence. (a) Time-history response results of torsional displacement at the midspan of the main beam. (b) Time-history response results of vertical displacement at the midspan of the main beam.
Figure 305. Bridge response analysis under tornado influence. (a) Time-history response results of torsional displacement at the midspan of the main beam. (b) Time-history response results of vertical displacement at the midspan of the main beam.Despite the maximum wind speed of the tornado far exceeding the flutter critical wind speed, no flutter instability phenomena were observed in the analysis. Therefore, it is recommended that the bridge be closed in time during tornado disaster warnings to avoid potential traffic safety issues and social impact.
9.6.3.3 Research on the vibration of ultra-long suspension cables
Due to the main span of the Zhangjinggao Bridge South Navigation Bridge far exceeding the existing suspension bridge spans, and the cable length reaching the world's longest, its wind resistance performance is of great concern. Against this backdrop, Lin et al. (2023), based on CFD numerical simulation, studied the characteristics of low-order and high-order vortex-induced-vibrations of long cables, analyzed the differences in vortex-induced-vibrations between single-strand and double-strand cables, and conducted cable vibration suppression research using vibration damping hammers.
Within the range of common wind speeds, there is a possibility of vortex-induced-vibrations occurring in both low-order and high-order modes of the cables. Lin et al. (2023) selected the fundamental frequency and 20th harmonic of two diameter cables as representatives for vortex-induced-vibration numerical simulation. Among them, the structural parameter of the 120 mm cable adopted the parameter of the first group of cables on the north tower side, with a corresponding fundamental frequency of 0.3370 Hz and a 20th harmonic of 6.739 Hz; the structural parameter of the 84 mm cable selected the sixth group of cables on the north tower side, with a corresponding fundamental frequency of 0.4969 Hz and a 20th harmonic of 9.938 Hz. During the numerical simulation process, the cable damping ratio was taken as 0.2%.
Firstly, nested grid technology was used to numerically simulate the two groups of cables. The results showed that the lock-in range width of the 120 mm diameter cable in the vortex-induced-vibration was slightly larger than that of the 84 mm diameter cable. With the increase of vortex-induced-vibration mode order, although the displacement change is not significant, the acceleration increases significantly.
Secondly, numerical simulation of the fundamental frequency vortex-induced-vibration response was carried out for parallel double cables. It was found that the lock-in range of double cables is similar to that of single cables, with similar displacement amplitudes, but the downstream strand is subject to aerodynamic interference from the upstream strand.
Lastly, the parameter of the vibration damping hammer designed by the optimal damping ratio method can effectively control the vortex-induced-vibration response of long cables. When the mass ratio of the vibration damping hammer is 0.6%, the vortex-induced-vibration reduction rate of the long cable can reach 68.7%. In view of the uncertainty of the vortex-induced-vibration mode order of long cables in actual engineering, it is recommended to adjust the parameter of the vibration damping hammer based on the vibration observation results of the completed bridge. This study provides important reference and reference for the control of vortex-induced-vibrations of long cables in ultra-large span suspension bridges.
9.7 Turbulence vibration suppression methods for Guangxi Longmen Bridge
9.7.1 Project overview
9.7.1.1 Project background
The main bridge of the Longmen Bridge adopts a single-span suspension bridge with a main span of 1098 m and a span-to-rise ratio of 1/10. The horizontal spacing of the main cables at the tower top and anchorage is 33.8 m and 36.2 m, respectively. The main beam span arrangement is (50 + 1098 + 50) m. The main beam is equipped with vertical supports, lateral wind-resistant supports, and longitudinal damping devices at the two transitional piers, and is unconstrained at the cable towers. The schematic diagram of the whole bridge restraint system is shown in Fig. 306. Fig. 307 is the illustration of the Longmen Bridge.
The steel box beam has a full width of 38.6 m, with suspension cables anchored to the ear plates on both sides of the box beam through pin connections. The main cables have a lateral spacing of 33.8 m. The top slab is 33 m wide, the flat bottom slab is 21.3 m wide, and the inclined bottom slab is 5.82 m wide. A maintenance walkway 2.8 m wide is set on the outside of the box beam, which can also serve to optimize the aerodynamic shape of the steel box beam. Inspection vehicle tracks and track wind guide plates are set on both sides of the flat bottom slab. The height of the steel box beam is 3.2 m. The cross-sectional view of the main beam is shown in Fig. 308.
9.7.1.2 Design wind param
As shown in Table 50, based on the wind observation report at the bridge site and the 'Specifications' (JTG/T 3360-01-2018), the design basic wind speed, flutter test wind speed, and vortex-induced-vibration limit amplitude are calculated.
Table 50. Longmen bridge design wind parameter overview.Wind param As-built condition Design basic wind speed (m/s) 50.500 Flutter test wind speed (m/s) Wind attack angle (±3°, 0°) 69.700 Wind attack angle (±5°) 48.800 Vortex-induced-vibration limit amplitude Vertical limit amplitude (mm) 274.000 Torsional limit amplitude (°) 0.391 9.7.1.3 Basic dynamic properties
Based on the structural form, sectional characteristics, and constraints of the bridge, a discrete finite element model is established to analyze the bridge's frequency and mode shapes. The results of the dynamic properties calculation are shown in the following Table 51.
Table 51. Dynamic properties results of Longmen Bridge.Principal modes and frequencies Equivalent mass Mode description Frequency (Hz) MY (t/m) JX (t·m2/m) First-order symmetric vertical bending 0.146 29.9 – First-order anti-symmetric vertical bending 0.148 78.9 – First-order symmetric torsion 0.302 – 5100 First-order anti-symmetric torsion 0.335 – 4490 9.7.2 Flutter performance and its enhancement plan
9.7.2.1 Optimizing the maintenance walkway form
According to the cross-sectional dimensions of the Longmen Bridge, the size of the wind tunnel test section, and the requirements of the direct test method, a reduced scale ratio of 1:60 was selected for the segment vibration measurement model, which is 1.50 m long and 0.55 m wide, with a length-to-width ratio of 2.72:1. Fig. 309 shows the vibration measurement sectional model of the Longmen Bridge. Table 52 and Fig. 310 respectively display the test conditions and scenario schematic diagram. It can be seen that under the original scheme, the flutter wind speed at +3° and +5° attack angles is less than the test wind speed, while the recommended scheme results meet the requirements. In addition, all schemes can meet the vortex-induced-vibration design requirements.
Table 52. Cases in wind tunnel vibration test.Test condition Wind attack angle (°) Horizontal maintenance walkway with 20% ventilation (2800 mm) (original cross-section) 0 Horizontal maintenance walkway with 0% ventilation (L1 = 2800 mm) (GC1) ±3 Inverted L-shaped maintenance walkway (horizontal L1 = 2800 mm, vertical L2 = 715 mm) (GC2) ±5 Inverted L-shaped maintenance walkway (horizontal L1 = 2800 mm, vertical L2 = 600 mm) (GC3) Inverted L-shaped maintenance walkway (horizontal L1 = 2800 mm, vertical L2 = 500 mm) (GC4) ![]() Figure 310. Test scenario schematic diagram. (a) Original plan maintenance walkway. (b) GC1 scenario maintenance walkway. (c) Guide vane schematic diagram (unit: mm).
Figure 310. Test scenario schematic diagram. (a) Original plan maintenance walkway. (b) GC1 scenario maintenance walkway. (c) Guide vane schematic diagram (unit: mm).According to the results in Table 53, it can be observed that after changing the form of the maintenance walkway, the flutter performance of the Longmen Bridge has significantly improved. The ventilation rate of the horizontal maintenance walkway significantly affects the flutter performance of the Longmen Bridge, with the impact on the critical wind speed reaching up to 48%, and its effect at a wind attack angle of +3° is greater than at +5°. The inverted L-shaped maintenance walkway has a more pronounced effect on the flutter performance of the flat steel box girder compared to the horizontal maintenance walkway. An appropriately designed inverted L-shaped maintenance walkway can increase the flutter critical wind speed of the Longmen Bridge by nearly 54%. Additionally, changing the vertical plate dimensions of the inverted L-shaped maintenance walkway will to some extent affect the flutter performance of the Longmen Bridge. Therefore, when using the maintenance walkway to optimize the flutter performance of the Longmen Bridge, attention should be paid to the size and ventilation rate of the walkway.
Table 53. Flutter critical wind speeds for different maintenance walkway forms.Wind attack angle −5° −3° 0° +3° +5° Flutter test wind speed (m/s) 48.8 69.7 69.7 69.7 48.8 Original cross-section – – – 52.65 46.8 GC1 > 78.1 > 78.1 > 78.1 > 78.1 65.6 GC2 > 84.4 > 84.4 > 84.4 > 81.3 > 71.9 GC3 > 81.3 > 84.4 > 84.4 76.9 > 68.8 GC4 > 84.4 > 84.4 > 84.4 80 > 68.8 9.7.2.2 Optimized inverted L-shaped guide vane
This section of the experiment mainly focuses on the comparison of bridge flutter and vortex-induced-vibration performance under different design parameter for a new type of steel box girder cross-section (inverted L-shaped guide vane). The corresponding main beam cross-sectional view can be seen in Fig. 311. Based on this cross-section as the prototype, the study investigates the flutter and vortex-induced-vibration performance under different combinations of guide vane vertical positions (H*), guide vane vertical plate heights (S*), and maintenance track positions (T*). For the combinations of H* and S*, please refer to Table 54, and for the layout of T* (Fig. 312). A total of 24 test conditions were completed for the main beam sectional model vibration wind tunnel test, including three wind attack angles of 3°, 0°, and +3° for the as-built bridge condition. All test conditions were conducted in a uniform flow field. The test content includes determining the flutter critical wind speed, the vortex-induced-vibration lock-in wind speed range, and the maximum amplitude of vortex-induced-vibrations.
Table 54. Combination scenario table for the vertical position and vertical plate height of the guide vane.
![]() Figure 312. Different layout parameter of the maintenance track (unit: mm). (a) T1. (b) T2. (c) T3.
Figure 312. Different layout parameter of the maintenance track (unit: mm). (a) T1. (b) T2. (c) T3.The main beam sectional model vibration test was conducted in the TJ2 wind tunnel at the National Laboratory of Civil Engineering Disaster Prevention of Tongji University, as shown in Fig. 313. The wind tunnel has a height of 2.5 m, a width of 3 m, and a length of 15 m; adjustable wind speed ranges from 1 m/s to 68 m/s. The model is a thin-walled box structure, supported by an iron frame, covered with fiberboard, and details such as bridge railings are finely carved from ABS material. The model's geometric scale ratio is 1:60, with vertical bending frequency at 1.463 Hz, torsional frequency at 3.024 Hz, and damping ratios for vertical bending and torsion at 0.29% and 0.22%, respectively.
The flutter test results are shown in Table 54. It can be observed that the lowest flutter critical wind speed essentially occurs at a +3° angle of attack, and the flutter critical wind speed decreases as the wind attack angle increases. For cross-sections with guide vanes arranged in the middle or upper edge, the flutter critical wind speed increases with the increase of the vertical plate height; for cross-sections with guide vanes arranged at the lower edge, cross-sections with a smaller vertical plate height are more conducive to the improvement of the flutter critical wind speed. The test also found that the maintenance track position has a minor impact on the flutter critical wind speed for different guide vane forms (Table 55).
Table 55. Flutter critical wind speeds for various parameter combinations of the Longmen Bridge.Cross-section form Wind attack angle (°) Flutter critical wind speed (m/s) H1 H1S1 −3 75 0 84 +3 72 H1S2 −3 90 0 90 +3 69 H1S3 −3 90 0 84 +3 63 H2 H2S1 −3 > 90 0 90 +3 69 H2S2 −3 90 0 87 +3 63 (soft flutter) H2S3 −3 > 90 0 84 +3 66 H3 H3S2 −3 90 0 84 +3 69 H3S3 −3 90 0 84 +3 72 The vortex-induced-vibration phenomenon in the test mainly occurred at a +3° wind attack angle, with no obvious vertical bending vortex vibration observed. Moving the maintenance track outward causes an increase in torsional displacement, but after moving 40 mm and 60 mm away from the bottom plate's outer edge, the vortex vibration results are essentially the same, which also indicates that the maintenance track position has a minor impact on the flutter critical wind speed. Here, the vortex vibration results are represented by the maintenance track being 40 mm away from the outer edge (T2), as shown in Table 56. The results show that there is a coupling relationship between the vertical plate height and the guide vane position: for cross-sections with guide vanes arranged in the middle or upper edge, the vortex vibration performance improves with the increase of the vertical plate height; for cross-sections with guide vanes arranged at the lower edge, cross-sections with a smaller vertical plate height are more conducive to the improvement of vortex vibration performance.
Table 56. Main results of vortex-induced-vibration tests.Cross-section form Vortex-induced-vibration wind speed range (m/s) Torsional vortex-induced-vibration amplitude (°) H1 H1S1 10–15 0.24 H1S2 10–15 0.28 H1S3 10–15 0.36 H2 H2S1 10–15 0.25 H2S2 11–15 0.34 H2S3 11–17 0.39 H3 H3S2 10–15 0.38 H3S3 10–15 – Comprehensive evaluation of flutter and vortex vibration performance leads to the final optimized cross-sections being H1S1 and H3S3.
9.7.2.3 Aeroelastic model wind tunnel test verification for the entire bridge
This section verifies the optimized cross-section through the aeroelastic model wind tunnel test of the entire bridge. The test was completed in the CA-03 wind tunnel, as shown in Fig. 314, where both flutter stability and buffeting response tests were conducted in uniform and turbulent flow fields. The test results can be seen in Table 57, demonstrating the bridge's excellent flutter stability performance.
Table 57. Flutter critical wind speed of full bridge wind tunnel test.Wind attack angle Actual bridge flutter critical wind speed (m/s) Flutter test wind speed (m/s) +5° > 65.0 48.8 +3° > 70.2 69.7 0° > 80.0 69.7 −3° > 75.0 69.7 −5° > 65.0 48.8 9.7.3 Related research topics
9.7.3.1 Inverted L-shaped guide vane flutter control mechanism research
Current research on the flutter control mechanism of bridge structures mainly focuses on two aspects: aerodynamic derivative analysis and flow field characteristic analysis. Aerodynamic derivative analysis includes the determination of aerodynamic derivatives, the driving mechanism of flutter, and the identification of flutter patterns. Flow field characteristic analysis, on the other hand, pays attention to the distribution of pressure and velocity, the scale of vortices, and their development patterns. Therefore, Teng (2024), based on the wind tunnel test research of the Longmen Bridge, analyzed the system damping and the trend of changes in aerodynamic parameter of the typical inverted L-shaped guide vane cross-section; using CFD numerical simulation, the changes in flow field characteristics such as velocity streamlines and vortex distribution during the vibration process of the straight web plate cross-section and the inverted L-shaped guide vane cross-section were discussed, and the flutter control mechanism of the inverted L-shaped guide vane was explained based on the Lamb integral item.
Considering that the horizontal plate and vertical plate have a certain synergistic effect on the efficiency of flutter control, the dimensionless characteristic area Ф* of the inverted L-shaped guide vane is used to represent the combined effect of the horizontal and vertical plates. The calculation formula for Ф* is shown in Eq. (31).
(31) In the formula, Ф represents the characteristic area of the inverted L-shaped guide vane (Fig. 315). Фgirder represents the cross-sectional area of the straight web plate girder. The divergence of the model system before and after the addition of the inverted L-shaped guide vane is caused by the aerodynamic damping ratio in the torsional direction. Therefore, focus is placed on the aerodynamic derivatives A1*, A2* that have aerodynamic damping significance, to analyze the impact of the inverted L-shaped guide vane on the aerodynamic derivatives.
![]() Figure 315. Schematic diagram of the characteristic area Ф of the inverted L-shaped guide vane (unit: mm).
Figure 315. Schematic diagram of the characteristic area Ф of the inverted L-shaped guide vane (unit: mm).As shown in Fig. 316, the system parameter analysis indicates that as the characteristic area of the inverted L-shaped guide vane increases, the aerodynamic derivative A2* decreases accordingly, and the rate of decrease becomes larger, directly affecting the ξA term positive aerodynamic damping to show a non-linearly accelerated pattern of change. The ξD term aerodynamic negative damping slowly decreases as the characteristic area increases. The difference in the rate of change between the two leads to an increase in the torsional damping ratio with the increase of the characteristic area. At the same time, within a certain range, the degree of vertical participation is directly proportional to the flutter stability of the bridge. The inverted L-shaped guide vane improves the flutter performance of the bridge by increasing the degree of vertical participation in structural vibration and enhancing the bending-torsion coupling characteristic.
![]() Figure 316. Analysis of the influence of L-shaped guide vanes on flutter parameter. (a) Influence of Ф* on A1*. (b) The influence of Ф* on A2*. (c) Influence of Ф* on the ξA term aerodynamic damping. (d) Influence of Ф* on the ξD term aerodynamic damping. (e) Influence of Ф* on the torsional participation degree. (f) Influence of Ф* on the vertical participation degree.
Figure 316. Analysis of the influence of L-shaped guide vanes on flutter parameter. (a) Influence of Ф* on A1*. (b) The influence of Ф* on A2*. (c) Influence of Ф* on the ξA term aerodynamic damping. (d) Influence of Ф* on the ξD term aerodynamic damping. (e) Influence of Ф* on the torsional participation degree. (f) Influence of Ф* on the vertical participation degree.To further study the changes in the flow field during the motion of the cross-section, the vortex evolution of the cross-section at moments T/8, 3T/8, 5T/8, and 7T/8 of a motion cycle was analyzed. At the same time, the velocity streamline diagrams of different inverted L-plates were compared at the same moment, as shown in Fig. 317. The velocity field analysis indicates that the inverted L-shaped guide vane has changed the surface vortex distribution pattern during the vibration of the box beam, causing it to shift from a severely unbalanced distribution of upstream and downstream vortices to a more uniform distribution. This leads to a reduction in the difference in the area of upstream and downstream vortices, thereby enhancing the flutter performance.
The vortex field analysis indicates that the downstream net vortex area changes more dramatically than the upstream, being the main source of variation in the net vortex area within the control domain. The lift coefficient in this area also undergoes significant fluctuations, with the aerodynamic force changing sharply, playing a dominant role in the aerodynamic forces on the cross-section. As the characteristic area of the inverted L-shaped guide vane increases, the total aerodynamic torque coefficient decreases, and the aerodynamic torque effect during the motion cycle is weakened, enhancing the flutter stability, as shown in Fig. 318.
9.7.3.2 L-shaped wind fairing (inverted L-shaped guide vane) influence on vortex-induced-vibration research
In recent years, several long-span bridges have improved their flutter performance by setting up L-shaped wind fairings but research on the impact of L-shaped wind fairings on the vortex-induced-vibration performance of steel box beams is still insufficient and requires further in-depth exploration. To this end, Luo (2024), based on the steel box beam cross-section of the Longmen Bridge, studied the influence of L-shaped wind fairings on its vortex-induced-vibration characteristics through wind tunnel tests and numerical simulations.
Firstly, in terms of analytical methods, different vortex identification techniques were used to extract the flow characteristics around the rectangular cross-section and were deeply compared. The Ω identification method, which has excellent independence and clear distinction between strong and weak vortices, was selected as the identification method for subsequent bridge cross-section flow field analysis. As can be seen from Fig. 319. The Ω identification can better separate the vortex clusters (such as V1, V2', and V2''), and the vortex shedding phenomenon is obvious; the boundary layer B1 was not identified as a vortex, and no strong vortex appeared at the separation point, making the identification more accurate than the vortex method.
Secondly, based on this steel box beam cross-section, 16 sizes of L-shaped wind fairings were designed, and their vortex-induced-vibration response and surface pressure distribution at a +5° attack angle were obtained through wind tunnel tests. Fig. 320 and Table 58 respectively present the parameter definitions of the L-shaped wind fairings and the test conditions. Here, A and B represent the dimensionless horizontal plate width and vertical plate length, respectively. The vibration measurement tests indicate that there are two torsional intervals and one vertical bending interval, and the changes in the horizontal and vertical plates show a clear unidirectional effect on a single vortex-induced-vibration. To quantify the contribution ratio of the horizontal and vertical plates to the occurrence of a certain vortex-induced-vibration, a contribution factor was defined (Fig. 321).
![]() Figure 321. First torsional vortex-induced-vibration interval amplitude surface and discriminant plane. (a) First torsional vortex-induced-vibration maximum amplitude variation surface. (b) First torsional vortex-induced-vibration interval discriminant plane.Table 58. L-shaped wind fairings test conditions table.
Figure 321. First torsional vortex-induced-vibration interval amplitude surface and discriminant plane. (a) First torsional vortex-induced-vibration maximum amplitude variation surface. (b) First torsional vortex-induced-vibration interval discriminant plane.Table 58. L-shaped wind fairings test conditions table.Horizontal plate A 0.06 0.07 0.08 0.09 Vertical plate B 0.0 GK1 GK5 GK9 GK13 0.1 GK2 GK6 GK10 GK14 0.2 GK3 GK7 GK11 GK15 0.3 GK4 GK8 GK12 GK16 Let the discriminant be
. In the formula, A and B represent the dimensionless width and length of the horizontal and vertical plates, respectively; N is the contribution factor of B to the occurrence of vortex-induced-vibration; k is the correction factor; Δ is the discriminant condition (Δ > 0 indicates the occurrence of vortex-induced-vibration; Δ < 0 indicates no vortex-induced-vibration). As shown in Fig. 324, taking the first torsional vortex-induced-vibration interval as an example, the calculated discriminant formula is in Eq. (32). (32) Similarly, discriminants for the other two vortex-induced-vibration intervals can be obtained, and it is found that the contribution factor ratios of the horizontal plate and vertical plate to the occurrence of the first torsional vortex-induced-vibration, the second torsional vortex-induced-vibration, and the vertical bending vortex-induced-vibration are 4:1, 1:2.6, and −3:1, respectively.
Finally, based on CFD numerical simulation using the Ω identification method to extract vortex structures, it is observed that after the vertical plate is lengthened, high-intensity vortex clusters appear at both ends, and the intensity of the original vortex clusters increases, making it more likely to cause torsion; when the horizontal plate is widened, the vortex shedding upstream will not couple with the vortex shedding of the anti-collision fence, and the formed ribbon-like vortex is more stable, less likely to cause vertical bending.
9.7.3.3 Based on the Kriging surrogate model for the aerodynamic shape optimization of a new type of box girder
Flutter is a significant factor hindering the development of bridges towards ultra-long spans. Passive aerodynamic measures can improve the flutter performance of bridge cross-sections. However, traditional optimization methods for combined aerodynamic measures mainly rely on enumeration and trial, which consume a lot of resources and have low optimization efficiency. Therefore, a method that can quickly find the optimal solution is needed. To this end, a new type of box girder cross-section is taken as the research object, and three design parameter are selected, with the flutter critical wind speed as the optimization goal (Ye, 2024). Within a reasonable parameter range, the aerodynamic shape of the new box girder cross-section is optimized based on the Kriging surrogate model to find the cross-sectional aerodynamic shape with the highest flutter critical wind speed at a 0° attack angle.
The Kriging surrogate model, as a black-box function, establishes an approximate model with the smallest estimated variance through a set of input and output relationships. Compared with other surrogate models, the Kriging surrogate model not only provides predicted values for any point but also gives an error estimate for the predicted values. Aerodynamic shape optimization problems are often highly nonlinear. The Kriging surrogate model is very suitable for solving global aerodynamic shape optimization problems because of its good fitting ability for nonlinear problems and its unique error estimation function.
Firstly, the Latin hypercube test design method is improved, and it is found that the improved Latin hypercube test design method makes the distribution of sample points more uniform, which can converge to the optimal solution more quickly. Secondly, the aerodynamic shape of the new box girder cross-section is optimized within the design space of the three param: the horizontal plate width L of the inverted L-shaped guide vane, the height H of the lower central stabilizer plate, and the maintenance vehicle track position J. The design domain of the design parameter is shown in Fig. 322. The initial samples' flutter critical wind speeds obtained by wind tunnel tests are used as response values to establish the Kriging surrogate model. Then, new sample points are added to update the surrogate model using the parallel point-adding criterion, as shown in Fig. 323. After meeting the optimization termination conditions, the optimal design parameter and the corresponding flutter critical wind speed at a 0° wind attack angle are obtained, and the optimal range of design parameter L, H, and J are analyzed. The maximum flutter critical wind speed in the design domain is finally optimized to 84.6 m/s, and the aerodynamic shape of the flutter performance-optimized cross-section is shown in Fig. 324. The corresponding optimal design parameter are H = 1.72 m (0.430D), L = 3.51 m (0.086B), and J = 4.54 m (0.112B).
![]() Figure 322. Design parameter design domain. (a) Horizontal plate variation range. (b) Maintenance vehicle track and stabilizer plate variation range.
Figure 322. Design parameter design domain. (a) Horizontal plate variation range. (b) Maintenance vehicle track and stabilizer plate variation range.![]() Figure 323. Model sample points and Kriging model updating. (a) Final model sample point distribution. (b) Kriging model updating.
Figure 323. Model sample points and Kriging model updating. (a) Final model sample point distribution. (b) Kriging model updating.![]() Figure 324. Aerodynamic shape of the optimal cross-section. (a) Optimal cross-section 3D illustration. (b) Optimal cross-section design parameter.
Figure 324. Aerodynamic shape of the optimal cross-section. (a) Optimal cross-section 3D illustration. (b) Optimal cross-section design parameter.Finally, the optimal cross-section is verified by wind tunnel tests. Compared with the original cross-section, the flutter critical wind speed of the optimal cross-section is increased by 51%, and it is increased by 13% compared to when the inverted L-shaped guide vane is set alone. Variance analysis is used to explore the extent of the impact of various design parameter and their interactions on flutter performance, among which the horizontal plate width L has the most significant impact on flutter performance.
9.8 Summary and future works
This chapter selects six representative bridge projects as research subjects, mainly using wind tunnel tests as the research method, and improves the stability of the bridge in vortex-induced-vibration or flutter performance by introducing various optimization measures. On this basis, further in-depth discussions of related issues are carried out, and a series of thematic studies have been conducted. A comprehensive analysis of these bridge wind engineering application cases reveals the following issues still exist.
1) Traditional wind engineering research mainly focuses on structural dynamics, with relatively less discussion on fluid dynamics and vortex dynamics. This limitation severely affects the in-depth understanding of structural wind vibration mechanisms, the precise construction of aerodynamic force models, and innovation capabilities in structural aerodynamic shape and flow control technology;
2) With the development of design and construction technology for ultra-long-span bridges, nonlinear issues in bridge wind engineering have become increasingly prominent. In wind tunnel tests, effective simulation methods for nonlinear phenomena are still insufficient;
3) At present, there is still a relative lack of research on the characteristics of special wind fields such as downbursts and tornadoes and their impact on bridge structures. There is an urgent need for further in-depth research to enrich and improve the theory of bridge wind-resistant design;
4) Traditional aerodynamic measure optimization methods mainly rely on trial and computation, which is not only resource-intensive but also has low optimization efficiency.
In recent years, China has actively developed artificial intelligence technology, becoming an important participant in the global field of artificial intelligence. In the field of bridge wind engineering, the application of artificial intelligence technology is mainly reflected in three key aspects: intelligent control of wind-induced vibrations, aerodynamic performance analysis, and wind environment assessment. In the aspect of intelligent control of wind-induced vibrations, artificial intelligence algorithms are used to achieve real-time monitoring and intelligent control of bridge wind-induced vibration responses, effectively reducing the risk of wind-induced vibrations; In the direction of aerodynamic performance analysis, machine learning and deep learning technologies are used to deeply analyze and predict the aerodynamic performance of bridges, optimizing the aerodynamic shape design of bridges; In the aspect of wind environment assessment, artificial intelligence technology is applied to comprehensively assess the wind environment, covering extreme wind environments such as downbursts and tornadoes, analyzing the impact of wind speed, wind direction, and other parameter on bridge structures, providing a scientific basis for bridge design and maintenance. These applications not only greatly improve the safety, wind resistance, and structural robustness of bridge projects but also have far-reaching strategic significance for promoting the implementation of China's 'transportation power' strategy.
Acknowledgments: It is appreciated for the funds supporting of: National Key R & D Program of China (No. 2021YFB2600600); National Natural Science Foundation of China (No. 51978077, 52278478); Shaanxi Province Natural Science Foundation (No. 2023-JC-QN-0597, 2023-JC-QN-0526, 2023-JC-YB-408, 2023-JC-YB-438, 2022JM-198, 2022JQ-507, 2021JLM-47). The authors would also like to acknowledge some PhD candidates, and post-graduate students, who have helped with the data collection, data analysis, literature review, as well as the writing and revising of this paper. Their names are listed in alphabetical order of their last names. Wenkai Du, Guoao Fan, Xiaobin Ji, Jiuliang Li, Kairui Li, Leyan Li, Sicheng Li, Xingyuan Liu, Xiaobing Nie, Zhe Sun, Jing Wei, Zeen Xie, Lu Yu, Bolong Zhao, Shuohan Zhao, Xinyuan Zhao, Minhao Zhou, Tianxiang Zou, Zhuoyi Zou. -
![]()
Figure 1. Francis Herbert Wenham (https://en.wikipedia.org/wiki/Francis_Herbert_Wenham).
![]()
Figure 2. Early wind tunnel concept diagram (file: Windtunnel1-en.svg-Wikimedia Commons) (https://commons.wikimedia.org/wiki/File:Windtunnel1-en.svg).
![]()
Figure 3. Early closed-circuit wind tunnel concept diagram (https://upload.wikimedia.org/wikipedia/commons/c/c3/Windtunnel3-num.svg).
![]()
Figure 4. China's first wind tunnel capable of serving both aeronautical engineering and scientific research (currently exhibited at the National Museum of China).
![]()
Figure 7. Lingdingyang Bridge (https://www.peopleapp.com/column/30045285480-500005480751).
![]()
Figure 8. Changtai Bridge (https://cn.chinadaily.com.cn/a/202403/26/WS66037507a3109f7860dd7109.html).
![]()
Figure 9. Shiziyang Bridge (https://www.polycd.com/Item/5476.aspx).
![]()
Figure 12. Humen Bridge vibration (http://m.news.cctv.com/2020/05/05/ARTIcs2exeit5tpC97p8960X200505.shtml).
![]()
Figure 13. Golden Gate Bridge. (a) Original cross-section. (b) Added bottom support (https://www.goldengate.org/exhibits/resisting-the-twisting/).
![]()
Figure 15. Vortex-induced-vibration of Volgograd bridge (https://www.nettavisen.no/nyheter/broen-som-skremmer-en-hel-verden/s/12-95-2910032).
![]()
Figure 16. Chang'an University's wind tunnel CA-01. (a) Wind tunnel floor plan. (b) Movable section.
![]()
Figure 24. The Lingding Channel Bridge project. (a) Small scale sectional model. (b) Vibration test.
![]()
Figure 25. The Huajiang Gorge Bridge project. (a) Full-bridge aeroelastic model in a uniform flow field. (b) Full-bridge aeroelastic modeling in a class C wind field.
![]()
Figure 27. Hangzhou Bay Bridge project. (a) Sightseeing tower test mode. (b) Test model of platform in the sea. (c) Cluster test.
![]()
Figure 29. Characterization of the terrain on which the wind observation instruments are located.
![]()
Figure 40. Wind profile clustering results. (a) Clustering results (category 2). (b) Clustering results (category 3). (c) Clustering results (category 4). (d) Clustering results (category 5). (e) Clustering results (category 6). (f) Clustering results (category 7).
![]()
Figure 45. Grid turbulence arrangement. (a) Working condition 1. (b) Working condition 2. (c) Working condition 3. (d) Diagram of the grid.
![]()
Figure 47. Wind characteristics along the bridge axis. (a) Wind vectors for 315° approach flow. (b) Wind vectors for 135° approach flow.
![]()
Figure 50. The curves of three component force coefficients vs∙incidence angle with different Reynolds numbers. (a) Lift coefficient curve. (b) Lift torque coefficient curve.
![]()
Figure 51. The curves lateral displacement, vertical displacement and rotation angle vs. wind speed at mid-span section. (a) The curves lateral displacement vs. wind speed at mid-span section. (b) The curves vertical displacement vs. wind speed at mid-span section. (c) The curves rotation angle vs. wind speed at mid-span section.
![]()
Figure 52. Comparison of RMS values of bridge buffeting response. (a) Vertical displacement of the beam. (b) Rotation displacement of the beam. (c) Displacement at the top of bridge tower with wind speed.
![]()
Figure 53. Influence of roughness on Reynolds number effect of three-component force coefficient. (a) Influence of roughness on Re effect of CD. (b) Influence of roughness on Re effect of CL. (c) Influence of roughness on Re effect of CM.
![]()
Figure 54. The effect of the maintenance track and railing on the Reynolds number effect of the drag coefficient at 0° wind attack angle. (a) The effect of the maintenance track on the Reynolds number effect of the drag coefficient at 0° wind attack angle. (b) The effect of railing on the Reynolds number effect of the drag coefficient at 0° wind attack angle.
![]()
Figure 55. Section models of force-measured test with different μ. (a) 0 P/m2. (b) 0.5 P/m2. (c) 1.5 P/m2.
![]()
Figure 56. Aerostatic force coefficients with different μ in body axes. (a) CH. (b) CV. (c) CM.
![]()
Figure 57. Effect of different μ on the buffeting response. (a) Vertical displacement. (b) Lateral displacement. (c) Rotation displacement.
![]()
Figure 58. Commonly used ANNs in the field of wind engineering. (a) RBF neural network. (b) BP neural network.
![]()
Figure 59. A procedure for fast evaluating the flutter stability of streamlined box girders.
![]()
Figure 62. Calculation for equivalent aerostatic load. (a) Longitudinal direction−0°. (b) Longitudinal direction−45°. (c) Longitudinal direction−90°. (d) Transverse direction−0°. (e) Transverse direction−45°. (f) Transverse direction−90°.
![]()
Figure 66. Aerostatic force applied in bridge. (a) The FEA model. (b) Static wind load.
![]()
Figure 67. The 3D FEM of the pedestrian suspension bridge. (a) The whole model. (b) The local model.
![]()
Figure 69. Distribution of torsional displacement of main girder along bridge span. (a) Initial attack angle 0° (48.4 m/s). (b) Initial attack angle 0° (81.5 m/s). (c) Initial wind attack angle +3° (48.4 m/s). (d) Initial wind attack angle +3° (81.5 m/s).
![]()
Figure 70. Time histories and amplitude spectra of the measured aerodynamic force during steady-amplitude stages for different side ratios. (a) Time history for B/D = 2, U* = 3.872. (b) Amplitude spectrum for B/D = 2, U* = 3.872. (c) Time history B/D = 1, U* = 2.518. (d) Amplitude spectrum for B/D = 1, U* = 2.518. (e) Time history B/D = 0.5, U* = 2.386. (f) Amplitude spectrum for B/D = 0.5, U* = 2.386.
![]()
Figure 71. Comparison between wind tunnel test results and quasi-steady theoretical predictions. (a) B/D = 2:1. (b) B/D = 1:1.
![]()
Figure 72. Comparison between calculated and experimental values of soft galloping response of cross-section with aspect ratio B/D = 2. (a) Stable amplitude. (b) Instantaneous amplitude (U* = 2.357).
![]()
Figure 73. Observed transverse aerodynamic instabilities of rectangular cylinders with different side ratios. (a) B/D = 2. (b) B/D = 1. (c) B/D = 0.5.
![]()
Figure 74. Displacement response of the original cross-section at different attack angles.
![]()
Figure 85. Time domain signal of the first-order free decay vibration of the cable without damper installed.
![]()
Figure 86. Time domain signal of the first-order vibration of the cable with damper installed.
![]()
Figure 87. Aerodynamic stiffness (vertical axis) of the system's vertical bending induced motion at different angles of attack for the original truss cross-section. (a) −3° angle of attack. (b) 0° angle of attack. (c) +3° angle of attack.
![]()
Figure 91. Illustration of wing plate single opening amplitude-wind speed curve of wind direction of 40° with different damping ratio.
![]()
Figure 92. Schematic diagram of side traffic barrier and sidewalk handrail optimization countermeasures (unit: mm). (a) Schematic diagram of arc-shaped sealing for the side traffic barrier. (b) Schematic diagram of sidewalk traffic barrier optimization. (c) Schematic diagram of the sealed sidewalk traffic barrier measure.
![]()
Figure 93. Section model of side traffic barrier and sidewalk handrail countermeasures. (a) Arc-shaped sealing for the side barrier. (b) Arc-shaped sealing for sidewalk traffic barrier. (c) Side traffic barrier for the section model of Chongqing Hechuan Bridge. (d) Sidewalk traffic barrier for the section model of Chongqing Hechuan Bridge.
![]()
Figure 94. Schemes of the crash barrier closed (unit: mm). (a) Plan Ⅰ. (b) Plan Ⅱ. (c) Plan Ⅲ.
![]()
Figure 95. Flutter stability of long-span asymmetric suspension bridges under different types of asymmetries. (a) Asymmetrical suspension bridge with unequal height of main cable support. (b) Variation of bending-torsion frequency ratio with support height difference. (c) Variation of flutter critical wind speed with support height difference. (d) Side-span asymmetric suspension bridge. (e) Variation of bending-torsion frequency ratio with side span difference. (f) Variation of flutter critical wind speed with side span difference.
![]()
Figure 96. The influence of the vertical bending and torsion damping ratios on the flutter derivative (0° angle of attack). (a)
. (b) . (c) . (d) . (e) . (f) . (g) . (h) . ![]()
Figure 103. Comparison of the experimental RMS of torsional angle and the calculated results from cross/self-validation cases during stable post-flutter LCO.
![]()
Figure 104. Predominant frequencies and corresponding amplitudes of double-deck section. (a) Upper section. (b) Lower section.
![]()
Figure 105. Flutter derivatives of the ideal thin plate and numerical simulation results. (a)
. (b) . (c) . (d) . (e) .(f) .(g) .(h) . ![]()
Figure 107. Identified results of flutter derivatives of 0.9 times initial conditions.
![]()
Figure 108. Comparison of numerical simulation results and experimental results for main beam flutter derivatives. (a)
. (b) . (c) . (d) . ![]()
Figure 110. Variation of flutter critical wind speed with torsional bending frequency ratio.
![]()
Figure 111. Comparison of flutter derivatives at 0 degrees of attack. (a)
. (b) .(c) .(d) .(e) .(f) .(g) .(h) . ![]()
Figure 112. Changes of aspect ratio of main girder. (a) Main beam section form. (b) Local indication of aspect ratio change.
![]()
Figure 113. POD modes of surface pressure at 90° wind fairing section. (a) Stage 1. (b) Stage 2. (c) Stage 3. (d) Stage 4.
![]()
Figure 114. POD modes of surface pressure at 45° wind fairing section. (a) Stage 1. (b) Stage 2. (c) Stage 3. (d) Stage 4.
![]()
Figure 115. Layouts of upper central stabilizer with different heights. (a) Layout diagram of 1.3 m upper central stabilizer plate. (b) Layout diagram of 1.6 m upper central stabilizer plate.
![]()
Figure 116. Isolating ways for different ventilation rates. (a) Sealing one by one. (b) Seal one every two. (c) Seal one every three.
![]()
Figure 118. Influence of ventilation rate of guardrail of maintaining roadway on critical flutter wind speed.
![]()
Figure 119. Flutter critical wind speed with different grid opening rates and grid arrangement methods. (a) Illustration of opening rates. (b) Schematic diagram of different grating layout flutter critical wind speeds.
![]()
Figure 120. Aerodynamic shape of steel box girder section. (a) V-type wind fairings. (b) Y-type wind fairings. (c) Turbulent vibration wind fairing.
![]()
Figure 121. Flutter stability evaluation with wind resistance measures (unit: m/s). (a) Illustration of the measure. (b) Comparison of test results.
![]()
Figure 122. Illustration of wind tunnel test program. (a) Schematic diagram of the overall layout of a spring-suspended sectional model vibration device. (b) Schematic diagram of the linear eddy current damper.
![]()
Figure 123. Damping ratio change with amplitude before and after the application of the linear eddy current damper. (a) Vertical. (b) Torsional.
![]()
Figure 127. Average pressure distribution on the surface of a fixed model with different angles of attack.
![]()
Figure 128. Relationship between the amplitude of vertical bending vortex-induced-vibration and resonance and wind speed in a small-scale model. (a) Turbulence intensity is around 17%. (b) Turbulence intensity is around 23%.
![]()
Figure 129. Vortex displacement time history and displacement spectrogram. (a) Vortex displacement time history. (b) Vortex displacement spectrogram.
![]()
Figure 130. Pneumatic lift time history and pneumatic lift spectrogram. (a) Pneumatic lift time history. (b) Pneumatic lift spectrogram.
![]()
Figure 133. Vertical bending vortex response of π-type girder with different damping ratios.
![]()
Figure 134. Vertical bend and torsional amplitude-wind speed curves at different Sc numbers. (a) Vertical bending amplitude-wind speed curve. (b) Torsional amplitude-wind speed curve.
![]()
Figure 135. Wind speed displacement curves at different angles of attack. (a) Damping ratio of 0.128%. (b) Damping ratio of 0.583%. (c). Damping ratio of 1.092%.
![]()
Figure 136. Illustration of the vibration amplitude with the reduced wind speed of 70°.
![]()
Figure 137. Comparison of the responses at 0° angle of attack at the same number of Sc. (a) A2/B1. (b) A3/B2/B3.
![]()
Figure 138. Comparison of steady-state amplitude response at 70° angle of attack at the same Sc number. (a) A2/B1. (b) A3/B2/B3.
![]()
Figure 141. Effect of turbulence intensity (left) and turbulence integral scale (right) on vortex vibration.
![]()
Figure 142. Dimensionless steady-state amplitude response under different wind angles of attack under a working condition.
![]()
Figure 143. The influence of the wind fairing on the vortex vibration of the bridge. (a) Vertical vortex. (b) Torsional vortex.
![]()
Figure 144. Torsional vortex locking interval and amplitude of the model under different groove widths. (a) Lock the interval. (b) Maximum torsion angle.
![]()
Figure 145. Diagram of vertical displacement variation of π-shaped bridge section with different railing heights.
![]()
Figure 146. Original section amplitude-wind speed curves of π-shaped beams with different aspect ratios under wind attack angles. (a) Reduced displacement amplitude. (b) Reduced torsion amplitude.
![]()
Figure 147. Vertical bending, torsional vortex response of π-shaped girder with different aspect ratios. (a) Reduced amplitude. (b) Torsional amplitude.
![]()
Figure 148. Effect of shape parameter. (a) Vertical dimensionless eddy amplitude. (b) Wind speed of initiation and reduction. (c) Length of the vertical vortex wind velocity region.
![]()
Figure 149. Illustration of negative wind angle of attack test results. (a) Vertical displacement Ar. (b) Torsion φr.
![]()
Figure 151. Frequency corresponding to the maximum amplitude of the pressure pulsation spectrum. (a) Upper surface. (b) Lower surface.
![]()
Figure 152. Spectral amplitude of each measurement point corresponding to the eddy frequency. (a) Upper surface. (b) Lower surface.
![]()
Figure 156. Wind-induced vibration control measure. (a) Pylon with mounted tank on the beam. (b) Pylon with mounted tank on the column.
![]()
Figure 157. Comparison of the acceleration amplitude before and after applying TLDs. (a) No measure acceleration spectrum. (b) Acceleration spectrum with TLD measures applied.
![]()
Figure 158. Vortex amplitude of the original steel box girder section. (a) Vertical bending vortex result. (b) Torsional results.
![]()
Figure 159. The amplitude of the vortex amplitude of the box girder section after the closed railing. (a) Vertical bending vortex result. (b) Torsional results.
![]()
Figure 160. The application of inverted L deflector in steel box girder and the effect of inverted L deflector on the vertical bending vortex vibration of steel box girder with a height-to-width ratio of 1:6 of various sizes.
![]()
Figure 161. Application of typical pneumatic measures in P-K sections. (a) Inverted L deflector. (b) External anti-collision guardrail is fully enclosed. (c) Horizontal deflector and lower central stabilizer plate.
![]()
Figure 162. Effect of inverted L deflector at different heights under the same horizontal width on the vortex suppression effect of the separation box section. (a) Torsion. (b) Vertical bend.
![]()
Figure 163. Illustration of aerodynamic measures (unit: cm). (a) Wind fairing in π-shaped cross-section. (b) Lower central stabilizer plate in the π-shaped cross-section. (c) Inverted L-shaped deflector in π-shaped cross-section.
![]()
Figure 164. The effect of the inverted L-shaped inverter plate on the vortex vibration. (a) Torsion. (b) Vertical bend.
![]()
Figure 168. Two-axle vehicle dynamic analysis model considering side slip motion (Ma, 2008).
![]()
Figure 169. Impact of wind speed and direction on vehicle lateral displacement. (a) Vehicle lateral displacement under different wind speeds. (b) Vehicle lateral displacement under different wind directions.
![]()
Figure 170. Mesh division of the cross-section. (a) Global mesh. (b) Local mesh. (c) Enlarged mesh around the cross-section.
![]()
Figure 171. Wind profile at different lane positions of a cross-section without wind barriers.
![]()
Figure 173. CFD vehicle aerodynamics study. (a) Computational domain mesh. (b) Local mesh division around the vehicle body.
![]()
Figure 174. Impact of wind barrier wind-blocking rate on the wind profile at each lane position.
![]()
Figure 175. Impact of wind barrier height ratio on the wind profile at each lane position.
![]()
Figure 176. Impact of wind barrier height ratio on the amplitude-wind speed curve of the main beam vertical bending vortex vibration.
![]()
Figure 177. Large-scale sectional model wind tunnel test. (a) No wind barrier section. (b) With wind barrier section. (c) Spring suspension system. (d) Data acquisition device.
![]()
Figure 178. Impact of wind barrier wind-blocking rate on the dimensionless maximum vertical amplitude.
![]()
Figure 179. Impact of wind barrier height ratio on the dimensionless maximum vertical amplitude.
![]()
Figure 181. Wright brothers' wind tunnel (Replica) (https://www.baclcorp.com.cn/show.asp?para=cn_2_7_1744).
![]()
Figure 182. Full-scale wind tunnel (http://www.sciencehuman.com/history/history2011/history201105v.htm).
![]()
Figure 183. Aerodynamic wind tunnel (https://www.zhihu.com/question/24656024/answer/71266154).
![]()
Figure 184. Automotive wind tunnel (https://www.baclcorp.com.cn/show.asp?para=cn_2_7_1744).
![]()
Figure 185. Sectional model and internal support. (a) Schematic diagram. (b) Wind tunnel layout.
![]()
Figure 188. Correlation coefficient plot of aerodynamic forces and vortex-induced forces.
![]()
Figure 190. Sectional models and large-scale models in the laboratory. (a) Sectional model (scale ratio = 1:50). (b) Large-scale model (scale ratio = 1:22).
![]()
Figure 193. Comparison of test results between the lower sectional model and the large-scale model at a −3° angle of attack. (a) Vertical bending results. (b) Torsional results.
![]()
Figure 209. Linear damping device. (a) Schematic diagram. (b) Overall layout schematic diagram of the spring suspended vibration system.
![]()
Figure 210. Linear damping device. (a) Damping adjustment device for the sectional model. (b) Damping adjustment device for the aeroelastic model.
![]()
Figure 212. Terrain models at different width-to-diameter ratios. (a) Width-to-diameter ratio is 0.587. (b) Width-to-diameter ratio is 0.373.
![]()
Figure 217. Icing test setup for stay cables. (a) Test sleeves on foam boards. (b) Gateway frame.
![]()
Figure 218. Icing patterns on stay cables. (a) Discrete icicles. (b) Non-uniform expansion (with ice crystal clusters). (c) Non-uniform expansion (without ice crystal clusters). (d) Axial-flow-like ice blanket.
![]()
Figure 219. Video displacement meter system (Li, 2021). (a) Video collector. (b) Fill light. (c) Data acquisition and processing system.
![]()
Figure 221. Local shape coefficient distribution diagrams for each photovoltaic panel.
![]()
Figure 222. Aeroelastic model of photovoltaic panels in the laboratory. (a) Test model under turbulent flow conditions. (b) Test model under uniform flow conditions.
![]()
Figure 223. Flutter critical wind speed. (a) Flutter critical wind speed of photovoltaic modules at different wind incidence angles. (b) Flutter critical wind speed of photovoltaic modules at different tilt angles.
![]()
Figure 224. Effectiveness of measures in reducing vibrations for flexible photovoltaic modules. (a) The vibration suppression effect of the measures on the vertical displacement response. (b) The vibration suppression effect of the measures on the torsional displacement response.
![]()
Figure 227. Arrangement diagram of vortex generators along the lightning rod. (a) Original low wind pressure vortex generators (total 16 layers). (b) Single-layer low wind pressure vortex generators (total 8 layers).
![]()
Figure 228. Detail diagrams of vortex generators. (a) Original low wind pressure vortex generators (total 16 layers). (b) Single-layer low wind pressure vortex generators (total 8 layers).
![]()
Figure 229. Comparison of acceleration time history curves in the vortex-induced-vibration lock-in region. (a) Without vibration suppression measures. (b) Original low wind pressure vortex generators. (c) Single-layer low wind pressure vortex generators.
![]()
Figure 233. Wind tunnel testing of a rigid body model of high-altitude building clusters.
![]()
Figure 234. Owen probe. (a) Schematic diagram of the Owen probe structure. (b) The Owen probe used in the experiment.
![]()
Figure 235. Model with Owen probes arranged. (a) Schematic diagram. (b) Wind tunnel setup diagram.
![]()
Figure 236. Wing-type support structure. (a) Schematic diagram. (b) Wind tunnel setup diagram.
![]()
Figure 237. Wind speed along the spanwise direction of the wing-type support structure.
![]()
Figure 241. Results of simulating a turbulent wind field. (a) Wind profile. (b) Turbulence intensity profile.
![]()
Figure 245. Grid apparatus in the laboratory. (a) Schematic diagram. (b) Wind tunnel setup diagram.
![]()
Figure 246. CA-04 downburst simulation apparatus in the laboratory. (a) Schematic diagram (unit: mm). (b) Wind tunnel setup diagram.
![]()
Figure 247. Schematic diagram of the downburst apparatus support structure (unit: mm). (a) Front view. (b) Side view.
![]()
Figure 251. Schematic diagram of the suspension of the main beam vibration measurement sectional model. (a) Construction stage. (b) Bridge completion stage.
![]()
Figure 252. Experimental results of the original cross-section. (a) Construction state vertical bending vortex-induced-vibration. (b) Construction state torsional vortex-induced-vibration. (c) Bridge completion state vertical bending vortex-induced-vibration. (d) Bridge completion state torsional vortex-induced-vibration.
![]()
Figure 253. Vortex-induced-vibration suppression measures. (a) Railing with one solid section and three sections. (b) Railing with one solid section and two sections. (c) Quarter of the railing sealed.
![]()
Figure 254. Experimental results of vibration suppression measures. (a) Results of Measure One experiment, amplitude. (b) Results of Measure One experiment, torsion angle. (c) Results of Measure Two experiment, amplitude. (d) Results of Measure Two experiment, torsion angle. (e) Results of Measure Three experiment, amplitude. (f) Results of Measure Three experiment, torsion angle.
![]()
Figure 256. Test results of vibration suppression measures for large-scale sectional model. (a) Results of Measure Two experiment, amplitude. (b) Results of Measure Two experiment, torsion angle. (c) Results of Measure Three experiment, amplitude. (d) Results of Measure Three experiment, torsion angle.
![]()
Figure 258. Schematic diagram of the standard cross-section of the stiffening girder (unit: mm) (Ge et al., 2022).
![]()
Figure 259. Schematic diagram of the main beam sectional model suspended in the wind tunnel.
![]()
Figure 261. Temporary and permanent vibration suppression measures for the Humen Bridge vortex-induced-vibrations. (a) Turbulence generators experimental setup. (b) Actual bridge installation. (c) Removal of outer maintenance car track. (d) Picture.
![]()
Figure 262. Humen Bridge stiffening girder cross-section vertical bending vortex-induced-vibration. (a) Vertical vortex vibration response at different Scruton numbers. (b) Identification results of the stable amplitude variation with Scruton number.
![]()
Figure 264. Comparison chart of vertical bending vortex-induced-vibration amplitudes of the Humen Bridge stiffening girder at different wind attack angles.
![]()
Figure 265. Comparison chart of torsional vortex-induced-vibration amplitudes of the Humen Bridge stiffening girder at different wind attack angles.
![]()
Figure 266. Schematic diagram of the Huangmaohai Bridge. (a) Span layout (unit: m). (b) Photo of span. (c) Main beam cross-section (unit: mm).
![]()
Figure 267. Two types of linear beam bottom cross-sectional diagrams (unit: mm). (a) Curved bottom beam cross-section. (b) Zigzag bottom beam cross-section.
![]()
Figure 269. Curved bottom beam original cross-section (Fig. 267(a)) vortex-induced-vibration test results. (a) Vertical displacement (with the limit of 279 mm). (b) Torsion (with the limit of 0.145°).
![]()
Figure 271. Recommended Scheme 1 experimental results. (a) Vertical bending damping ratio 2.50‰ (with a limit of 279 mm). (b)Torsional damping ratio 0.84‰ (with a limit of 0.145°).
![]()
Figure 273. Recommended Scheme 2 experimental results. (a) Vertical bending damping ratio 2.50‰ (with a limit of 279 mm). (b) Torsional damping ratio 0.84‰ (with a limit of 0.145°).
![]()
Figure 274. Vortex-induced-vibration test results for the original design scheme of the zigzag bottom beam (as depicted in Fig. 267(b)). (a) Vertical displacement (with the limit of 279 mm). (b) Torsion (with the limit of 0.145°).
![]()
Figure 276. Recommended Scheme 1 test results. (a) Vertical bending damping ratio 1.90‰ (with the limit of 279 mm). (b) Torsional damping ratio 1.40‰ (with the limit of 0.145°).
![]()
Figure 278. Recommended Scheme 2 test results. (a) Vertical bending damping ratio 1.90‰ (with the limit of 279 mm). (b) Torsional damping ratio 1.40‰ (with the limit of 0.145°).
![]()
Figure 279. Vortex-induced-vibration under different vertical plate heights. (a) Vertical amplitude. (b) Torsion.
![]()
Figure 280. Vortex-induced-vibration under different vertical plate heights. (a) Vertical amplitude. (b) Torsion.
![]()
Figure 281. Amplitude-wind speed curve under different damping ratios. (a) Vertical reduced amplitude. (b)Torsional degree.
![]()
Figure 283. Model amplitude-wind speed curve of double lower central stabilizing plates at different spacings. (a) Torsional degree, wh = 0.7 m. (b) Vertical reduced amplitude, wh = 0.7 m. (c) Torsional degree, wh = 0.7 m. (d) Vertical reduced amplitude, wh = 1.4 m. (e) Torsional degree, wh = 2.1 m. (f) Vertical reduced amplitude, wh = 2.1 m.
![]()
Figure 287. Typical mode shape diagram of Shenzhong Bridge. (a) Symmetric vertical bending mode shape diagram. (b) Symmetric torsional mode shape diagram.
![]()
Figure 291. Application of recommended aerodynamic measures on Shenzhong Bridge in the actual bridge. (a) Upper central stabilizer plate. (b) High ventilation rate guardrail.
![]()
Figure 292. Schematic diagram of the pushover analysis procedure for bridge soft flutter.
![]()
Figure 293. Soft flutter phenomenon in the torsional response at (a+1)° angle of attack.
![]()
Figure 294. Comparison of calculated and experimental displacement values at the midspan cross-section.
![]()
Figure 296. Cross-sectional diagram of the main beam for the South Navigation Bridge (unit: mm).
![]()
Figure 298. Schematic diagram of main aerodynamic measures. (a) Dimension of the measure (unit: mm). (b) Illustration of the measures.
![]()
Figure 299. Final optimization plan measures and final cross-section schematic diagram (unit: mm).
![]()
Figure 300. Schematic diagram of the original cross-section state of the completed bridge (upper) and the state with added measures (lower) (unit: mm).
![]()
Figure 301. Torsional vibration response in the 5 m beam height scheme under state with added measures.
![]()
Figure 305. Bridge response analysis under tornado influence. (a) Time-history response results of torsional displacement at the midspan of the main beam. (b) Time-history response results of vertical displacement at the midspan of the main beam.
![]()
Figure 310. Test scenario schematic diagram. (a) Original plan maintenance walkway. (b) GC1 scenario maintenance walkway. (c) Guide vane schematic diagram (unit: mm).
![]()
Figure 312. Different layout parameter of the maintenance track (unit: mm). (a) T1. (b) T2. (c) T3.
![]()
Figure 315. Schematic diagram of the characteristic area Ф of the inverted L-shaped guide vane (unit: mm).
![]()
Figure 316. Analysis of the influence of L-shaped guide vanes on flutter parameter. (a) Influence of Ф* on A1*. (b) The influence of Ф* on A2*. (c) Influence of Ф* on the ξA term aerodynamic damping. (d) Influence of Ф* on the ξD term aerodynamic damping. (e) Influence of Ф* on the torsional participation degree. (f) Influence of Ф* on the vertical participation degree.
![]()
Figure 321. First torsional vortex-induced-vibration interval amplitude surface and discriminant plane. (a) First torsional vortex-induced-vibration maximum amplitude variation surface. (b) First torsional vortex-induced-vibration interval discriminant plane.
![]()
Figure 322. Design parameter design domain. (a) Horizontal plate variation range. (b) Maintenance vehicle track and stabilizer plate variation range.
![]()
Figure 323. Model sample points and Kriging model updating. (a) Final model sample point distribution. (b) Kriging model updating.
![]()
Figure 324. Aerodynamic shape of the optimal cross-section. (a) Optimal cross-section 3D illustration. (b) Optimal cross-section design parameter.
Table 1 Top 10 suspension bridges.
No. Bridge name Main span (m) Country Year 1 Zhangjinggao Bridge 2300 China Under construction 2 Shiziyang Bridge 2180 China Under construction 3 1915 Canakkale Bridge 2023 Turkey 2022 4 Akashi Kaikyo Bridge 1991 Japan 1998 5 Yanji Changjiang Bridge 1860 China Under construction 6 Shuangyumen Bridge 1768 China Under construction 7 Xianxinlu Bridge 1760 China Under construction 8 Yangsi Harbor Bridge 1700 China 2019 9 Nansha Bridge 1688 China 2019 10 Lingdingyang Bridge 1666 China 2024  下载: 导出CSV
Table 2 Top 10 cable stayed bridges.
No. Bridge name Main span (m) Country Year 1 Changtai Bridge 1208 China 2024 2 Guanyinsi Bridge 1160 China Under construction 3 Maanshan Changjiang Bridge 1120 China Under construction 4 Russky Bridge 1104 Russian 2012 5 Hutong Changjiang Bridge 1092 China 2020 6 Sutong Changjiang Bridge 1088 China 2008 7 Stone-cutter Bridge 1018 China 2009 8 Wuhan Qingshan Changjiang Bridge 938 China 2019 9 Edong Changjiang Bridge 926 China 2010 10 Jiayu Changjiang Bridge 920 China 2019
下载: 导出CSV
Table 3 Grid turbulence field of turbulent flow intensity estimation equation.
W (cm) Turbulence intensity (%) Format Note 60 40 30 20
下载: 导出CSV
Table 4 Estimated equation for the turbulence integral scale of the grating turbulence field.
W (cm) Turbulence length scale (m) Format Note 60 40 30 20
下载: 导出CSV
Table 5 YS10-1 Diagonal cable vibration test results.
Fundamental frequency (Hz) Logarithmic decay Theoretical 1.00 No damper 0.021 Measured 1.05 With damper 0.179
下载: 导出CSV
Table 6 Flutter critical wind speeds and parameter F of typical sections.
Object Cross-section Parameter F Flutter critical wind speeds (m/s) Ideal flat plate Flat plate 0.1478 16.5 Jiangyin Bridge Closed box beam 0.2087 71.3 Xihoumen Bridge Slotted box beam 1.1936 89.2 Messina Strait Bridge Double slotted blunt body section 9.5733 90.0
下载: 导出CSV
Table 7 Futter driving term and critical flutter wind speed of different girder section types.
Bridge No. Main beam section form Angle of attack (°) A D A + D Wind speed (m/s) 1 Flat steel bow girder 0 – – – – L 19.0 2 Fat steel box girder 0 + + + – M 64.4 3 Steel truss beam 0 + + + – M 66.5 4 Closed box girder 3 + + + – M 70.2 5 Closed box girder 0 + + + – M 71.3 6 Edge-box girder 0 + + + – M 82.2 7 Double-slotted bluff body 0 + + + – M 89.2 8 Double-slotted box girder 0 + + + – M 90.0 9 Slotted steel box girder 0 + – – + H 116.0 Note: L represents a low critical flutter wind speed and poor flutter stability, H represents a high critical futter wind speed and strong futter stability, M represents a situation between states L and H.
下载: 导出CSV
Table 8 K values of aerodynamic term selection of typical cross-sectional bridges.
Bridge name Bridge type Pneumatic measures Bridge section form Wind attach angle (°) Wind speed (m/s) K No.2 Suspension bridge Without pneumatic measurements Flat steel box girder 0 64.38 2.257 With pneumatic measurements 0 71.30 2.697 No.3 Suspension bridge Without diversion plate and central stabilizer Steel truss Beams 0 42.50 −0.891 With diversion plate and central stabilizer 0 66.50 −0.421 No.4 Suspension bridge Different wind barrier Closed steel box girder 0 46.80 −2.219 Different wind barrier 0 70.20 −1.284 No.7 Suspension bridge Without diversion plate Slotted steel box girder 3 87.10 −0.0957 With diversion plate 3 88.70 −0.0744 No.9 Cable-stayed bridge With wind barrier Slotted steel box girder 0 100.65 −0.235 Without wind barrier 0 116.00 −0.178
下载: 导出CSV
Table 9 Errors in flutter derivative identification or prediction at −3° wind attack angle.
Identification or prediction method RSM 0.0362 0.0126 0.2607 0.0802 0.3370 0.4669 0.0959 1.0166 BP ANN 0.0330 0.0120 0.2584 0.0701 0.3410 0.4590 0.1019 1.0983 RBF ANN 0.0746 0.0067 0.2099 0.0773 0.6084 0.4243 0.2064 1.1032
下载: 导出CSV
Table 10 Errors in flutter derivative identification or prediction at 0° wind attack angle.
Identification or prediction method RSM 0.0503 0.0166 0.0964 0.1136 0.4414 1.1756 0.9591 0.5940 BP ANN 0.0584 0.0166 0.1417 0.1148 0.4973 1.1964 0.9506 0.5746 RBF ANN 0.0716 0.0350 0.0774 0.1511 0.4956 1.0517 0.9897 0.7379
下载: 导出CSV
Table 11 Errors in flutter derivative identification or prediction at +3° wind attack angle.
Identification or prediction method RSM 0.0957 0.0609 0.0485 0.1417 0.2223 0.0945 0.1392 0.4147 BP ANN 0.0941 0.0637 0.0431 0.1391 0.2320 0.1040 0.1237 0.4470 RBF ANN 0.1323 0.0428 0.0599 0.2088 0.4239 0.2425 0.2500 0.4171
下载: 导出CSV
Table 12 Comparison of model flutter critical wind speed calculations.
Flutter critical wind speed Error of calculation results relative to wind tunnel test results Wind attack angle +3° 0° −3° +3° 0° −3° Wind tunnel test 18.1 20.5 21.1 – – – RSM 23.9 23.0 26.1 32.04% 12.20% 23.70% BP ANN 22.6 23.2 24.7 24.86% 13.17% 17.06% RBF ANN 25.2 16.7 22.1 39.23% −18.54% 4.74%
下载: 导出CSV
Table 13 Wind resistance measure test program.
Scheme number Aerodynamic measure Wind resistance measures Schematic diagram Detailed parameter information 1 Lower central stabilizer h1 = 1.12 m 2 Lower central stabilizer and horizontal guide vane combination h1 = 1.12 m, L2 = 1.28 m 3 Lower central stabilizer and oblique guide vane combination h1 = 1.12 m, L2 = 1.28 m, inclination angle 30° 4 Lower central stabilizer and built-in oblique guide vane combination Ⅰ h1 = 1.12 m, L2 = 1.28 m, inclination angle 30° 5 Lower central stabilizer and built-in oblique guide vane combination Ⅱ h1 = 1.12 m, L2 = 1.28 m, inclination angle 30° 6 Upper central stabilizer and lower central stabilizer combination Ⅰ h1 = 1.12 m, h2 = 0.80 m 7 Upper central stabilizer and lower central stabilizer combination Ⅱ h1 = 1.12 m, h2 = 1.28 m 8 Upper central stabilizer and lower central stabilizer combination Ⅲ h1 = 1.12 m, h2 = 1.28 m, interval = 30 m 9 Lower central stabilizer, horizontal guide vane, and partially closed crash barrier combination Ⅰ h1 = 1.12 m, L2 = 2.00 m 10 Lower central stabilizer, horizontal guide vane, and partially closed crash barrier combination Ⅱ h1 = 1.12 m, L2 = 2.00 m 11 Lower central stabilizer, horizontal guide vane, and 0.9 m crash barrier combination h1 = 1.12 m, L2 = 2.00 m, crash barrier = 0.9 m
下载: 导出CSV
Table 14 Results of wind resistance measure test program.
Scheme number Flutter check wind speed (m/s) Flutter critical wind speed at different wind attack angles (m/s) −5° −3° 0° 3° 5° 1 53.07 – > 70.4 50.6 37.4 – 2 – > 70.4 66.0 17.6 – 3 – > 70.4 66.0 39.6 – 4 – 66.0 48.4 41.8 – 5 – 57.2 39.6 33.0 – 6 > 70.4 > 70.4 > 70.4 > 70.4 48.4 7 > 70.4 > 70.4 > 70.4 > 70.4 > 70.4 8 > 70.4 > 70.4 > 70.4 > 68.2 39.6 9 57.2 > 70.4 66.0 > 70.4 > 70.4 10 66.0 > 70.4 66.0 > 70.4 61.6 11 – > 66.00 43.80 41.61 –
下载: 导出CSV
Table 15 Comparison of calculation results with different wind resistance measures.
Static analysis results of wind resistance cable unit at different angles Mid-span wind resistance cable 0° 30° 45° 60° 90° Displacement of wind cable (m) Horizontal −0.0008 −0.1177 −0.1216 −0.0973 0 Vertical 0.3629 0.2054 −0.123 −0.0574 −0.0012 Displacement of main beam (m) Horizontal 0 0 0 0 0 Vertical −0.2879 −0.6314 −0.7521 −0.8312 −0.8883 Cable tension (kN) 3611 3348 3154 2986 2837 Static analysis results of wind resistance cable unit under different initial strains Mid-span wind resistance cable 2500 kN 3000 kN 3500 kN 4000 kN 4500 kN Displacement of wind cable (m) Horizontal 0.1330 0.1270 −0.1216 0.1160 0.1100 Vertical 0.1340 0.1280 −0.1230 0.1180 0.0800 Displacement of main beam (m) Horizontal 0 0 0 0 0 Vertical 0.5603 0.6584 −0.7521 0.8422 0.9290 Cable tension (kN) 2242 2697 3154 3245 4072 Static analysis results of different lengths of tie rods Mid-span wind resistance cable 0.5 1 2 3 4 Displacement of wind cable (m) Horizontal (m) −0.0804 −0.1216 −0.1795 −0.2225 −0.2575 Vertical (m) −0.0811 −0.1230 −0.1821 −0.2264 −0.2667 Displacement of main beam (m) Horizontal (m) 0 0 0 0 0 Vertical (m) −0.7621 −0.7521 −0.7400 −0.7323 −0.7268 Cable tension (kN) 3158 3154 3148 3144 3141
下载: 导出CSV
Table 16 Comparison of fundamental frequency with different central buckles.
Design scheme with one central buckle (Hz) Design scheme with three central buckle (Hz) Design scheme with one central buckle and 45° wind resistance cable (Hz) Design scheme with three central buckle and 45° wind resistance cable (Hz) Lateral bending Symmetrical 0.1592 0.1595 0.3247 0.3247 Asymmetrical 0.5082 0.5088 0.6152 0.6152 Vertical bending Symmetrical 0.3649 0.3642 0.5614 0.5607 Asymmetrical 0.2389 0.2393 0.4130 0.4130 Torsion Symmetrical 1.3123 1.3090 1.6109 1.7286 Asymmetrical 1.4814 1.4865 1.7741 1.7784
下载: 导出CSV
Table 17 Effect of auxiliary cable on the natural frequency.
Mode shape First asymmetrical bending First symmetrical bending First asymmetrical torsion First symmetrical torsion Original scheme Frequency (Hz) 0.2534 0.3645 0.9092 1.0815 Scheme with auxiliary cable Horizontal Frequency (Hz) 0.3319 0.4491 1.2593 1.5926 Increase (%) 31 23 39 47 45° Frequency (Hz) 0.4119 0.5599 1.2672 1.5824 Increase (%) 62 53 39 46 Vertical Frequency (Hz) 0.4484 0.6082 1.2302 1.5894 Increase (%) 77 67 35 47
下载: 导出CSV
Table 18 Effect of mitigation on critical wind speed of flutter.
Attack angle Flutter analysis (m/s) Test results (m/s) With mitigation measures (m/s) α = −3° 15.17 25.50 59.5 α = 0° 35.60 > 45.00 > 80.5 α = 3° 28.56 40.50 > 66.5
下载: 导出CSV
Table 19 Analysis of CFD computational results for standard k-ε turbulence model and SST k-ω turbulence model.
Wind speed 10 m/s 30 m/s 50 m/s 70 m/s Experimental value 0.67 0.61 0.58 0.54 Standard k-ε turbulence model 0.58 0.70 0.76 0.83 SST k-ω turbulence model 0.60 0.57 0.57 0.57
下载: 导出CSV
Table 20 Inflow characteristic study variable weight matrix.
Index weight Upstream surface roughness Incoming wind speed Incoming wind speed profile Incoming wind direction Wind speed 0.132 0.100 0.387 0.387 Wind attack angle 0.203 0.107 0.083 0.608 Wind bias angle 0.100 0.094 0.300 0.500
下载: 导出CSV
Table 21 Design basic wind speed for the Jianghai Direct Ship Navigation Bridge.
Reference wind speed (m/s) Flutter test wind speed (m/s) Bridge completion stage 52.83 79.88 Construction stage 44.38 67.10
下载: 导出CSV
Table 22 Natural frequencies, equivalent masses, and mode shapes of the main vibration modes for the self-standing cable tower.
Mode shape Frequency Equivalent mass Vibration mode description 1 0.5757 3.22 t/m First-order lateral bending of the cable tower 2 0.8296 3.49 t/m First-order longitudinal bending of the cable tower 3 2.8970 2.82 t/m Second-order lateral bending of the cable tower 4 3.7194 2450 t·m2/m First-order torsion of the cable tower 5 5.4113 4.69 t/m Second-order longitudinal bending of the cable tower 7 8.9452 530 t·m2/m Second-order torsion of the cable tower
下载: 导出CSV
Table 23 Natural frequencies, equivalent masses, and mode descriptions of the first 15 principal vibration modes before bridge completion.
Mode shape Frequency Equivalent mass Vibration mode description 1 0.3373 35 t/m First-order anti-symmetric symmetric vertical bending of the main beam 2 0.3375 33.4 t/m First-order anti-symmetric symmetric vertical bending of the main beam 4 0.5217 34.2 t/m First-order symmetric same-direction vertical bending of the main beam 9 0.8811 31.4 t/m First-order anti-symmetric same-direction vertical bending of the main beam 10 0.9082 32.7 t/m First-order anti-symmetric opposite-direction lateral bending of the main beam 11 1.0214 3630 t·m2/m First-order torsion of the main beam 13 1.0780 3590 t·m2/m Second-order torsion of the main beam 14 1.1190 28.4 t/m Second-order anti-symmetric same-direction vertical bending of the main beam
下载: 导出CSV
Table 24 Design parameter of the vortex-induced-vibration test sectional model.
Working condition Parameter name Symbol Unit Actual bridge value Scale ratio Designed model value Measured model value Error (%) Bridge completion stage Equivalent mass m kg/m 29,200 1/502 11.68 11.54 1.20 Equivalent mass moment of inertia Jm kg·m2/m 2,850,000 1/504 0.46 – – Vertical bending fundamental frequency fv Hz 0.1764 50/2.5 3.53 3.50 0.85 Torsional fundamental frequency ft Hz 1.1111 50/5.8 9.58 9.58 0 Vertical bending damping ratio ζv – – – – 0.0028 – Torsional damping ratio ζt – – – – 0.0031 – Construction stage Equivalent mass m kg/m 35,000 1/502 14.00 13.93 0.50 Equivalent mass moment of inertia Jm kg·m2/m 3,630,000 1/504 0.58 – – Vertical bending Fundamental frequency fv Hz 0.3373 50/2.5 6.75 6.67 1.19 Torsional fundamental frequency ft Hz 1.0214 50/2.5 20.43 20.02 2.01 Vertical bending damping ratio ζv – – – – 0.0025 – Torsional damping ratio ζt – – – – 0.0027 –
下载: 导出CSV
Table 25 Comparison of maximum amplitudes of vortex-induced-vibration.
Actual bridge frequency (Hz) Amplitude allowable value calculation formula Allowable value Maximum amplitude Conclusion Bridge completion stage Vertical 0.1764 0.04/fv 0.227 m 0.0165 m Meets requirements Torsional 1.1111 4.56/(B × ft) 0.106° 0.0527° Meets requirements Construction stage Vertical 0.3373 0.04/fv 0.119 m 0.3940 m Exceeds allowable value Torsional 1.0214 4.56/(B × ft) 0.115° 0.2483° Exceeds allowable value Note: fv represents the first-order symmetric vertical bending frequency; B is the bridge width; ft is the first-order symmetric torsional frequency.
下载: 导出CSV
Table 26 Design parameter of the large-scale vortex-induced-vibration test sectional model.
Working condition Parameter name Symbol Unit Actual bridge value Scale ratio Designed model value Measured model value Error (%) Bridge completion stage Equivalent mass m kg/m 35,000 1/202 87.50 86.67 0.95 Equivalent mass moment of inertia Jm kg·m2/m 3,630,000 1/204 22.69 – – Vertical bending fundamental frequency fv Hz 0.3373 20/2 3.37 3.38 0.30 Torsional fundamental frequency ft Hz 1.0214 20/2 10.21 10.15 0.59 Vertical bending damping ratio ζv – – – – 0.0036 – Torsional damping ratio ζt – – – – 0.0033 –
下载: 导出CSV
Table 27 Computational results of dynamic characteristics.
Vibration mode Solid model frequency (Hz) Equivalent mass Mode description 1 0.0875 – First-order symmetric lateral bending 2 0.1658 – First-order symmetric vertical bending 3 0.2345 – Second-order symmetric vertical bending* 4 0.2705 – Second-order antisymmetric vertical bending* 5 0.2822 23.4 t/m First-order antisymmetric lateral bending 6 0.3596 23.61 t/m First-order antisymmetric torsion 7 0.3646 – Third-order symmetric vertical bending 8 0.3663 2910 t·m2/m First-order symmetric torsion
下载: 导出CSV
Table 28 Vortex-induced-vibration test model parameter for bridge completion state.
Parameter Symbol Unit Scale ratio Actual bridge Model design value Model measured value Girder height H m 1/60 3 0.05 0.05 Girder width B m 1/60 35.6 0.59 0.59 Equivalent mass per meter of length m kg/m 1/602 24,376.6 6.771 6.771 Equivalent mass moment of inertia per meter of length Jm kg·m2/m 1/604 5,551,970 0.428 0.431 Vertical bending frequency fv Hz – 0.2765 – 3.125 Vertical bending damping ratio ζv – 1 0.3% 0.3% 0.22% Wind speed ratio – – – – 1:5.31 Torsional frequency ft Hz – 0.3612 6.688 6.67 Torsional damping ratio ζt – 1 0.3% 0.3% 0.29% Wind speed ratio – – – – 1:3.24
下载: 导出CSV
Table 29 Summary of vibration suppression measures.
Measure type Specific content Schematic diagram Railing turbulence generators 40 cm, 45° (A) 30 cm, 45° (B) 50 cm, 45° (C) Maintenance car track Inner turbulence boards adjacent to outer maintenance car tracks (D) Removal of central maintenance car track (E) Removal of outer maintenance car track (F) Inner maintenance car track spacing of 8.2 m (G) Inner maintenance car track spacing of 6 m (H) Outer maintenance car track moved inward to 1.8 m from the bottom of the diagonal web plate (I) Railing Railing closed at every third step (K) Railing closed at every second step (L) Upper central stabilizer Upper central stabilizer (M)
下载: 导出CSV
Table 30 Experimental results of vibration suppression measures.
Wind attack angle Actual bridge wind speed Amplitude (mm) Specification value (mm) Conclusion +5° 8.70 430.00 145 Not satisfied +3° 8.70 435.00 145 Not satisfied 0° 8.30 412.00 145 Not satisfied −3° 6.40 345.00 145 Not satisfied −5° 7.50 301.00 145 Not satisfied +5° 8.30 173.00 145 Not satisfied 0° 8.30 35.00 145 Satisfied −3° 8.30 23.00 145 Satisfied −5° 7.00 12.00 145 Satisfied +5° 11.50 19.00 145 Satisfied +5° 17.00 100.00 145 Satisfied −3° 6.90 31.00 145 Satisfied +5° 8.49 474.60 145 Not satisfied +5° 8.49 441.69 145 Not satisfied +3° 8.49 183.60 145 Not satisfied +5° 8.49 138.57 145 Satisfied +5° 7.70 75.00 145 Satisfied +3° 8.50 65.00 145 Satisfied 0° 8.30 64.00 145 Satisfied −3° 8.20 57.00 145 Satisfied −5° 6.80 83.00 145 Satisfied +5° 8.70 36.00 145 Satisfied +3° 7.80 50.00 145 Satisfied 0° 7.90 52.00 145 Satisfied −3° 7.30 55.00 145 Satisfied −5° 7.20 75.00 145 Satisfied
下载: 导出CSV
Table 31 Vibration parameter of vortex-induced-vibration test for closed-box girder cross-section.
Working Condition Frequency f (Hz) Mass M (kg) Damping ζs (%) Sc m* 1# 4.248 8.806 0.305 5.192 172.4 2# 4.346 8.806 0.442 7.529 172.4 3# 4.492 8.806 0.624 10.621 172.4 4# 4.492 8.806 0.859 14.620 172.4 5# 5.078 8.806 2.113 35.952 172.4 6# 4.199 10.546 0.874 17.797 206.4 7# 4.102 10.546 0.437 8.905 206.4
下载: 导出CSV
Table 32 Curved bottom beam model parameter.
Parameter Symbol Unit Scale Actual bridge Model measured value Girder height H m 1/70 4.01 0.058 Girder width B m 1/70 50 0.722 Equivalent mass m kg/m 1/702 7.560 Equivalent mass moment of inertia Jm kg⋅m2/m 1/704 8.49 × 10⁶ 0.548 Vertical bending frequency fv Hz – 0.1432 3.711 Torsional frequency ft Hz – 0.6295 9.570
下载: 导出CSV
Table 33 Zigzag bottom beam model experimental parameter.
Parameter Symbol Unit Scale Actual bridge Model measured value Girder height H m 1/70 3.90 0.0560 Girder width B m 1/70 49.057 0.7000 Equivalent mass m kg/m 1/702 3.70 × 10⁴ 7.2680 Equivalent mass moment of inertia Jm kg⋅m2/m 1/704 8.49 × 10⁶ 0.5678 Vertical bending frequency fv Hz – 0.1432 3.7840 Torsional frequency ft Hz – 0.6295 9.3990
下载: 导出CSV
Table 34 Test numbers and corresponding damping effects.
Scheme number and description Angle of attack (°) Vortex-induced-vibration range (m/s) Maximum amplitude value Whether it meets the specification requirements Vertical (mm) Torsion (°) Vertical (mm) Torsion (°) 1. Maintenance vehicle track guide vane 0 2.71–6.26 13.26–14.91 352.330 0.200 Not 2. Maintenance vehicle track guide vane + full enclosure of maintenance path railings + full enclosure of inner railings 0 4.05–6.76 12.96–17.86 369.410 0.090 Not 3. Maintenance vehicle track guide vane + full enclosure of maintenance path railings + full enclosure of inner railings + bridge deck cover 0 – 14.11–18.55 – 0.210 Not 4. Maintenance vehicle track guide vane + full enclosure of maintenance path railings + full enclosure of inner railings + vortex shedding plate 0 3.52–6.22 – 387.840 – Not 5. Maintenance vehicle track guide vane + full enclosure of maintenance path railings + full enclosure of inner railings + vortex shedding plate + bridge deck cover 0 4.56–6.75 14.05–16.71 134.290 0.190 Not 6. Maintenance vehicle track guide vane + full enclosure of maintenance path railings + full enclosure of inner railings + single-sided vortex shedding plate + bridge deck cover 0 4.59–5.94 13.36–16.64 187.990 0.180 Not 7. Maintenance vehicle track guide vane + full enclosure of maintenance path railings + full enclosure of inner railings + upper central stabilizing plate 0 4.05–6.78 – 418.830 – Not 8. Maintenance vehicle track guide vane + full enclosure of maintenance path railings + full enclosure of inner railings + bridge deck cover + upper central stabilizing plate 3 – 11.84–17.85 – 0.160 Not 0 – 10.28–11.98 – 0.100 Yes 9. Maintenance vehicle track guide vane + full enclosure of inner railings + bridge deck cover + central stabilizing plate 3 – – – – Yes 0 – – – – Yes −3 – – – – Yes 10. Maintenance vehicle track guide vane + bridge deck cover + central stabilizing plate 0 4.6–6.79 21.47–28.98 250.650 0.970 Not 11. Maintenance vehicle track guide vane + horizontal guide vane 3 – 21.49–27.51 – 0.310 Not 0 2.18–2.78 – 119.800 – Yes 12. Maintenance vehicle track guide vane + horizontal guide vane + vortex shedding plate 3 – 22.94–26.31 – 0.036 Yes 0 – – – – Yes −3 – – – – Yes 13. Maintenance vehicle track guide vane + vortex shedding plate 3 2.71–6.03 12.62–15.55 177.380 0.160 Not 0 – 11.89–15.6 – 0.070 Yes −3 2.75–5.18 12.25–16.65 85.690 0.010 Yes 14. Maintenance vehicle track guide vane + bottom beam guide vane 0 2.71–4.60 20.04–27.88 278.440 0.280 Not 15. Maintenance vehicle track guide vane + vortex shedding plate + bottom beam guide vane 0 4.07–6.03 21.47–29.67 90.260 0.840 Not 16. Maintenance vehicle track guide vane + bottom beam guide vane 0 2.71–4.57 19.59–27.06 158.860 0.580 Not 17. Maintenance vehicle track guide vane + full enclosure of inner railings 0 0.78–1.03 15.14–24.05 72.990 1.030 Not 18. Maintenance vehicle track guide vane + full enclosure of inner railings + double lower central stabilizing plates 0 2.68–4.40 19.68–27.06 17.490 0.560 Not 19. Maintenance vehicle track guide vane +2.8 m spaced 2.1 m double lower central stabilizing plates 3 – 19.31–25.18 – 0.020 Yes 0 2.18–2.71 2.90–3.78 54.340 0.030 Yes −3 – – – – Yes 20. Maintenance vehicle track guide vane + double lower central stabilizing plates 0 2.7–6.21 23.31–29.6 258.300 0.320 Not 21. Maintenance vehicle track guide vane +2.8 m spaced 0.7 m double lower central stabilizing plates 3 2.7–4.86 20.72–26.64 247.450 0.608 Not 0 2.7–5.13 11.47–15.17 192.700 0.015 Yes 22. Maintenance vehicle track guide vane +2.8 m spaced 1.4 m double lower central stabilizing plates 3 2.7–4.86 19.24–25.53 18.880 0.012 Yes 0 – – – – Yes −3 – – – – Yes 23. Maintenance vehicle track guide vane +11 m spaced 1.4 m double lower central stabilizing plates 3 2.16–4.86 16.28–23.31 123.750 0.036 Yes 0 2.16–4.32 18.5–25.9 21.670 0.032 Yes −3 – 22.94–27.75 – 0.012 Yes
下载: 导出CSV
Table 35 Test numbers and corresponding damping effects.
Scheme number and description Angle of attack (°) Vortex-induced-vibration range (m/s) Maximum amplitude value Whether it meets the specification requirements Vertical (mm) Torsion (°) Vertical (mm) Torsion (°) 2 m internal girder height + double lower central stabilizing plates + maintenance vehicle track guide vane + inverted L-shaped guide vane 0 – 22.44–26.17 – 0.010 Yes 3 – 23.82–26.17 – 0.021 Yes −3 – – – – Yes 2 m internal girder height + double lower central stabilizing plates + inverted L-shaped guide vane 0 – 12.96–17.86 – 0.090 Yes 3 – 22.13–26.30 – 0.017 Yes −3 – – – – Yes 1 m internal girder height + double lower central stabilizing plates + maintenance vehicle track guide vane + inverted L-shaped guide vane 0 – 22.52–24.61 – 0.015 Yes 3 – 12.26–16.94 – 0.150 Not −3 – – – – Yes 1.5 m internal girder height + double lower central stabilizing plates + maintenance vehicle track guide vane + inverted L-shaped guide vane 0 – 22.91–25.27 – 0.012 Yes 3 – 13.37–17.15 – 0.031 Yes −3 – – – – Yes 1.5 m internal girder height + maintenance vehicle track guide vane + inverted L-shaped guide vane 0 – 11.28–14.16 22.11–28.98 – 0.497 Not
下载: 导出CSV
Table 36 Design wind parameter for Shen Zhong Bridge.
Design reference wind speed for the main beam (m/s) Flutter test wind speed (m/s) Based on actual measurements from observation stations 46.9 67.0 Statistical results based on typhoon wind speeds from meteorological data 53.6 76.5 Based on the method specified in the code/standard 58.5 83.5
下载: 导出CSV
Table 37 Results of main modal dynamic characteristics.
Main modes Original plan Recommended optimized plan Frequency (Hz) Equivalent mass Frequency (Hz) Equivalent mass MY (t/m) JX (t·m2/m) MY (t/m) JX (t·m2/m) First-order symmetric vertical bending 0.1014 42.4 – 0.1001 46.4 – First-order anti-symmetric vertical bending 0.1006 67.7 – 0.1009 73.1 – First-order symmetric torsion 0.2197 – 9915.4 0.2177 – 10622.0 First-order anti-symmetric torsion 0.2182 – 10903.0 0.2229 – 11525.9
下载: 导出CSV
Table 38 Design parameter of the original scheme vibration measurement segmental model for the test.
Parameter name Unit Actual bridge value Scale ratio Design value Experimental value Equivalent mass (m) kg/m 42411 1/75 15.080 15.080 Equivalent mass moment of inertia (Jm) kg·m2/m 9,838,000 1/752 0.311 – Vertical bending fundamental frequency (fv) Hz 0.1 75/6 1.250 1.221 Torsional fundamental frequency (ft) Hz 0.2228 75/6 2.785 2.810 Vertical bending damping ratio (ζv) – – – – 5.0‰ Torsional damping ratio (ζt) – – – – 2.2‰
下载: 导出CSV
Table 39 Aerodynamic optimization measures table.
Aerodynamic measures Item number Upper central stabilizer plates of 1.2, 1.4, and 1.6 m A, B, C Lower central stabilizer plate of 1.125 m D Horizontal guide vane extended by 0.75 m E Pedestrian railings sealed every two steps, fully enclosed F, G Pedestrian railings moved to the edge H Removal of pedestrian railings (ventilation rate of 100%) I Two lower quarter-point stabilizer plates (1.2 m) J Border anti-collision guardrails sealed every two steps, fully enclosed K, L Maintenance car track moved to the quarter points M Maintenance car track with openings N Maintenance car track heights of 0.7 and 0.43 m O, P Width of the pedestrian walkway of 0, 1, and 1.8 m Q, R, S Bottom plate thickened to 14 mm T
下载: 导出CSV
Table 40 Experimental results of the original scheme and the results after aerodynamic optimization measures.
Specific aerodynamic measures Test wind attack angle Flutter critical wind speed (m/s) Original scheme +3° 87.1 0° 76.7 −3° – Installation of upper central stabilizer platess A +3° 84.1 0° – −3° 76.7 Installation of lower central stabilizer plates A + D −3° 76.7 Optimization of horizontal guide vanes A + D + E −3° 75.5 A + E −3° 75.5 A + F −3° 77.3 A + E + F −3° 77.3 A + E + G −3° 81.6 Relocation of pedestrian guardrails A + G + H −3° 82.8 A + G + H + J −3° 89.0 0° 84.7 +3° 64.4 A + H + J +3° 74.9 A + H + J + K +3° 75.5 A + H + J + L +3° 82.2 −3° 70.0 A + I +3° 83.4 Adjustment of maintenance vehicle tracks A + M −3° 78.5 +3° 72.1 A + M + G +3° 74.3 A + M + I +3° > 89.2 −3° 82.8 A + M + I + N −3° 80.4 Optimization of pedestrian walkway width A + Q + M −3° 88 +3° 66–72 A + R + M +3° 60–70 A + S + M +3° 60–70 A + I + M + O +3° > 90 Thickening of the pedestrian walkway base plate to achieve a more closed shape A + M + O +3° 80.9 −3° 78.0 A + M + O + T +3° 88.2 −3° 81.5 B + M + O + T +3° > 90 −3° 83.9 C + M + O + T +3° 90.6 −3° 87.5 B + M + O + T +3° 90.6 −3° 84.5
下载: 导出CSV
Table 41 Flutter critical wind speed of the final recommended scheme (unit: m/s).
Recommended optimization plan +3° +2° +1° 0° −1° −2° −3° C + M + O 94.0 89.5* 85.1* 90.8 89.6 90.8 88.3 C + M + O + T > 91.3 89.1* 85.4* 89.1 89.8 89.8 89.8 Note: * indicates the occurrence of soft flutter phenomenon.
下载: 导出CSV
Table 42 Basic parameter and test results of the three schemes.
Param Scheme 1 Scheme 2 Scheme 3 Tower type Single-column shape Diamond shape Gate shape Cable configuration Spatial main cable Spatial main cable Parallel main cables Beam cross-section Centrally slotted split steel box girder Integral steel box girder Integral steel box girder Span-to-rise ratio 1/9.8 1/9.83 – Suspension cable spacing (m) 12.8 12.8 12.8 Model prototype Wind attack angle (°) −5 > 90 87.60 66.79 −3 > 90 92.20 77.42 0 > 90 92.20 77.92 3 90 78.40–92.20* 82.48 5 > 90 87.60 68.31 Flutter test wind speed (m/s) 83.50 83.50 83.50
下载: 导出CSV
Table 43 Design wind parameter for Zhangjinggao Bridge.
Design basic wind speed (m/s) Flutter test wind speed (m/s) Wind attack angle (±3°, 0°) Wind attack angle (±5°) South navigation bridge as-built condition 47.50 62.80 43.96
下载: 导出CSV
Table 44 Dynamic property results for the as-built condition of the Zhangjinggao Bridge.
Mode description Frequency (Hz) Equivalent mass MY (t/m) JX (t·m2/m) 4.5 m beam height First-order symmetric vertical bending mode 0.083 5.17E+01 – First-order anti-symmetric vertical bending mode 0.089 6.78E+01 – First-order symmetric torsion mode 0.160 – 1.23E+04 First-order anti-symmetric torsion mode 0.168 – 1.29E+04 5 m beam height First-order symmetric vertical bending mode 0.084 5.21E+01 – First-order anti-symmetric vertical bending mode 0.089 6.74E+01 – First-order symmetric torsion mode 0.158 – 1.28E+04 First-order anti-symmetric torsion mode 0.169 – 1.35E+04
下载: 导出CSV
Table 45 Design parameter of the flutter test sectional model.
Condition Parameter Symbol Unit Actual bridge value Scale ratio Design value Experimental value Error (%) Completed bridge condition Equivalent mass m kg/m 51,830 1/502 20.732 20.761 0.14 Equivalent mass moment of inertia Jm kg⋅m2/m 12,258,100 1/504 1.961 2.021 2.95 Fundamental frequency of vertical bending fb Hz 0.0821 50/4.2 0.977 0.992 0.15 Fundamental frequency of torsion ft Hz 0.1583 50/4.2 1.904 1.907 0.16 Damping ratio of vertical bending ξv – – – 0.3% 0.45%–0.50% – Torsional damping ratio ξt – – – 0.3% 0.24%–0.30% –
下载: 导出CSV
Table 46 Summary of parallel test results for flutter critical wind speed of the original cross-section.
Wind attack angle Actual bridge critical wind speed (m/s) Flutter test wind speed (m/s) Chang'an University Southwest Jiaotong University Tongji University −5° 44.16 – 45.40 43.96 −3° 48.48 45.90 47.60 62.80 0° 55.68 56.80 57.80 62.80 +3° 54.24 53.70 55.00 62.80 +5° 50.40 – 45.40 43.96
下载: 导出CSV
Table 47 Flutter performance enhancement plan and test results for the South Navigation Bridge.
Test condition Specific aerodynamic measures Wind attack angle Flutter test wind speed (m/s) 1 A(1.6 m) + B(0.9 m) + C(0.8 m) + D(6.75 m) −5° > 52.8 −3° 63.84 0° 63.36 +3° 63.84 +5° > 48 2 A(1.6 m) + B(0.9 m) + C(0.8 m) + D(6.75 m) + E −3° – 0° 66.72 +3° 60.96 3 A(1.35 m) + B(0.9 m) + C(0.8 m) + D(6.75 m) + E −3° 65.52 0° 64.32 +3° 61.96 4 A(1.35 m) + B(0.9 m) + C(0.8 m) + D(6.75 m) +3° 59.52 5 A(1.35 m) + B(0.9 m) + C(0.8 m) + D(4.25 m) + E +3° 59.76 6 A(1.35 m) + B(0.9 m) + C(0.8 m) + D(4.25 m) +3° 56.16 7 A(1.35 m) + B(0.9 m) + C(0.8 m) + D(8.5 m) + E +3° 61.92 8 A(1.35 m) + B(0.9 m) + C(0.8 m) + D(8.5 m) +3° 60.96 9 A(1.35 m) + B(0.9 m) + C(0.8 m) + D(9.56 m) + E +3° 60.72 10 A(1.35 m) + B(0.9 m) + C(0.8 m) + D(6.75 m) + E + G +3° 60.72 11 A(1.35 m) + B(0.9 m) + C(0.8 m) + D(6.75 m) + E + H +3° 61.44 12 A(1.35 m) + B(0.9 m) + C(0.8 m) + D(6.75 m) + E + I +3° 61.92 13 A(1.35 m) + B(0.9 m) + C(0.8 m) + D(6.75 m) + E + J −3° 46.80 +3° 63.60 14 A(1.5 m) + B(0.9 m) + C(0.8 m) + D(6.75 m) + E −3° 63.84 0° 66.00 +3° 61.44 15 A(1.5 m) + B(0.9 m) + C(0.8 m) + D(6.75 m) + E + F −5° 52.08 −3° 64.80 0° 65.76 +3° 65.52 +5° > 50.88 16 A(1.5 m) + B(0.9 m) + C(0.5 m) + D(6.75 m) + E + F −5° > 50.88 −3° 64.56 0° 65.04 +3° 64.80 +5° > 50.88 17 A(1.5 m) + B(0.9 m) + C(0 m) + D(6.75 m) + E + F −5° > 48.96 −3° 64.56 0° 64.80 +3° 63.84 +5° > 48.96
下载: 导出CSV
Table 48 Final optimization plan flutter test results.
Wind attack angle Actual bridge critical wind speed (m/s) Flutter test wind speed (m/s) Chang'an University Southwest Jiaotong University Tongji University +5° > 51.7 46.7 > 51.2 44.0 +3° 64.7 63.1 63.8 62.8 0° 65.5 64.5 63.8 62.8 −3° 65.3 63.1 63.4 62.8 −5° > 50.9 56.9 49.6 44.0
下载: 导出CSV
Table 49 Flutter critical wind speeds for bridge cross-sections of the 4.5 m and 5 m schemes.
Wind attack angle Actual bridge critical wind speed (m/s) Flutter test wind speed (m/s) Original cross-section state State with added measures 4.5 m beam height 5 m beam height 4.5 m beam height 5 m beam height −5° 44.16 46.55 > 51.70 55.37 44.00 −3° 48.48 46.06 64.70 67.13 62.80 0° 55.68 48.02 65.50 63.70 62.80 + 3° 54.24 52.43 65.30 65.17 62.80 + 5° 50.40 53.90 > 50.90 63.21 44.00
下载: 导出CSV
Table 50 Longmen bridge design wind parameter overview.
Wind param As-built condition Design basic wind speed (m/s) 50.500 Flutter test wind speed (m/s) Wind attack angle (±3°, 0°) 69.700 Wind attack angle (±5°) 48.800 Vortex-induced-vibration limit amplitude Vertical limit amplitude (mm) 274.000 Torsional limit amplitude (°) 0.391
下载: 导出CSV
Table 51 Dynamic properties results of Longmen Bridge.
Principal modes and frequencies Equivalent mass Mode description Frequency (Hz) MY (t/m) JX (t·m2/m) First-order symmetric vertical bending 0.146 29.9 – First-order anti-symmetric vertical bending 0.148 78.9 – First-order symmetric torsion 0.302 – 5100 First-order anti-symmetric torsion 0.335 – 4490
下载: 导出CSV
Table 52 Cases in wind tunnel vibration test.
Test condition Wind attack angle (°) Horizontal maintenance walkway with 20% ventilation (2800 mm) (original cross-section) 0 Horizontal maintenance walkway with 0% ventilation (L1 = 2800 mm) (GC1) ±3 Inverted L-shaped maintenance walkway (horizontal L1 = 2800 mm, vertical L2 = 715 mm) (GC2) ±5 Inverted L-shaped maintenance walkway (horizontal L1 = 2800 mm, vertical L2 = 600 mm) (GC3) Inverted L-shaped maintenance walkway (horizontal L1 = 2800 mm, vertical L2 = 500 mm) (GC4)
下载: 导出CSV
Table 53 Flutter critical wind speeds for different maintenance walkway forms.
Wind attack angle −5° −3° 0° +3° +5° Flutter test wind speed (m/s) 48.8 69.7 69.7 69.7 48.8 Original cross-section – – – 52.65 46.8 GC1 > 78.1 > 78.1 > 78.1 > 78.1 65.6 GC2 > 84.4 > 84.4 > 84.4 > 81.3 > 71.9 GC3 > 81.3 > 84.4 > 84.4 76.9 > 68.8 GC4 > 84.4 > 84.4 > 84.4 80 > 68.8
下载: 导出CSV
Table 54 Combination scenario table for the vertical position and vertical plate height of the guide vane.
下载: 导出CSV
Table 55 Flutter critical wind speeds for various parameter combinations of the Longmen Bridge.
Cross-section form Wind attack angle (°) Flutter critical wind speed (m/s) H1 H1S1 −3 75 0 84 +3 72 H1S2 −3 90 0 90 +3 69 H1S3 −3 90 0 84 +3 63 H2 H2S1 −3 > 90 0 90 +3 69 H2S2 −3 90 0 87 +3 63 (soft flutter) H2S3 −3 > 90 0 84 +3 66 H3 H3S2 −3 90 0 84 +3 69 H3S3 −3 90 0 84 +3 72
下载: 导出CSV
Table 56 Main results of vortex-induced-vibration tests.
Cross-section form Vortex-induced-vibration wind speed range (m/s) Torsional vortex-induced-vibration amplitude (°) H1 H1S1 10–15 0.24 H1S2 10–15 0.28 H1S3 10–15 0.36 H2 H2S1 10–15 0.25 H2S2 11–15 0.34 H2S3 11–17 0.39 H3 H3S2 10–15 0.38 H3S3 10–15 –
下载: 导出CSV
Table 57 Flutter critical wind speed of full bridge wind tunnel test.
Wind attack angle Actual bridge flutter critical wind speed (m/s) Flutter test wind speed (m/s) +5° > 65.0 48.8 +3° > 70.2 69.7 0° > 80.0 69.7 −3° > 75.0 69.7 −5° > 65.0 48.8
下载: 导出CSV
Table 58 L-shaped wind fairings test conditions table.
Horizontal plate A 0.06 0.07 0.08 0.09 Vertical plate B 0.0 GK1 GK5 GK9 GK13 0.1 GK2 GK6 GK10 GK14 0.2 GK3 GK7 GK11 GK15 0.3 GK4 GK8 GK12 GK16
下载: 导出CSV
-
Agar, T.J.A., 1989. Aerodynamic flutter analysis of suspension bridges by a modal technique. Engineering Structures 11(2), 75-82.
Alonso, G., Meseguer, J., 2006. A parametric study of the galloping stability of two-dimensional triangular cross-section bodies. Journal of Wind Engineering and Industrial Aerodynamics 94(4), 241-253.
AASHTO, 2020. AASHTO LRFD Bridge Design Specifications, ninth ed. AASHTO, Washington DC.
Arco, D.C., Aparicio, A.C., 2001. Improving the wind stability of suspension bridges during construction. Journal of Structural Engineering 127(8), 869-875.
Argentini, T., Ozkan, E., Rocchi, D., et al., 2011. Cross-wind effects on a vehicle crossing the wake of a bridge pylon. Journal of Wind Engineering and Industrial Aerodynamics 99(6-7), 734-740.
Bai, H., 2012. Research on the Effect of Several Factors on the Wind Tunnel Test Results of Bridge and Building Structure (PhD thesis). Chang'an University, Xi'an.
Bai, H., Bai, H., 2011. Study on wind environment of Sanshui River Bridge site. In: International Conference on Photonics, 3D-Imaging, and Visualization, Guangzhou, 2011.
Bai, H., Chen, S., Wang, H., et al., 2021. Numerical simulation of flutter stability of bridge based on coupled free vibration method. Journal of Basic Science and Engineering 29(6), 1525-1534.
Bai, H., Fang, C., Li, Y., 2012a. Research on the impact of damping to the flutter derivatives of steel truss suspension bridge. Advanced Materials Research 532-533, 325-329.
Bai, H., Fang, C., Wang F., et al., 2016a. Rapid evaluation parameter of flutter stability of bridge and their application. China Journal of Highway and Transport 29(8), 92-98, 133.
Bai, H., Gao, H., Li, Y., 2014. Estimation of flutter stability of bridge by using three-component coefficients. China Journal of Highway and Transport 27(7), 68-73.
Bai, H., He, H., Liu, J., et al., 2016b. Wind characteristic param in grille turbulent flow. Journal of Vibration and Shock 35(22), 209-214.
Bai, H., Hu, Q., Hu, Z., et al., 2010a. Wind-resistance stability of a narrow steel truss girder suspension bridge. Journal of Vibration and Shock 29(4), 155-159, 187, 237.
Bai, H., Huang, S., Li, J., 2013a. Study of the aerodynamic measures impact on flutter stability of steel truss suspension bridge. In: 8th Asia-Pacific Conference on Wind Engineering, Chennai, 2013.
Bai, H., Hui, C., Liu, J., 2017. Effects of turbulence parameters on surface average wind load of rectangular structure. Journal of Architecture and Civil Engineering 34(6), 77-84. doi: 10.5582/bst.2016.01224
Bai, H., Ji, N., Xu, G., et al., 2020a. An alternative aerodynamic mitigation measure for improving bridge flutter and vortex induced vibration (VIV) stability: sealed traffic barrier. Journal of Wind Engineering and Industrial Aerodynamics 206, 104302.
Bai, H., Ji, N., Zhang, L., et al., 2019a. Influence of turbulent wind characteristic parameters on wind pressure distribution on approximate streamlined bridge surface. Journal of Highway and Transportation Research and Development 36(1), 70-77. doi: 10.3390/drones3030070
c Bai, H., Li, J., Chen, S., et al., 2016ac. Vibration Suppression Method and Device for Controlling Bridge Tower Vibration. CN105274936A. Chang'an University, Xi'an.
Bai, H., Li, J., Cui, X., et al., 2010b. Reynolds number effect of streamlined bridge section. Journal of Traffic and Transportation Engineering 10(5), 17-22.
Bai, H., Li, R., Guo, C., et al., 2020b. Optimization of aerodynamic performance of H-section hangers. Journal of Vibration and Shock 39(17), 186-193.
Bai, H., Li, Y., Li, J., et al., 2013b. Flutter stability of a steel truss girder suspension bridge. Journal of Vibration and Shock 32(4), 90-95.
Bai, H., Li, J., Liu, J., 2012b. Experimental study on wind field characteristics of Sanshui River Bridge site located in west valley region. Journal of Vibration and Shock 31(14), 74-78.
Bai, H., Li, J., Wang, L., 2010c. Field measurement of wind characteristics and numerical simulation at the site nearby western gap of valley areas. Advanced Materials Research 108-111(1), 823-827.
Bai, H., Liu, J., Hu, Q., 2010d. Research on wind resistance performance of large-span semi-arch special bridge. Journal of Zhengzhou University (Engineering Science) 31(5), 22-26.
Bai, H., Liu, B., Ji, N., et al., 2023a. Reasonable size estimation of the binary end plates of a segmental model. Journal of Vibration and Shock 42(2), 312-320.
Bai, H., Ma, T., Yang, P., et al., 2019b. Impact of ancillary facilities on Reynolds number effect of aerostatic coefficients for approximate streamlined bridge. Journal of Vibration Engineering 32(2), 340-349.
Bai, H., Wang, H., Ji, N., et al., 2022a. Influence of length-width ratio of section model on wind tunnel test and calculation analysis. China Journal of Highway and Transport 35(8), 202-212.
Bai, H., Wei, Y., Liu, B., et al., 2022b. Study on flutter stability of bridge with streamlined double-sided girder section. Journal of Highway and Transportation Research and Development 39(4), 51-62.
Bai, H., Xia, Y., Liu, J., et al., 2011. Numerical simulation for flutter stability of streamlined bridge decks. Journal of Chang'an University (Natural Science Edition) 31(3), 45-50.
Bai, H., Zhang, J., Yu, L., et al., 2023b. A Three-Way Adjustable Device for Bridge Sectional Model in PIV Wind Tunnel Test. CN116481760A. Chang'an University, Xi'an.
Baker, C.J., 1986. A simplified analysis of various types of wind induced road vehicle accidents. Journal of Wind Engineering and Industrial Aerodynamics 22(1), 69-85.
Baker, C.J., 1987. Measures to control vehicle movement at exposed sites during windy periods. Journal of Wind Engineering and Industrial Aerodynamics 25(2), 151-161.
Balzer, L.A., 1977. Atmospheric turbulence encountered by high-speed ground transport vehicles. Journal of Mechanical Engineering Science 19(5), 227-235.
Baker, C.J., Reynolds, S., 1992. Wind-induced accidents of road vehicles. Accident Analysis & Prevention 24(6), 559- 575.
Bearman, P.W., Gartshore, I.S., Maull, D.J., et al., 1987. Experiments on flow-induced vibration of a square-section cylinder. Journal of Fluids and Structures 1(1), 19-34.
Beith, J.G., 1998. A practice engineering method for the flutter analysis of long span bridges. Journal of Wind Engineering and Industrial Aerodynamics 77-78, 357-366.
Bettle, J., Holloway, A.G.L., Venart, J.E.S., 2003. A computational study of the aerodynamic forces acting on a tractor-trailer vehicle on a bridge in cross-wind. Journal of Wind Engineering and Industrial Aerodynamics 91(5), 573-592.
Bleich, F., 1949. Dynamic instability of truss-stiffened suspension bridges under wind action. Transactions of the American Society of Civil Engineers 114, 1177-1222. doi: 10.1061/taceat.0006195
Boscato, G., Dal Cin, A., 2017. Experimental and numerical evaluation of structural dynamic behavior of Rialto Bridge in Venice. Journal of Civil Structural Health Monitoring 7(4), 557-572. doi: 10.1007/s13349-017-0242-7
Buljac, A., Kozmar, H., Pospisil, S., et al., 2017. Flutter and galloping of cable-supported bridges with porous wind barriers. Journal of Wind Engineering and Industrial Aerodynamics 171, 304-318.
Cai, C., Chen, S., 2004. Framework of vehicle-bridge-wind dynamic analysis. Journal of Wind Engineering and Industrial Aerodynamics 92(7-8), 579-607.
Chang, T., 2018. The Effect of Steel Box Girder Section on Critical Flutter Speed of Suspension Bridge (master thesis). Chang'an University, Xi'an.
Chang'an University Wind Tunnel Laboratory (CUWTL), 2012. Report on the Wind-Resistant Performance of Hong Kong-Zhuhai-Macao Cable-stayed Bridge (In China). Chang'an University Wind Tunnel Laboratory, Xi'an.
Chang'an University Wind Tunnel Laboratory (CUWTL), 2017. Report on the Wind-Resistant Performance of Shenzhong Suspension Bridge (In China). Chang'an University Wind Tunnel Laboratory, Xi'an.
Chang'an University Wind Tunnel Laboratory (CUWTL), 2018. Report on the Wind Resistance of Xiamen Second East Passage Bridge and Wind Tunnel Test Study (In China). Chang'an University Wind Tunnel Laboratory, Xi'an.
Chang'an University Wind Tunnel Laboratory (CUWTL), 2020a. Report on the Wind-Resistant Performance of Humen Suspension Bridge (In China). Chang'an University Wind Tunnel Laboratory, Xi'an.
Chang'an University Wind Tunnel Laboratory (CUWTL), 2020b. Report on the Wind-Resistant Performance of Huangmaohai Cable-stayed Bridge. Chang'an University Wind Tunnel Laboratory, Xi'an.
Chang'an University Wind Tunnel Laboratory (CUWTL), 2021. Report on the Wind-Resistant Performance of Zhangjinggao Suspension Bridge (In China). Chang'an University Wind Tunnel Laboratory, Xi'an.
Chang'an University Wind Tunnel Laboratory (CUWTL), 2023. Report on the Wind-Resistant Performance of Longmen Suspension Bridge (In China). Chang'an University Wind Tunnel Laboratory, Xi'an.
Charuvisit, S., Kimura, K., Fujino, Y., 2004. Experimental and semi-analytical studies on the aerodynamic forces acting on a vehicle passing through the wake of a bridge tower in cross wind. Journal of Wind Engineering and Industrial Aerodynamics 92(9), 749-780.
Cao, T., 2024. Study on the Influence of Aerodynamic Shape on Vorticity Performance of PK Beam (master thesis). Chang’an University, Xi’an.
Che, X., 2013. Study on the Allowable Amplitude of Vortex-Induced Vibration of Free-standing Steel Tower (master thesis). Chang’an University, Xi’an.
Chen, S., 2004. Dynamic Performance of Bridges and Vehicles Under Strong Wind (PhD) thesis. Tongji University, Shanghai.
Chen, X., 2007. Improved understanding of bimodal coupled bridge flutter based on closed-form solutions. Journal of Structural Engineering 133(1), 22-31.
Chen, F., 2009. Dynamic-calculation of Bridge and Investigation of Vortex Resonance (master thesis). Chang'an University, Xi'an.
Chen, S., 2017. Calculating the Flutter Critical Wind Speed by Free Coupled Vibration Method Based on CFD (master thesis). Chang'an University, Xi'an.
Chen, M., 2022a. Effect of Grid on Aerodynamic Stability on Long-Span Pedestrian Suspension Bridges (master thesis). Chang'an University, Xi'an.
Chen, X., 2022b. Research on Wind Characteristics of Typical Canyon Terrain and its Influence on the Flow Field of Different Cross-Section Forms (master thesis). Chang'an University, Xi'an.
Chen, Z., Huang, Z., 2015. Analysis of main factors influencing allowable magnitude of vertical vortex induced vibration of long span bridges. China Journal of Highway and Transport 28(9), 30-37. doi: 10.18088/ejbmr.1.3.2015.pp30-36
Cinquemani, S., Diana, G., Fossati, L., et al., 2016. A smart structure for wind tunnel investigation of a bridge deck's vortex-induced torsional motion. Mechatronics 33, 108-120.
Coleman, S.A., Baker, C.J., 1990. High sided road vehicles in cross winds. Journal of Wind Engineering and Industrial Aerodynamics 36, 1383-1392.
Coleman, S.A., Baker, C.J., 1994. An experimental study of the aerodynamic behaviour of high sided lorries in cross winds. Journal of Wind Engineering and Industrial Aerodynamics 53(3), 401-429.
Cooper, R.K., 1984. Atmospheric turbulence with respect to moving ground vehicles. Journal of Wind Engineering and Industrial Aerodynamics 17(2), 215-238.
Corless, R.M., Parkinson, G.V., 1988. A model of the combined effects of vortex induced oscillation and galloping. Journal of Fluids and Structures 2(3), 203-220.
Corless, R.M., Parkinson, G.V., 1993. Mathematical modelling of the combined effects of vortex-induced vibration and galloping (part II). Journal of Fluids and Structures 7(8), 825-848.
Cui, X., 2012. Investigation into Influencing Factors on Wind Tunnel Test of Vortex-Induced Vibration and Mechanism (master thesis). Chang'an University, Xi'an.
Cui, W., Caracoglia, L., Zhao, L., et al., 2023. Examination of occurrence probability of vortex-induced vibration of long-span bridge decks by Fokker-Planck-Kolmogorov equation. Structural Safety 105, 102369.
Cui, X., Li, J., Chen, F., et al., 2011. Reynolds number effect on vortex resonance of streamline-like bridge deck section. Journal of Chang'an University (Natural Science Edition) 31(2), 47-51, 62.
Dang, J., 2021. The Effect of Railing Spanwise Arrangement on Vortex-Induced Vibration of Steel Box Girder with Vertical Webs (master thesis). Chang'an University, Xi'an.
Davenport, A.G., 1961. The application of statistical concepts to the wind loading of structures. Proceedings of the Institution of Civil Engineers 19(4), 449-472. doi: 10.1680/iicep.1961.11304
Davenport, A.G., 1962. The spectrum of horizontal gustiness near the ground in high winds. Quarterly Journal of the Royal Meteorological Society 88(376), 197-198. doi: 10.1002/qj.49708837618
Den Hartog, J.P., 1932. Transmission line vibration due to sleet. Transactions of the American Institute of Electrical Engineers 51(4), 1074-1076.
Deng, Z., 2020. Study on the Vortex-Induced Vibration Performance of Long-Span Bridge Cables with Lighting Fixtures. Southwest Jiaotong University, Chengdu.
Diana, G., Cheli, F., 1989. Dynamic interaction of railway systems with large bridges. Vehicle System Dynamics 18(1-3), 71-106. doi: 10.1080/00423118908968915
Ding, Q., Chen, A., Xiang, H., 2001. Modified least-square method for identification of bridge deck aerodynamic derivatives. Journal of Tongji University (Natural Science) 29(1), 25-29, 23.
Ding, Q., Chen, A., Xiang, H., 2003. Automatic analysis for multimode coupled flutter of long span bridge. China Civil Engineering Journal 35(4), 52-58.
Dong, S., 2023. Effect of L-Shaped Corridor Frame on Vortex-Induced Vibration Performance of Pedestrian Bridges (master thesis). Chang'an University, Xi'an.
Duc, P., Hiroshi, K., Wang, J., et al., 2023. A study on stabilizing mechanism of flap countermeasures mitigating VIV of a box girder bridge section. IOP Conference Series: Materials Science and Engineering 1289(1), 12008.
Dung, N.N., Miyata T., Yamada H., et al., 1998. Flutter responses in long span bridges with wind induced displacement by the mode tracing method. Journal of Wind Engineering and Industrial Aerodynamics 77-78, 367-379.
Fang, C., 2015. The Long-Span Bridge Aerodynamic Stability Evaluation and Application Based on the Static Aerodynamic (master thesis). Chang'an University, Xi'an.
Farhangdoust, S., Eghbali, P., Younesian, D., 2020. Bistable tuned mass damper for suppressing the vortex induced vibrations in suspension bridges. Earthquakes and Structures 18(3), 313-320.
Feng, Y., Hao, J., Han, W., et al., 2022. An optimized numerical tornado simulator and its application to transient wind-induced response of a long-span bridge. Journal of Wind Engineering and Industrial Aerodynamics 227, 105072.
Feng, Y., Hao, J., Wang, F., et al., 2023a. Analysis of transient wind-induced response of long-span bridge under nonstationary wind field. Journal of Jilin University (Engineering and Technology Edition) 53(6), 1638-1649. doi: 10.1177/10870547231197206
Feng, Y., Su, Q., Hao, J., et al., 2023c. A comparative study on the transient wind-induced response of long-span bridges subject to downbursts and typhoons. Engineering Structures 280, 115649.
Fujiwara, A., Kataoka, H., Ito, M., 1993. Numerical simulation of flow-field around an oscillating bridge using finite-difference method. Journal of Wind Engineering and Industrial Aerodynamics 46-47, 567-575.
Gao, H., 2012. The Association Study of the Static Aerodynamic Coefficient and the Flutter Stability (master thesis). Chang'an University, Xi'an.
Gai, X., 2019. Method for Determining the Critical Wind Speed of Long-Span Suspension Bridges under Post Flutter (master thesis). Chang'an University, Xi'an.
Gao, X., 2022. Measurement of Wind Param in Mountainous Area and its Effect on Static Wind Load of π-beam (master thesis). Chang'an University, Xi'an.
Gao, L., Bai, H., Liu, J., et al., 2018a. Field measurement analysis of wind characteristics of the typical complex terrain conditions in the west area. Journal of Xi'an University of Technology 34(1), 61-67. doi: 10.3390/robotics7040061
Gao, L., Cui, X., Bai, H., et al., 2017. Comparative analysis of the three ways used to study the characters of strong wind in inland China. Journal of Xi'an University of Technology 33(1), 41-45. doi: 10.5582/bst.2016.01266
Gao, L., Liu, J., Guo, W., 2012. Experimental study of three-components forces coefficients of bridge deck section. Journal of Zhengzhou University (Engineering Science) 33(2), 67-71.
Gao, H., Wang, F., Guan, Q., et al., 2022a. Research on the flutter stability of bridge sections based on an empirical formula of an aerostatic three-component coefficient. Buildings 12(8), 1212. doi: 10.3390/buildings12081212
Gao, G., Wei, L., Ma, T., et al., 2023. Influence of Scruton number on wind-induced vibration of H-section with a small side ratio under large wind angles of attack. Journal of Vibration Engineering 36(2), 311-318.
Gao, G., Wei, L., Ma, T., et al., 2022b. Effect of Scruton number on wind-induced vibration of H-section with a small side ratio under large wind angles of attack. Journal of Vibration Engineering 36(2), 311-318. doi: 10.3390/molecules27010311
Gao, G., Wei, L., Yan, Q., et al., 2021a. A Test Device for Wind Tunnel Bracket to Ensure the Two-Dimensional Flow Characteristics of Sectional Model. CN113063561B. Chang'an University, Xi'an.
Gao, X., Xiao, T., Li, J., et al., 2021b. Study on wind field characteristics in a coastal plain based on a new three-dimensional joint distribution model. Applied Sciences 11(19), 9114. doi: 10.3390/app11199114
Gao, G., Yao, B., Li, J., et al., 2021c. A Wind Tunnel Experimental Device for Three-Degree-Of-Freedom Coupled Vibration at High Wind Angle of Attack. CN112161774B. Chang'an University, Xi'an.
Gao, G., Zhu, L., 2016. Measurement and verification of unsteady galloping force on a rectangular 2:1 cylinder. Journal of Wind Engineering and Industrial Aerodynamics 157, 76-94.
Gao, G., Zhu, L., 2017. Nonlinear mathematical model of unsteady galloping force on a rectangular 2:1 cylinder. Journal of Fluids and Structures 70, 47-71.
Gao, G., Zhu, L., Han, W., et al., 2018b. Nonlinear post-flutter behavior and self-excited force model of a twin-side-girder bridge deck. Journal of Wind Engineering and Industrial Aerodynamics 177, 227-241.
Gao, G., Zhu, L., Li, J., et al., 2020a. Application of a new empirical model of nonlinear self-excited force to torsional vortex-induced vibration and nonlinear flutter of bluff bridge sections. Journal of Wind Engineering and Industrial Aerodynamics 205, 104313.
Gao, G., Zhu, L., Li, J., et al., 2020b. Modelling nonlinear aerodynamic damping during transverse aerodynamic instabilities for slender rectangular prisms with typical side ratios. Journal of Wind Engineering and Industrial Aerodynamics 197, 104064.
Gao, G., Zhu, L., Li, J., et al., 2020c. A novel two-degree-of-freedom model of nonlinear self-excited force for coupled flutter instability of bridge decks. Journal of Sound and Vibration 480, 115406.
Gao G, Zhu L, Wang F, et al., 2020c. Experimental investigation on the non-linear coupled flutter motion of a typical flat closed-box bridge deck. Sensors. 20(2): 568. doi: 10.3390/s20020568
Gao, G., Zhu, L., Wu, H., et al., 2019. Aerodynamic nonlinearities of coupled soft flutter of a flat closed-box bridge section. China Journal of Highway and Transport 32(10), 125-134.
Ge, Y., Lin, Z., Cao, F., et al., 2002. Investigation and prevention of deck galloping oscillation with computational and experimental techniques. Journal of Wind Engineering and Industrial Aerodynamics 90(12-15), 2087-2098.
Ge, Y., Xiang, H., 2001. Probabilistic assessment study of flutter instability of bridge structures. Journal of Tongji University (Natural Science) 29(1), 70-74.
Ge, Y., Zhao, L., Cao, J., 2022. Case study of vortex-induced vibration and mitigation mechanism for a long-span suspension bridge. Journal of Wind Engineering and Industrial Aerodynamics 220, 104866.
Gu, M., Xiang, H., 1991. Galloping responses of cable-stayed bridge pylons. Acta Aerodynamica Sinica 9(4), 488-494.
Guan, Q., 2016. Research on Wind-Induced Instability of Long-Span Girder Suspension Footbridge (PhD thesis). Chang'an University, Xi'an.
Guan, Q., Li, J., Hu, Z., et al., 2014. Effects of railings on vortex-induced vibration of a bridge deck section. Journal of Vibration and Shock 33(3), 150-156.
Guan, Q., Li, J., Liu, J., 2013. Investigation into formation of two lock-in districts of vertical vortex-induced vibration of a box bridge deck section. Journal of Chang'an University (Natural Sciences) 33(4), 40-46.
Guo, W., 2013. Numerical Method Research on Safety Countermeasures of Vehicle Driving in Lateral Wind on Highway Bridges (master thesis). Chang'an University, Xi'an.
Guo, C., 2019. Investigation on Aerodynamic Measures for Coupled Flutter of a Flat Steel Box Girder Based on System Energy Characteristics (master thesis). Chang'an University, Xi'an.
Han, W., Chen, A., 2008a. Influence of installation of central stabilized plate on wind resistance performance of long span suspension bridge. World Bridges 2008(1), 42-45.
Han, W., Chen, A., 2008b. Ride comfort assessment of vehicles running on long-span cable-stayed bridge under crosswind. China Journal of Highway and Transport 2008(2), 54-60.
Han, W., Liu, X., Guo, X., et al., 2022. Research status and prospect of wind-vehicle-bridge coupling vibration system. Journal of Traffic and Transportation Engineering (English Edition) 9(2), 319-338.
Hao, H., 2010. The Galloping Phenomenon and its Control of Bridge Structure (master thesis). Chang'an University, Xi'an.
Hao, J., Feng, Y., Su, Q., et al., 2022. Analysis and simulation of non-stationary typhoon field on long span bridge. Journal of Chang'an University (Natural Science Edition) 42(6), 66-76.
Hao, X., Shu, P., Hao, J., 2020. Static wind stability of long-span asymmetric suspension bridge. Journal of Chongqing Jiaotong University (Natural Science) 39(12), 53-59.
Hao, J., Wu, T., 2018. Downburst-induced transient response of a long-span bridge: a CFD-CSD-based hybrid approach. Journal of Wind Engineering and Industrial Aerodynamics 179, 273-286.
Hao, J., Wu, T., 2020. Numerical analysis of a long-span bridge response to tornado-like winds. Wind and Structures 31(5), 459-472.
Hao, J., Zhao, S., Xin, L., et al., 2024. Study on wind characteristics of bridge sites in coastal areas of Guangdong Province based on measured data. Journal of Vibration Engineering 9(4), 1-9.
He, Y., 2015. Long-span Bridges in Ice Type and Aerodynamic Characteristics Research (master thesis). Chang'an University, Xi'an.
He, R., 2022. Characteristic Analysis of Double Lock-In Regions and Overlapping Region for VIV of π-shaped Deck (master thesis). Chang'an University, Xi'an.
He, H., Liu, J., 2010. Study on wind-resistant measures and their optimization for long-span and slender suspension bridge. Journal of Highway and Transportation Research and Development 27(3), 93-97, 102. doi: 10.1007/s11465-009-0083-0
He, Y., Song, J., Yang, Y., 2007. Comparative study on wind resistance of self-supporting pylons. Structural Engineers 23(6), 49-55. doi: 10.1061/40932(246)9
He, H., Wang, J., Wang, F., 2024. Investigation of the effects of vortex isolation plates with different opening ratios and sizes on vortex-induced vibration. Applied Sciences14(9), 3863. doi: 10.3390/app14093863
Hong, G., 2012. Identifying Long-Span Bridge Flutter Derivatives via the Free Vibration Method Based on the Fluent Software (master thesis). Chang'an University, Xi'an.
Hong, G., Li, J., Wang, J., et al., 2023. Flutter performance of a suspended double-deck flat box girder based on a wind tunnel test and numerical simulation. Journal of Vibration and Shock 42(4), 236-246.
Hou, L., 2012. Study of Aerostatic Stability for Long-Span Cable Supported Bridge (master thesis). Chang'an University, Xi'an.
Hu, P., Han, Y., Cai, C., et al., 2019. New analytical models for power spectral density and coherence function of wind turbulence relative to a moving vehicle under crosswinds. Journal of Wind Engineering and Industrial Aerodynamics 188, 384-396.
Hua, X., Wang, C., Li, S., et al., 2020. Experimental investigation of wind-induced vibrations of main cables for suspension bridges in construction phases. Journal of Fluids and Structures 93, 102846.
Huang, L., Liao, H., 2011. Identification of flutter derivatives of bridge deck under multi-frequency vibration. Engineering Applications of Computational Fluid Mechanics 5(1), 16-25. doi: 10.1080/19942060.2011.11015349
Hui, C., 2018. Characteristics of Measured Wind Field in Western Valley and its Effect on Bridge Buffeting (master thesis). Chang'an University, Xi'an.
Huo, W., 2020. Influence of Beam Spacing and Wind Attacking Angle on Vortex-Induced Vibration Performance and Flow Field Characteristics of Double-Layer Box Girder (master thesis). Chang'an University, Xi'an.
Ibrahim, S.R., Mikulcik, E.C., 1977. A method for the direct identification of vibration param from the free response. The Shock & Vibration Bulletin 47(4), 183-198.
Ito, M., Kawada, T., 2002. The Prelude to the Construction of Ultra-long Bridges: New Challenges for Engineers. People's Transportation Publishing House, Beijing.
Jain, A., Jones, N.P., Scanlan, R.H., 1996. Coupled flutter and buffeting analysis of long-span bridges. Journal of Engineering Mechanics 122(7), 716-725.
Jeong, U.Y., Kwon, S.D., 2003. Sequential numerical procedures for predicting flutter velocity of bridge sections. Journal of Wind Engineering and Industrial Aerodynamics 91(1-2), 291-305.
Ji, K., 2010. The Influence of Bridge Wind Vibration Caused by the Damping and the Calculation of the Composite Damping Ratio (master thesis). Chang'an University, Xi'an.
Jia, N., 2008. Test Research and Fine Analysis on the Wind-Resistant and Vibration-Control Performance of Suspension Catwalk (master thesis). Chang'an University, Xi'an.
Kang, G., 2011. The Analysis of Flutter Performance of Truss Suspension Bridge (master thesis). Chang'an University, Xi'an.
Kang, F., Guo, F., Wang, J., et al., 2023. Wind fairing effect on vortex-induced vibration of streamline steel box deck by wind tunnel test and CFD. Structural Engineers 39(1), 141-147.
Kim, S.J., Kim, H.K., Calmer, R., et al., 2013. Operational field monitoring of interactive vortex-induced vibrations between two parallel cable-stayed bridges. Journal of Wind Engineering and Industrial Aerodynamics 123, 143-154.
Krajnović, S., Ringqvist, P., Basara, B., 2012. Comparison of partially averaged Navier-Stokes and large-eddy simulations of the flow around a cuboid influenced by crosswind. Journal of Fluids Engineering 134(10), 101202.
Kozmar, H., Procino, L., Borsani, A., et al., 2012. Sheltering efficiency of wind barriers on bridges. Journal of Wind Engineering and Industrial Aerodynamics 107, 274-284.
Kozmar, H., Procino, L., Borsani, A., et al., 2014. Optimizing height and porosity of roadway wind barriers of viaducts and bridges. Engineering Structures 81, 49-61.
Kubo, Y., Modi, V.J., Kotsubo, C., et al., 1996. Suppression of wind-induced vibrations of tall structures through moving surface boundary-layer control. Journal of Wind Engineering and Industrial Aerodynamics 61(2-3), 181-194.
Kumarasena, S., Jones, N.P., Irwin, P., et al., 2007. Wind-induced Vibration of Stay Cables. Federal Highway Administration, McLean.
Kwon, S.D., Kim, D.H., Lee, S.H., et al., 2011. Design criteria of wind barriers for traffic. Part 1: wind barrier performance. Wind and Structures 14(1), 55. doi: 10.12989/was.2011.14.1.055
Laima, S., Li, H., 2015. Effects of gap width on flow motions around twin-box girders and vortex-induced vibrations. Journal of Wind Engineering and Industrial Aerodynamics 139, 37-49.
Laima, S., Li, H., Chen, W., et al., 2013. Investigation and control of vortex-induced vibration of twin box girders. Journal of Fluids and Structures 39(3), 205-221.
Larsen, A., Gimsing, N.J., 1992. Wind engineering aspects of the east bridge tender project. Journal of Wind Engineering and Industrial Aerodynamics 42(1-3), 1405-1416.
Larsen, A., Walther, J.H., 1997. Aeroelastic analysis of bridge girder sections based on discrete vortex simulations. Journal of Wind Engineering and Industrial Aerodynamics 67-68, 253-265.
Li, L., 2007. Study on the Vibration-Absorbing Measures and the Trial Inspection of Vortex Resonance of Suspension Bridge's Catwalk (master thesis). Chang'an University, Xi'an.
Li, Y., 2018. Prediction of Flutter Derivatives for π Type Sections by Neural Networks Based on CFD (master thesis). Chang'an University, Xi'an.
Li, R., 2019. Study on Aerodynamic Measures and Vortex-Induced Vibration Performance of Cable-stayed Bridge with π Section. Chang'an University, Xi'an.
Li, J., Che, X., Gao, F., et al., 2012a. Effects of wind-resistant control measures against flutter instability of a narrow suspension bridge. Journal of Vibration and Shock 31(23), 77-81, 86. doi: 10.1111/j.1756-1051.2011.01185.x
Li, C., Chen, M., Chen, S., et al., 2021a. Stability of nonlinear static wind response for a long span suspension bridge after icing. Journal of Lanzhou University: Natural Science 57(1), 129-136.
Li, Y., Chen, Z., Dong, S., et al., 2021b. Study on the effects of pedestrians on the aerostatic response of a long-span pedestrian suspension bridge. KSCE Journal of Civil Engineering 25(10), 3866-3878. doi: 10.1007/s12205-021-2127-x
Li, J., Cui, X., Zhang, H., et al., 2009a. Influence of surface roughness on Reynolds number effects. Journal of Chang'an University (Natural Science Edition) 29(2), 56-59, 64.
Li, J., Dang, J., Wu, T., et al., 2021c. Radial basis function networks used in prediction of vortex-induced vibration of π-shape bridge-decks. Journal of Vibration Engineering 34(1), 1-8.
Li, Y., Dong, S., Wang, J., et al., 2023a. Effect of corridor frame on vortex-induced vibration performance of pedestrian rigid frame bridge. Journal of Hohai University (Natural Sciences) 51, 87-96.
Li, Y., Dong, S., Zang, Y., et al., 2012b. Coupling vibration of wind-vehicle-bridge system for long-span road-rail suspension bridge and resistant-wind criterion of running train. Engineering Mechanics 29(12), 114-120. doi: 10.1186/1743-422X-9-114
Li, Y., Feng, P., Li, J., et al., 2024. Aeroelastic model wind tunnel test and equivalent static wind load for superhigh bridge tower. Journal of Architecture and Civil Engineering 41(2), 96-105.
Li, J., Hong, G., Wang J., et al., 2022a. Wind-induced vibration performance of suspended double-deck closed box girder bridge deck. Journal of Traffic and Transportation Engineering 22(6), 207-219.
Li, W., Hu, Z., Li, J., 2010a. Reynolds number effect of three component coefficients in bridge deck using computational fluid dynamics (CFD). Journal of Chang'an University (Natural Science Edition) 30(6), 44-49. doi: 10.25011/cim.v33i1.11837
Li, J., Huo, W., Zhang, Y., et al., 2020a. Study of vortex-induced vibration performance and three-component coefficients change of cable-stayed bridge with double deck type girder. Highway 65, 78-83.
Li, Y., Li, C., 2020. Experimental investigations on the flutter derivatives of the pedestrian-bridge section models. KSCE Journal of Civil Engineering 24(11), 3416-3434. doi: 10.1007/s12205-020-0243-7
Li, Y., Li, C., Liang, Y., et al., 2022b. Fast prediction of the flutter critical wind speed of streamlined box girders by using aerostatic force coefficients and artificial neural networks. Journal of Wind Engineering and Industrial Aerodynamics 222, 104939.
Li, Y., Li, J., Liu, B., et al., 2013. Analysis of nonlinear aerostatic response for catwalk of Lishui suspension bridge. Journal of Architecture and Civil Engineering 30(1), 60-65. doi: 10.3901/JME.2013.06.060
Li, Y., Liao, H., Li, J., et al., 2012c. Vortex-induced-vibration-based aerodynamic optimization and galloping characteristics of steel pylon in long span cable-stayed bridge by wind tunnel test. Journal of Experiments in Fluid Mechanics 26(1), 50-54.
Li, J., Pan, H., Gao, G., et al., 2021d. Experimental study on aerodynamic measures for flutter of flat steel box girder. Journal of Highway and Transportation Research and Development 38(1), 69-78.
Li, J., Shen, Z., Xing, S., et al., 2020b. Buffeting response of a free-standing bridge pylon in a trumpet-shaped mountain pass. Wind and Structures 30(1), 85-97.
Li, M., Sun, Y., Liao, H., et al., 2020c. Vortex-induced vibration of steel box girder with large projecting slab and its mitigation countermeasures for Hong Kong-Zhuhai-Macao Bridge. Journal of Tsinghua University 60(1), 57-65.
Li, Y., Wang, J., Fan, L., et al., 2023b. Effect of static distributed pedestrians on the aerodynamic param of a long-span pedestrian suspension bridge. Journal of Hunan University (Natural Sciences) 50(5), 74-84.
Li, J., Wang, L., Huo, W., 2022c. Influence of deck spacings on vortex-induced vibration characteristics of double-layer decks witch steel box girders. Journal of Chang'an University (Natural Sciences) 42(2), 43-55. doi: 10.1117/12.2656017
Li, Y., Wang, T., Liao, H., 2010b. Investigation on wake galloping of parallel cables in cable-stayed bridge by wind tunnel test. Engineering Mechanics 27(S1), 216-221, 227.
Li, S., Wang, C., Wang, D., 2015. Galloping performance of large-scale spire type main cable of suspension bridge during construction. Journal of Vibration and Shock 34(22).
Li, J., Wang, X., Zhang, Y., et al., 2014. Chaos characteristics of wind induced vibrations for bridge. Journal of Traffic and Transportation Engineering 14(3), 34-42.
Li, J., Wang, J., Zhao, X., et al., 2022d. Influence of initial conditions on wind characteristics at a bridge middle span in a U-shaped valley by CFD and AHP. Applied Sciences 12(9), 4693. doi: 10.3390/app12094693
Li, C., Wang, L., 2004. An immersed boundary finite difference method for LES of flow around bluff shapes. International Journal for Numerical Methods in Fluids 46(1), 85-107.
Li, X., Xiao, J., Liu, D., et al., 2017a. An analytical model for the fluctuating wind velocity spectra of a moving vehicle. Journal of Wind Engineering and Industrial Aerodynamics 164, 34-43.
Li, J., Xing, S., Li, Y., et al., 2023c. Flutter characteristics of bridges under non-uniform wind speed. Structures 53, 1-11.
Li, J., Zhang, H., Han, W., 2009b. Wind-induced response of cable-stayed bridge with consideration of Reynolds number effect. China Journal of Highway and Transport 22(2), 42-47.
Li, J., Zhang, F., Wu, T., 2017b. Weighted least square method for identification of flutter derivatives of bridge section. Journal of Vibration Engineering 30(6), 993-1000.
Li, J., Zhou, J., 2009. Reynolds number effect of model surface pressure coefficient under vortex-excited vibration. In: 14th National Structural Wind Engineering Academic Conference, Beijing, 2009.
Li, J., Zhu, C., 2021. Study on flow field characteristics around separated twin-box girder based on surface wind pressure analysis. Journal of Architecture and Civil Engineering 38, 69-78.
Liao, H., Ma, C., Li, M., et al., 2020. Wind resistance of the Hong Kong-Zhuhai-Macao bridge. Journal of Tsinghua University 60(1), 41-47.
Lin, Y., 1979. Motion of suspension bridges in turbulent winds. Journal of Engineering Mechanics 105(6), 921-932. doi: 10.1061/jmcea3.0002554
Lin, H., Hou, B., Wang, H., et al., 2023. Research on vortex-induced vibration characteristics and its control of long suspenders of super-long-span suspension bridge. Highway 6, 58-64.
Lin, Y., Yang, J., 1983. Multimode bridge response to wind excitations. Journal of Engineering Mechanics 114(12), 2055-2071.
Liu, Y., 2007. The Study on the Characteristics of Wind Field of Yumenkou Yellow River Highway Bridge (master thesis). Chang'an University, Xi'an.
Liu, Y., 2020. Study on Measured Wind Field Characteristics and Study on Buffeting for Long Span Suspension Bridges (master thesis). Chang'an University, Xi'an.
Liu, B., 2023a. Wind-induced Vibration Response of Flexible Aerodynamic Measures and its Application (master thesis). Chang'an University, Xi'an.
Liu, S., 2023b. Influences of Grid Plates on Vortex-Induced Vibration Performance of Separated Wide Twin Box Girders (master thesis). Chang'an University, Xi'an.
Liu, J., Bao, W., 2003. Wind-induced vibration control of main towers. Highway 2, 39-42.
Liu, J., Cui, X., 2010. Surface pressure distribution and Reynolds number effect of Strouhal number on bridge section. Vibration and Shock 29, 146-149.
Liu, L., Guan, Q., Li, J., et al., 2020. Study on flutter mechanism and identification of flutter derivatives based on energy equivalence. Acta Aerodynamica Sinica 38(2), 224-231.
Liu, J., Li, J., 2005. Study of wind project of bridge in western area of China. Journal of Architecture and Civil Engineering 22(4), 32-39.
Liu, W., Liu, J., Hu, Z., 2000. The experiment study of vicious shear damper used in the cable-stayed bridge. Journal of Xi'an Highway University 2000(3), 41-44. doi: 10.3901/JME.2000.04.041
Lu, B., Chen, Z., Wang, X., 2014. Reynolds number effect of large-scale model in natural wind. Journal of Chang'an University (Natural Science Edition) 34(6), 85-90.
Luo, Y., 2008. Theoretical and Experiment Study on Identification of Aerodynamic Derivatives of Bridge Decks (PhD thesis). Hunan University, Changsha.
Luo, S., 2024. Vortex Vibration Characteristics of L-Shaped Nozzle Steel Box Girder (master thesis). Chang'an University, Xi'an.
Lyu, S., 2024. Study on Eddy Vibration Characteristics and Mechanism of Rail-Rail Parallel P-K Main Beam (master thesis). Chang'an University, Xi'an.
Ma, L., 2008. Spatial Coupling Vibration Research of Wind-Car-Bridge System Considering Driver Behavior (master thesis). Chang'an University, Xi'an.
Ma, T., 2019. Influence of Mass and Damping Param and Turbulence on Galloping and Vortex-Induced Vibration of H-Shape Hanger (master thesis). Chang'an University, Xi'an.
Ma, Z., Li, J., Zhao, G., et al., 2024. Evolution characteristics of different components of aerodynamics during vertical vortex-induced vibration of π-shaped girder. Journal of Hunan University (Natural Sciences) 51, 132-142.
Ma, C., Liu, Y., Yeung, N., et al., 2018. An experimental study of the across-wind aerodynamic behavior of a bridge tower. Journal of Bridge Engineering 24(2), 4018116.
Mannini, C., Massai, T., Marra, A.M., et al., 2017. Interference of vortex-induced vibration and galloping: experiments and mathematical modelling. Procedia Engineering 2017, 3133-3138.
Mannini, C., Massai, T., Marra, A.M., 2018. Modeling the interference of vortex-induced vibration and galloping for a slender rectangular prism. Journal of Sound and Vibration 419, 493-509.
Matsuda, K., Kato, K., Tamai, Y., et al., 2015. Experimental study on aerodynamic vibrations of a bracing member with a rectangular cross section of the long-spanned truss bridge. In: 14th International Conference on Wind Engineering (ICWE14), Portal Alegre, 2015.
Matsumoto, M., Yoshizumi, F., Yabutani, T., 1999. Flutter stabilization and heaving-branch flutter. Journal of Wind Engineering and Industrial Aerodynamics 83(1), 289-299.
Ministry of Transport of the People's Republic of China, 2018. Wind-resistant Design Specification for Highway Bridges. JTG/T 3360-01-2018. Ministry of transport of the People's Republic of China, Beijing.
Miyata, T., Yamada, H., 1990. Coupled flutter estimate of a suspension bridge. Journal of Wind Engineering and Industrial Aerodynamics 33(1-2), 341-348.
Namini, A., Albrecht, P., Bosch, R., 1992. Finite element-based flutter analysis of cable-suspended bridges. Journal of Structural Engineering 118(6), 1509-1526.
Nguyen, C.H., Freda, A., Solari, G., et al., 2015. Experimental investigation of the aeroelastic behavior of a complex prismatic element. Wind and Structures 20(5), 683-699. doi: 10.12989/was.2015.20.5.683
Novak, M., 1972. Galloping oscillations of prismatic structures. Journal of Engineering Mechanics Division 98 (EM1), 27-46. doi: 10.1061/jmcea3.0001575
Paidoussis, M.P., Price, S.J., De Langre, E., 2010. Fluid-structure Interactions: Cross-Flow-Induced Instabilities. Cambridge University Press, Cambridge.
Pan, H., 2021. Study on the Characteristics of Double Lock-In Region for Vortex-Induced Vibration of π-shaped Beam (master thesis). Chang'an University, Xi'an.
Parkinson, G.V., Smith, J.D., 1964. The square prism as an aeroelastic nonlinear oscillator. The Quaterly Journal of Mechanics & Applied Mathematics 17, 225-239. doi: 10.1093/qjmam/17.2.225
Parkinson, G.V., Wawzonek, M.A., 1981. Some considerations of combined effects of galloping and vortex resonance. Journal of Wind Engineering and Industrial Aerodynamics 8 (1-2), 135-143.
Premoli, A., Rocchi, D., Schito, P., et al., 2015. Ballast flight under high-speed trains: wind tunnel full-scale experimental tests. Journal of Wind Engineering and Industrial Aerodynamics 145, 351-361.
Qiao X., 2022. Vortex-induced Vibration Response Prediction of π-shaped Section Girders Based on Machine Learning (master thesis). Chang'an University, Xi'an.
Qiu, C., 2023. The Effect of Exponential Decay Coefficient on Buffeting Response of Super Span Suspension Bridges (master thesis). Chang'an University, Xi'an.
Qu, D., 2015. The Pneumatic Selection of π-section Based on the Numerical Simulation (master thesis). Chang'an University, Xi'an.
Russo, S., 2016. Integrated assessment of monumental structures through ambient vibrations and ND tests: the case of Rialto Bridge. Journal of Cultural Heritage 19, 402-414.
Sarkar, P., Jones, N., Scanlan, R.H., 1994. Identification of aeroelastic param of flexible bridges. Journal of Engineering Mechanics 120(8), 1718-1742.
Scanlan, R.H., Budlong, K., Beliveau, J.G., 1974. Indicial aerodynamic functions for bridges decks. Journal of Sanitary Engineering Division 100, 657-672. doi: 10.1061/jmcea3.0001912
Scanlan, R.H., Tomko, J.J., 1971. Airfoil and bridge deck flutter derivatives. Journal of the Engineering Mechanics Division 97(6), https://doi.org/10.1061/JMCEA3.0001526.
Shen, Z., 2021. Study on Buffeting of the II Type Main Girder Cable-stayed Bridge in a Trumpet-Shaped Mountain Pass (PhD thesis). Chang'an University, Xi'an.
Shen, Z., Li, J., Li, R., et al., 2021. Nonuniform wind characteristics and buffeting response of a composite cable-stayed bridge in a trumpet-shaped mountain pass. Journal of Wind Engineering and Industrial Aerodynamics 217, 104730.
Shi, Z., 2023. Study on the Influence of Characteristic Size of Inverted L-Shaped Deflector on Vortex-Induced Vibration Performance of Twin-Box Girder (master thesis). Chang'an University, Xi'an.
Shu, P., 2021. Flutter Stability Analysis of Long Span Asymmetric Suspension Bridge Based on CFD Numerical Simulation (master thesis). Chang'an University, Xi'an.
Shu, X., Zhu, L., 2014 Analysis of fatigue damage of cable-stayed cable by vortex-induced rosonance of main beam under the action of monsoon. In: 23rd National Conference of Structural Engineering, Lanzhou, 2014.
Simiu, E., Scanlan, R.H., 1992. Wind Effects on Structures: an Introduction to Wind Engineering. Tongji University Press, Shanghai.
Smith, J.A., 1998. Evolution of Langmuir circulation during a storm. Journal of Geophysical Research: Oceans 103(C6), 12649-12668.
Song, T., 2020. Research on Correlation Characteristics of Vortex Induced Vibration of Variable Cross-Section Steel Box Girder Bridge (master thesis). Chang'an University, Xi'an.
Song, J., 2021. Study on Wind Characteristics and Aerostatic Performance of Pedestrian Suspension Bridge in the Mountainous Valleys (PhD thesis). Chang'an University, Xi'an.
Song, J., Li, J., Flay, R.G.J., 2020. Field measurements and wind tunnel investigation of wind characteristics at a bridge site in a Y-shaped valley. Journal of Wind Engineering and Industrial Aerodynamics 202, 104199.
Song, J., Li, J, Flay, R.G.J., et al., 2023. Validation and application of pressure-driven RANS approach for wind parameter predictions in mountainous terrain. Journal of Wind Engineering and Industrial Aerodynamics 240, 105483.
Song, J., Li, J., Xu, R., et al., 2022. Field measurements and CFD simulations of wind characteristics at the Yellow River bridge site in a converging-channel terrain. Engineering Applications of Computational Fluid Mechanics 16(1), 58-72. doi: 10.1080/19942060.2021.2004240
Su, Y., Li, Y., Xiang, H., et al., 2016. Multi-objective optimization of wind screen height for high-speed railway bridges based on NSGA-Ⅱ and DEA hybrid algorithm. Journal of Engineering Mechanics 33, 138-145. doi: 10.1159/000446893
Sun, L., 2012. The Numerical Simulation of Wind Param on Typical Wind Area Based on FLUENT (master thesis). Chang'an University, Xi'an.
Tadeu, A., da Silva, F.M., Ramezani, B., et al., 2022. Experimental and numerical evaluation of the wind load on the 516 Arouca pedestrian suspension bridge. Journal of Wind Engineering and Industrial Aerodynamics 220, 104837.
Tamura, T., Itoh, Y., 1999. Unstable aerodynamic phenomena of a rectangular cylinder with critical section. Journal of wind Engineering and industrial Aerodynamics 83(1-3), 121-133.
Tamura, Y., Shimada, K., 1987. A mathematical model for the transverse oscillations of square cylinders. In: International Conference on Flow Induced Vibrations, London, 1987.
Taylor, I.J., Vezza, M., 2009. A numerical investigation into the aerodynamic characteristics and aeroelastic stability of a footbridge. Journal of Fluids and Structures 25(1), 155-177. doi: 10.1007/978-1-84800-123-7_9
Teng, Z., 2024. Influence of Inverted L-Shaped Deflectors on the Flutter Performance of Straight Web Box Girder (master thesis). Chang'an University, Xi'an.
Theodorsen, T., 1935. General theory of aerodynamic instability and mechanism of flutter. NACA Report 6(97), 1171-1737.
Wang, F., 2014. The Study of the Vortex Resonance Characteristic on Typical Blunt Girder Cross-Section (master thesis). Chang'an University, Xi'an.
Wang, F., 2018. Study on the Flow Field Characteristics of the π Shape Bridge Based on CFD Technology (master thesis). Chang'an University, Xi'an.
Wang, G., 2019. Effects of Vibration Regime on Flow Field Characteristics of Twin-Box Girder (master thesis). Chang'an University, Xi'an.
Wang, Y., 2020. Experiment and Mechanism Research on Vortex Vibration Suppression of Double Side Box Type π Section (master thesis). Chang'an University, Xi'an.
Wang, Z., 2021. Effect of Geometric Param of Wind Fairing on Vortex-Induced Vibration of π-section (master thesis). Chang'an University, Xi'an.
Wang, L., 2022a. Influence of Inverted L-Shaped Deflector on Vortex-Induced Vibration Characteristics of Closed Steel Box Girders (master thesis). Chang'an University, Xi'an.
Wang, J., 2022b. Wind Spatial Distribution Characteristics in the U-Shaped Valley and its Effect on Buffeting Response of Long-Span Bridges (PhD thesis). Chang'an University, Xi'an.
Wang, Z., 2022c. Application of Viscous Vortex Domain Method in Vortex Induced Vibration of Bridge Tower (master thesis). Chang'an University, Xi'an.
Wang, F., Chen, X., He, R., et al., 2021a. Wind characteristics in mountainous valleys obtained through field measurement. Applied Sciences 11(16), 7717. doi: 10.3390/app11167717
Wang, F., He, H., Bai, H., et al., 2020a. Wind parameter characteristics of a bridge located in the gorge area. Journal of Nanjing Tech University (Natural Science Edition) 42(3), 351-357.
Wang, J., Li, Y., Liu, J., et al., 2012. Nonlinear aerostatic response of catwalk of suspension bridge. Journal of Highway and Transportation Research and Development 7(2), 40-45.
Wang, J., Li, J., Wang, F., et al., 2021b. Research on wind field characteristics measured by lidar in a U-shaped valley at a bridge site. Applied Sciences 11(20), 9645. doi: 10.3390/app11209645
Wang, F., Wang, J., Wang, Z., et al., 2023. Experimental study on wind load of flat uniaxial photovoltaic panels with large aspect ratio. Journal of Hunan University (Natural Sciences) 50(7), 130-139.
Wang, F., Xiong, C., Wang, Z., et al., 2020b. A quick assessment and optimization method for a flutter aerodynamic measure of a typical flat box girder. Shock and Vibration 2020(4), 1-11.
Wang, Z., Zhang, Z., Wu, C., et al., 2021c. Experimental and numerical investigations on flutter of π-shaped side-girders. Journal of Vibration Engineering 34(2), 301-310.
Wang, F., Zheng, X., Hao, J., et al., 2020c. Numerical analysis of the flow around two square cylinders in a tandem arrangement with different spacing ratios based on POD and DMD methods. Processes 8(8), 903. doi: 10.3390/pr8080903
Washizu, K., Ohya, A., Otsuki, Y., et al., 1978. Aeroelastic instability of rectangular cylinders in a heaving mode. Journal of Sound and Vibration 59(2), 195-210.
Wei, Y., 2022. Effect of Gap-width and Maintenance Rail Position on Vortex-Induced Vibration of Twin-Box-Girder (master thesis). Chang'an University, Xi'an.
Wei, L., 2023. Research on Wind-Induced Vibration Characteristics and Influencing Factors of H-Shaped Hangers with Moderate Side Ratio under Large Wind Angles of Attack (master thesis). Chang'an University, Xi'an.
Wu, R., 2019. Study on Galloping Stability of Single Pylon with Variable Section of Cable-stayed Bridge (master thesis). Chongqing University.
Wu, G., 2023a. Analysis of Vortex-Induced Vibration Characteristics of Separated Twin Box Girder Based on Proper Orthogonal Decomposition and Dynamic Mode Decomposition (master thesis). Chang'an University, Xi'an.
Wu, P., 2023b. Study on VIV Characteristics of Double Column Cable Tower (master thesis). Chang'an University, Xi'an.
Wu, M., Li, Y., Chen, X., et al., 2014. Wind spectrum and correlation characteristics relative to vehicles moving through cross wind field. Journal of Wind Engineering and Industrial Aerodynamics 133, 92-100.
Wu, M., Lian, X., Zhang, W., et al., 2023. New structure system for 4000 m class suspension bridge. China Journal of Highway and Transport 36(7), 204-211.
Wu, C., Luo, H., Wu, X., 2024. Difference of flutter performance among suspension bridges with three typical girder sections. Highway Engineering 49(1), 60-66.
Wyatt, T.A., 1992. Recent British developments: wind shielding of bridges for traffic. In: 1st International Symposium, Copenhagen, 1992.
Xiao, T., 2022. Influence of Two New Aerodynamic Measures on Vortex Vibration Characteristics of Twin-Box Girder (master thesis). Chang'an University, Xi'an.
Xie, Z., Li, J., Li, J., et al., 2024. The Distribution Characteristics of Near-Shore Wind Param Considering Wind-Wave Coupling. Journal of Chongqing University, http://kns.cnki.net/kcms/detail/50.1044.N.20240620.1352.002.html.
Xie, J., Xiang, H., 1985. State space method for three-dimensional flutter analysis of bridges. Journal of Tongji University 1985(3), 1-13.
Xin H., Wu J., 2015 Study on the effect and mechanism of aerodynamic measures for the vortex-induced vibration of separate pairs of box girders in cable-stayed bridges. Shock and Vibration 2015, 792-795.
Xing, X., 2012. Reynolds Number Effect of Bluff Bridge Deck Section Static Coefficient and Surface Pressure (master thesis). Chang'an University, Xi'an.
Xing, F., 2024. Study on Vortex Locking Region Characteristics and Vortex-Induced Force Model of Side Box π Cross-Section (master thesis). Chang'an University, Xi'an.
Xing, S., Li, J., Shi, Z., et al., 2023. Bridge flutter characteristics under a non-uniform attack angle wind field. Iranian Journal of Science and Technology-Transactions of Civil Engineering 47(2), 691-711. doi: 10.1007/s40996-022-00907-9
Xiong, C., 2021. Experiment Research on Influence of Inverted L-Shaped Deflector on Vortex-Induced Vibration Characteristics of π-shaped Section (master thesis). Chang'an University, Xi'an.
Xu, R., 2021. Study of Wind Field in Complex Terrain and its Influence on the Flow Field Around the Structure (master thesis). Chang'an University, Xi'an.
Xu, M., 2023. Effect of Wind Barrier Structural Param on the Driving Wind Environment and Vortex-Induced Vibration of Twin-Box Girder (master thesis). Chang'an University, Xi'an.
Xu, Y., Guo, W., 2003a. Dynamic analysis of coupled road vehicle and cable-stayed bridge systems under turbulent wind. Engineering Structures 25(4), 473-486.
Xu, Y., Guo, W., 2003b. Dynamic behaviour of high-sided road vehicles subject to a sudden crosswind gust. Wind and Structures 6(5), 325-346. doi: 10.12989/was.2003.6.5.325
Xue, X., Guan, Q., Hu, Z., et al., 2014. Nonlinear aerostatic stability analysis of a long-span suspension pedestrian bridge. Journal of Vibration and Shock 33(14), 113-117, 148.
Xue, X., Li, J., Bai, H., et al., 2015. The Invention Relates to a Vibration Damping System for a Stay Cable Based on a Damped Auxiliary Cable. CN102776837A. Chang'an University, Xi'an.
Xue, X., Lyu, S., Cao, T., et al., 2023. A full-cycle aerostatic instability model and the mechanism of π composite girder cable-stayed bridges. Journal of Vibration and Shock 42(20), 204-213.
Yamada, H.I.H., 1992. Measurement of aerodynamics coefficients by extended Kalman filter algorithm. Journal of Wind Engineering and Industrial Aerodynamics 42: 1255-1263.
Yan, B., 2017. Research of Wind Tunnel of Free-Standing Bridge Tower and Design of TLD System (master thesis). Chang'an University, Xi'an.
Yan, Q., 2023. Study on Wind-Induced Vibration Characteristics of H-Shaped Suspender with Small Aspect Ratio Considering Incoming Flow Characteristics (master thesis). Chang'an University, Xi'an.
Yan, X., Gao, G., Sun, Y., et al., 2024. Influence of cable-girder anchorage eccentricity on flutter performance of long-span cable-stayed bridges. In: 3rd International Symposium on Flutter and its Application, Shanghai, 2024.
Yang, Y., Ge, Y., Xiang, H., 2007. Flutter controlling effect and mechanism of central stabilizer. Journal of Tongji University (Natural Science) 35(2), 149-155.
Yang, Y., Liao, H., Wang, R., 2023. Wind-resistant design of the South channel bridge of Zhang-Jing-Gao Yangtze River Bridge. Highway 68(6), 8-13.
Ye, M., 2024. Aerodynamic Shape Optimization of New Box Girder Based on Kriging Surrogate Model (master thesis). Chang'an University, Xi'an.
Yin, D., 2024. Study on the Influence Mechanism of L-Shaped Deflector Plate on the Vortex Vibration Performance of a Double-Width Cable-stayed Bridge of π-type Main Beam (master thesis). Chang'an University, Xi'an.
Yu, E., Xu, G., Han, Y., et al., 2022. Bridge vibration under complex wind field and corresponding measurements: a review. Journal of Traffic and Transportation Engineering (English Edition) 9(3), 339-362.
Zeng, X., Han, D., 2005. Parametric study on TMD control of bridge flutter considering the effect of multi-mode aerodynamic coupling. Journal of Vibration and Shock 2005(3), 32-35, 39-132.
Zhang, X., 1990. Theory of Wind Loads on Structures and the Wind Resistance Calculation Manual. Tongji University Press, Shanghai.
Zhang, Y., 2009a. Field Investigation and Wind-Environment Numerical Simulation of Bridge Site in the Western Gap of Valley Areas (PhD thesis). Chang'an University, Xi'an.
Zhang, H., 2009b. Research on the Influences of Reynolds Number Effect to Long Span Bridges' Aerostatic Stability and Buffeting Response (master thesis). Chang'an University, Xi'an.
Zhang, G., 2011. Field Investigation and Wind Tunnel Simulation of StrongWind Characteristics in Mountainous Regions (master thesis). Chang'an University, Xi'an.
Zhang, B., 2012. Research on the Allowable Amplitude of Steel Bridge Tower Vortex-Induced Resonance (master thesis). Chang'an University, Xi'an.
Zhang, Y., 2015a. Study on the Flutter Derivatives of the π-shaped Girder Section Based on Numerical Simulation (master thesis). Chang'an University, Xi'an.
Zhang, G., 2015b. Research on Influence of Handrail Structures of the Bridge Section on Vortex-Induced Vibration (master thesis). Chang'an University, Xi'an.
Zhang, F., 2016. Research on Identification Method for Flutter Derivatives of Bridge Decks and Realization by MATLAB (master thesis). Chang'an University, Xi'an.
Zhang, H., 2018. Estimation for Critical Flutter Velocity of the Bridge with Flat Box Girder (master thesis). Chang'an University, Xi'an.
Zhang, Y., 2020. Study on the Model of Vortex Force on π-shaped Section Based on the Characteristics of Vortex Force (master thesis). Chang'an University, Xi'an.
Zhang, R., Gu, M., Xiang, H., 1997. Bridge deck aerodynamic derivative identification by unified least-square method. Journal of Vibration and Shock 1997(2), 16-20, 97.
Zhang, Y., Hu, Z., 2008. Analysis of field measurement of wind characteristics on Yumenkou Yellow River Bridge in Shanxi Province. Highway 2008(11), 77-82.
Zhang, D., Li, J., Xu, H., 2015. Reynolds number effect of streamline-like bridge deck section. Journal of Civil Engineering and Management 32(4), 67-72.
Zhang, Y., Tang, J., Zhou, M., et al., 2016. Experimental research on the spatial distribution characteristics of wind field in valley terrain. Journal of Vibration and Shock 35(12), 35-40, 49.
Zhang, Z., Wang, Z., Qie, K., et al., 2021. Influences of the torsional-bending frequency ratio on post-flutter characteristics of an N-shaped section model. Journal of Vibration Engineering 34(6), 1268-1275.
Zhang, R., Yang, H., Liu, Z., et al., 2022. Segmental model tests for post flutter characteristics of truss-stiffening girder suspension bridge. Journal of Vibration and Shock 41(5), 1-8.
Zhang, Y., Zhou, M, Hu, Z., 2014. Measurement and identification of wind paramat bridge site in complex inland terrain. Journal of Guangxi University (Natural Science Edition) 39(4), 876-885.
Zhao, F., 2022. Effect of Grille on Vortex-Induced Vibration on Split Double Box Girder Pedestrian Suspension Bridge (master thesis). Chang'an University, Xi'an.
Zhao, H., Chen, L., Xiao, H., et al., 2022. Study on vortex-induced vibration amplitude thresholds of high-speed railway long-span bridge. Bridge Construction 52(1), 49-55. doi: 10.1117/12.2635413
Zhao, L., Li, K., Wang, C., et al., 2019a. Review on passive aerodynamic countermeasures on main girders aiming at wind-induced stabilities of long-span bridges. China Journal of Highway and Transport 32(10), 34-48.
Zhao, L., Wang, Q., Song, S., et al., 2019b. Investigation of wind-resistance performance of Lingdingyang bridge with main span 1666 m in Shen-Zhong link. China Journal of Highway and Transport 32(10), 57-66.
Zhao, G., Wang, Z., Zhu, S., et al., 2021. Experimental study of mitigation of wind-induced vibration in asymmetric cable-stayed bridge using sharp wind fairings. Applied Sciences 12(1), 242. doi: 10.3390/app12010242
Zheng, X., 2021. Numerical Study on the Vortex-Induced Vibration of Rectangular 5: 1 Cylinder (master thesis). Chang'an University, Xi'an.
Zhou, J., 2010. Vortex-induced Vibration of Bridge Structure and Control (master thesis). Chang'an University, Xi'an.
Zhou, Z., Chen, A., Xiang, H., 2002. Numerical assessment of aerodynamic derivatives and critical wind speed of flutter of bridge decks by discrete vortex method. Journal of Vibration Engineering 2002(3), 83-87.
Zhou, L., Ge, Y., 2008. Wind tunnel test for vortex-induced vibration of vehicle-bridge system section model. Journal of the Brazilian Society of Mechanical Sciences and Engineering 30(2), 110-117.
Zhou, Z., Ma, R., 2010. Numerical simulation study of the Reynolds number effect on two bridge decks based on the deterministic vortex method. Wind and Structures 13(4), 347-362. doi: 10.12989/was.2010.13.4.347
Zhou, Y., Sun, Y., Li, M., 2020. Experimental research on wind resistant performance of free standing pylon of long-span cable-stayed bridge. Bridge Construction 50(3), 52-57.
Zhu, C., 2021. Vortex-induced Vibration Performance and Control of Twin-Box Girder (master thesis). Chang'an University, Xi'an.
Zhu, Z., Chen, Z., 2004. Numerical simulations for aerodynamic derivatives and critical flutter velocity of bridge deck. China Journal of Highway and Transport 2004(3), 44-48, 53.
Zhu, L., Gao, G., 2016. A nonlinear self-excited force model of soft flutter phenomenon for a twin-side-girder bridge section. Journal of Vibration and Shock 35(21), 29-35.
Zhu, Z., Gu, M., 2014. A CFD-AM-CSD method on rapid prediction of the flutter critical wind speed of long-span bridges. China Civil Engineering Journal 47(7), 88-96.
Zhu, Z., Gu, M., Chen, Z., 2007. Wind tunnel and CFD study on identification of flutter derivatives of a long-span self-anchored suspension bridge. Computer-Aided Civil and Infrastructure Engineering 22(8), 541-554. doi: 10.1111/j.1467-8667.2007.00509.x
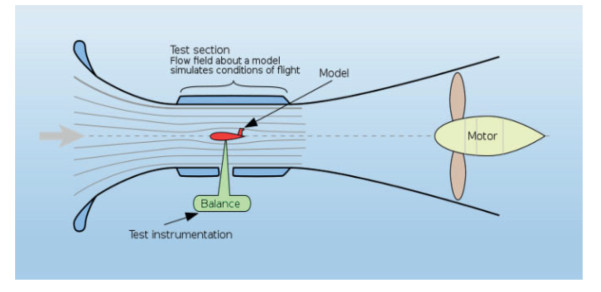
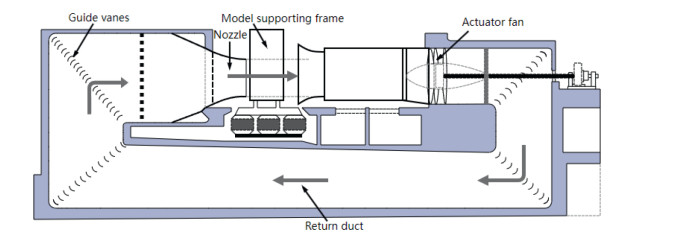


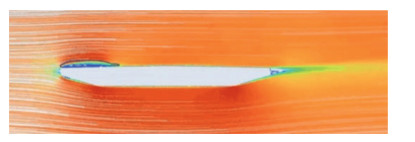
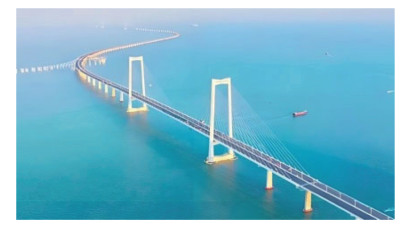


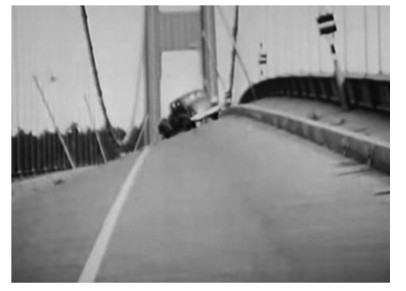
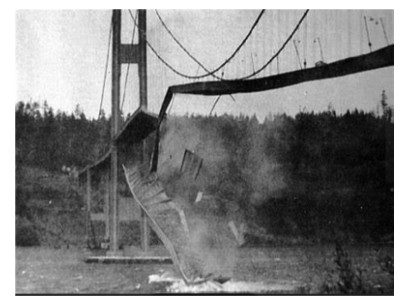
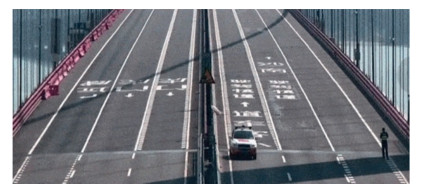


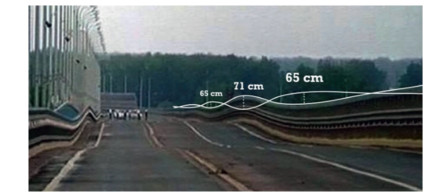
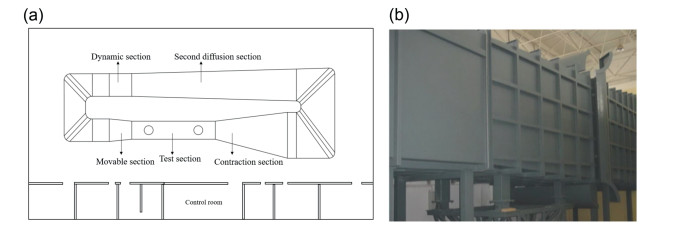
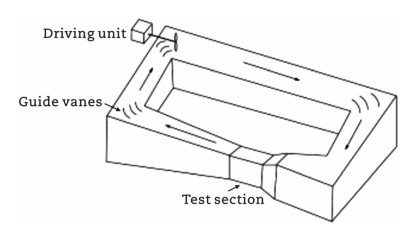
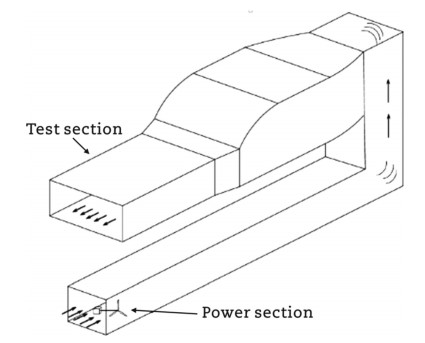


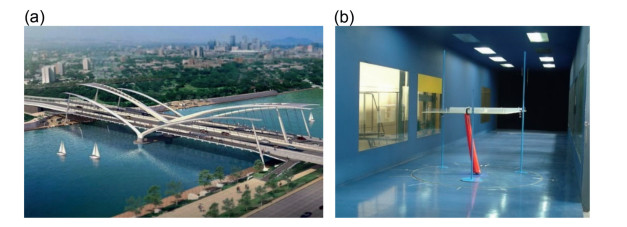


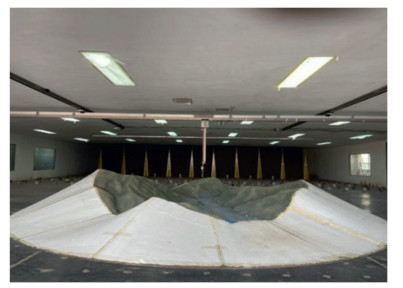


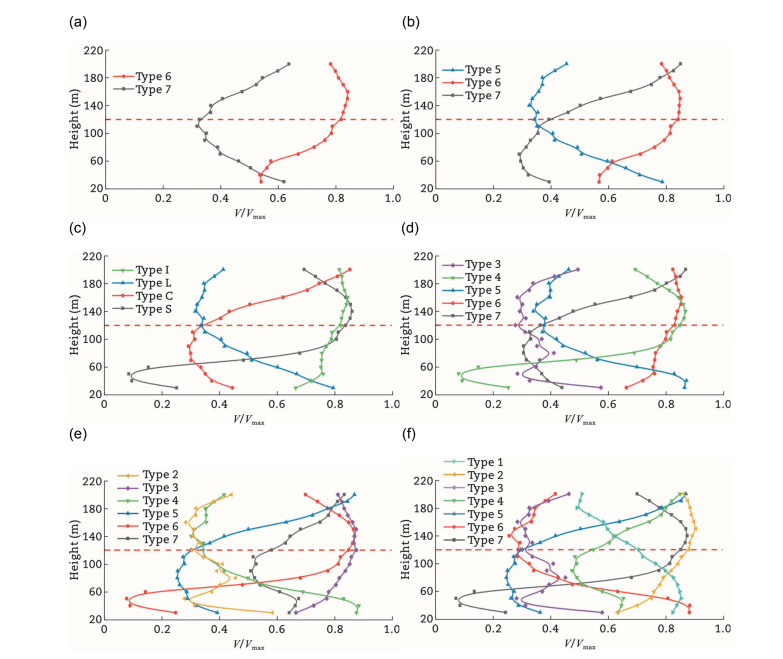


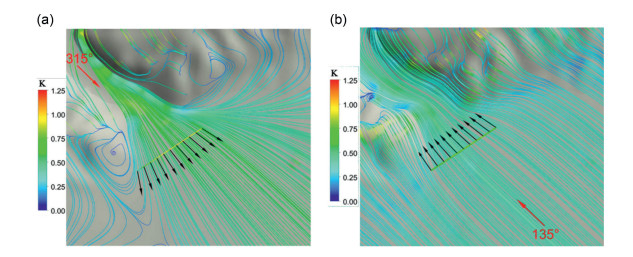

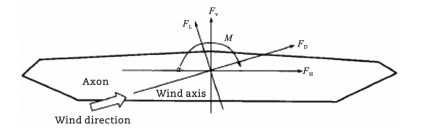

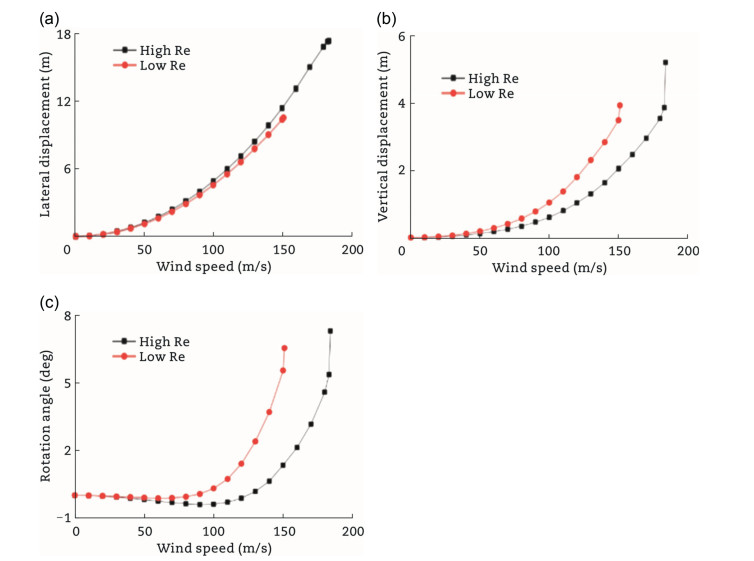
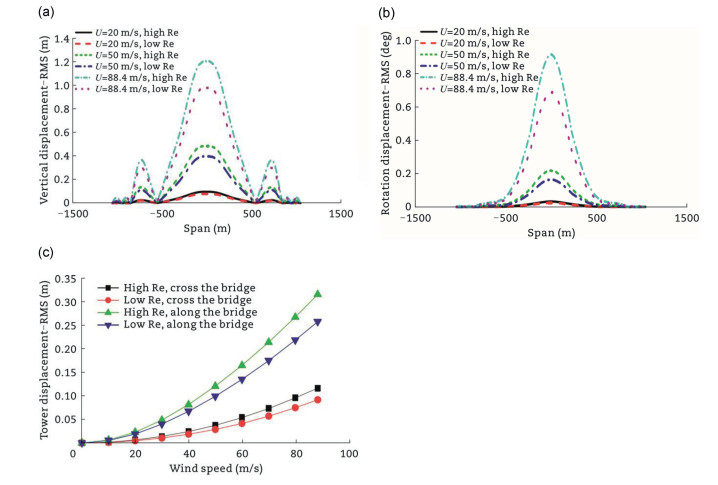
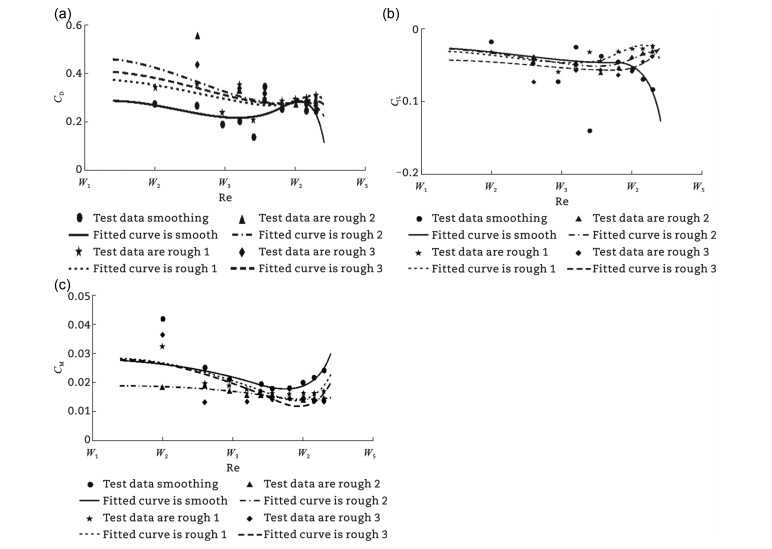


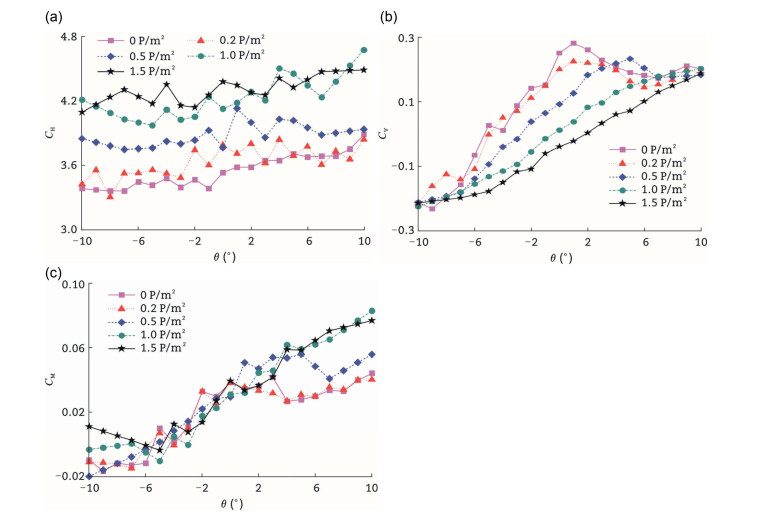
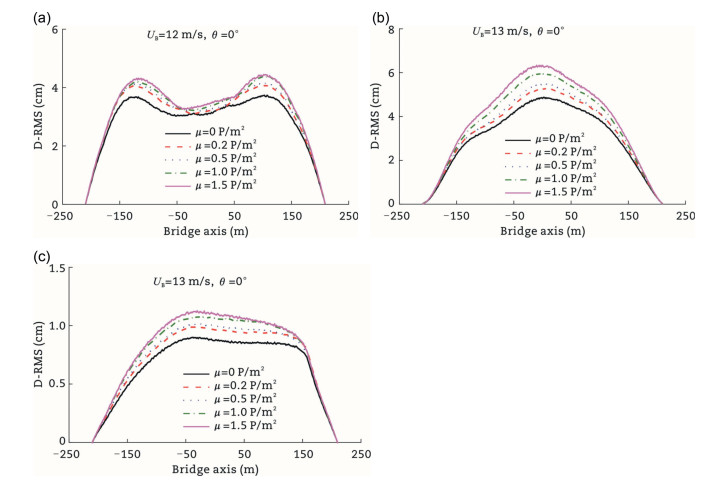


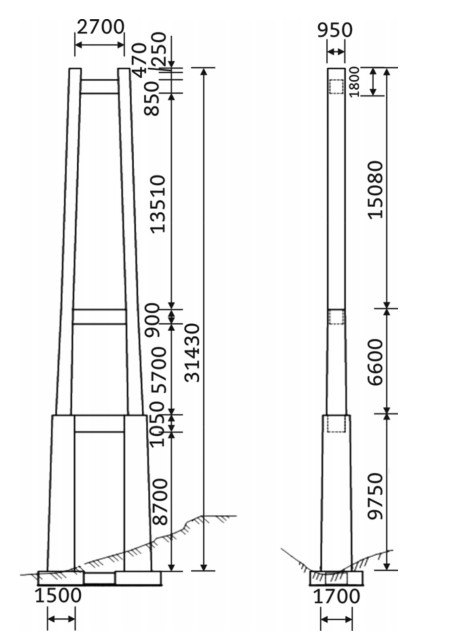
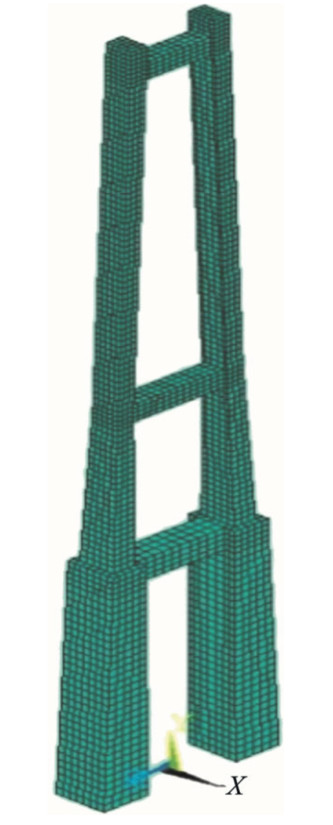


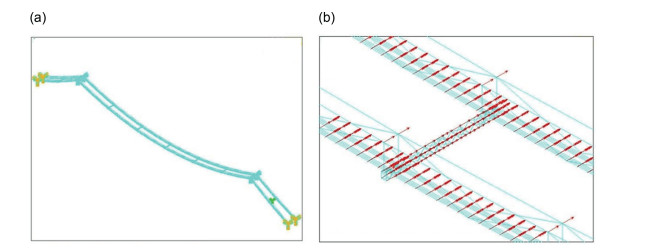

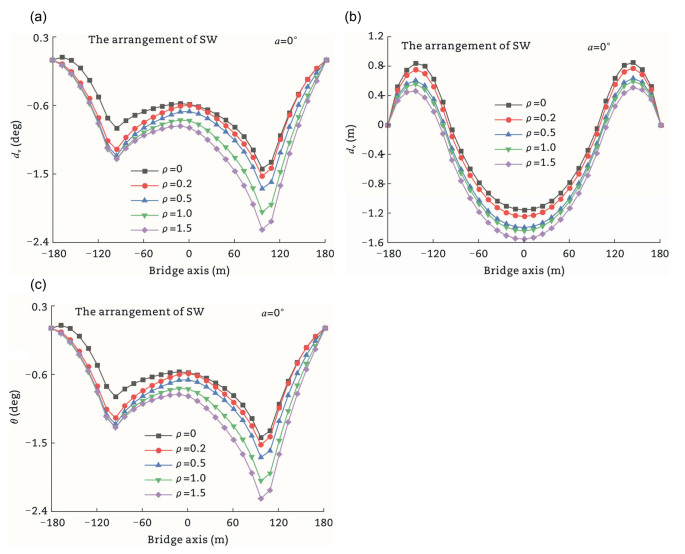


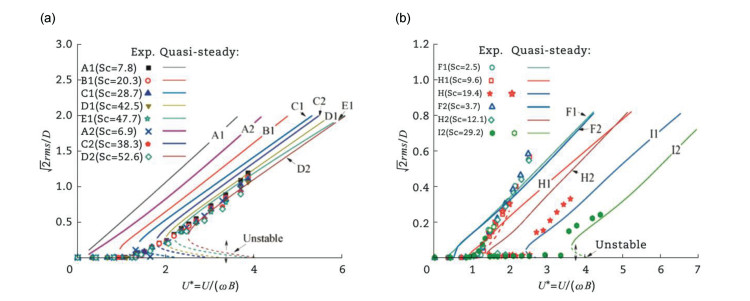
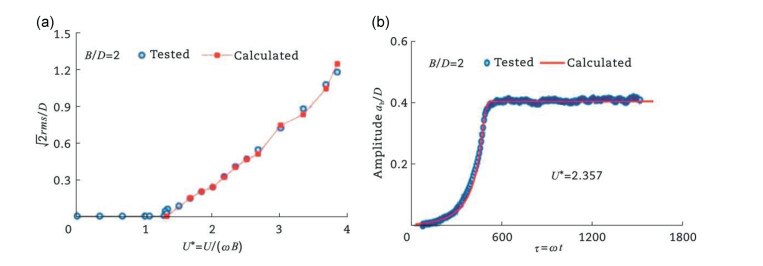


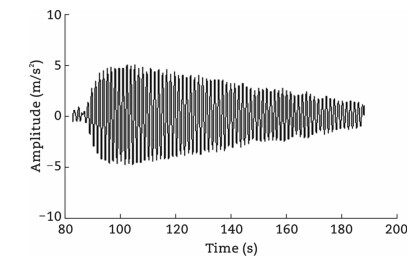
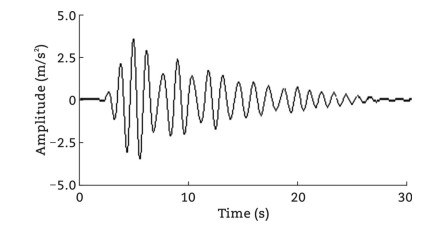


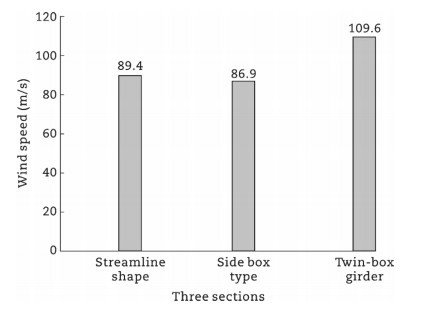

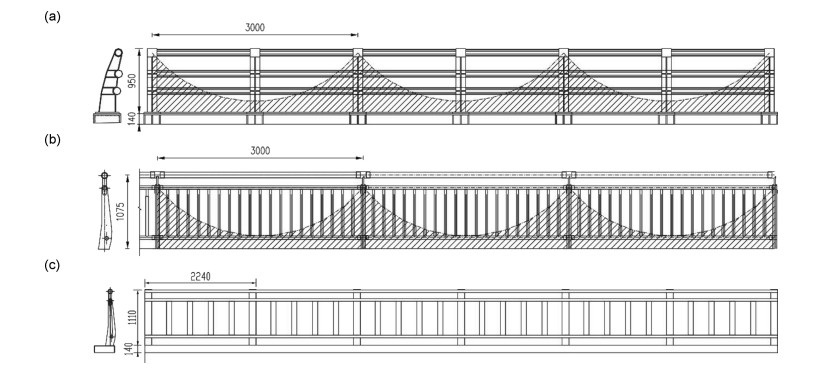

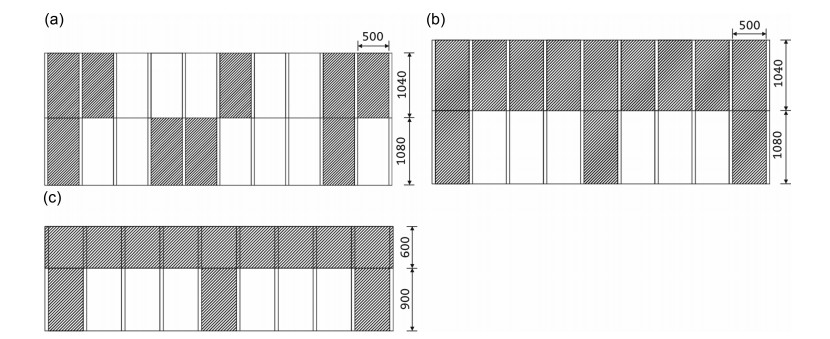

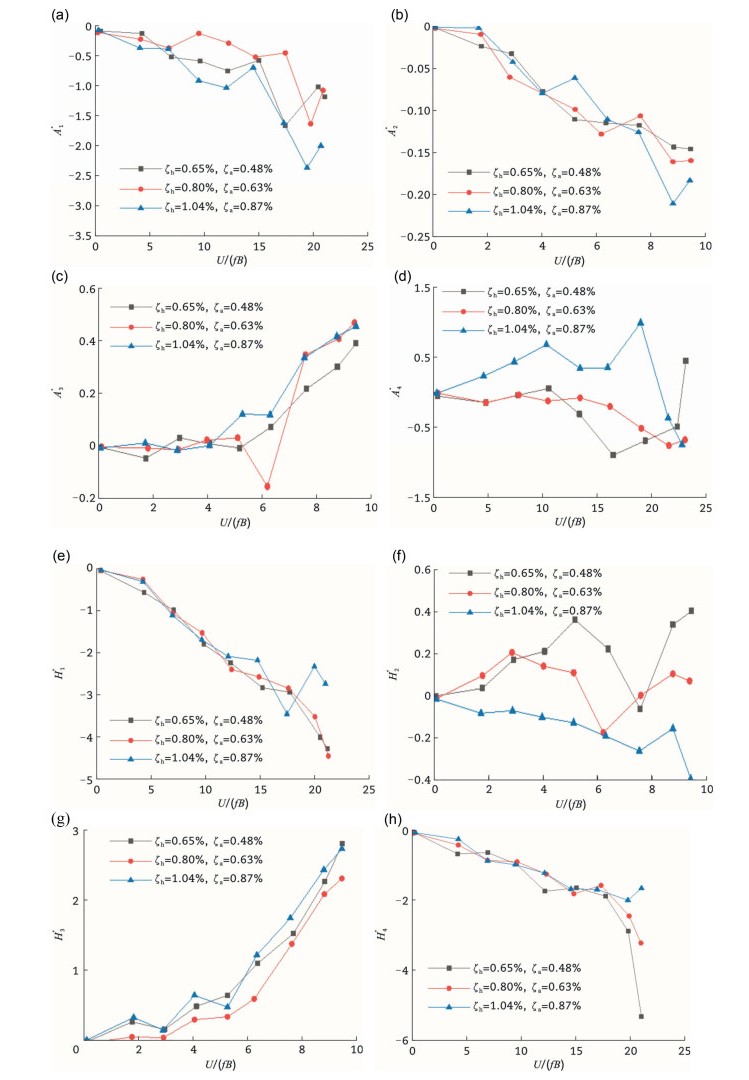


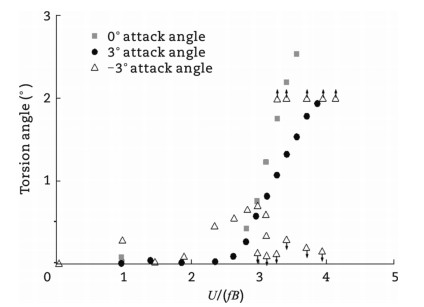


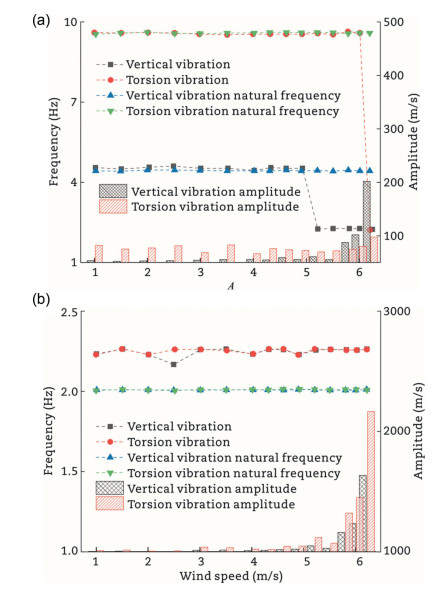

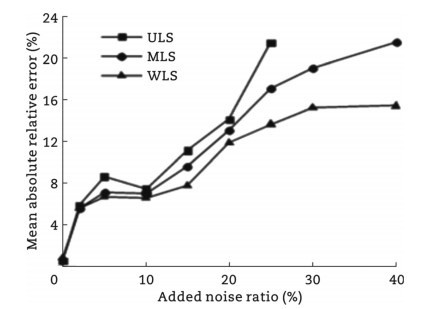

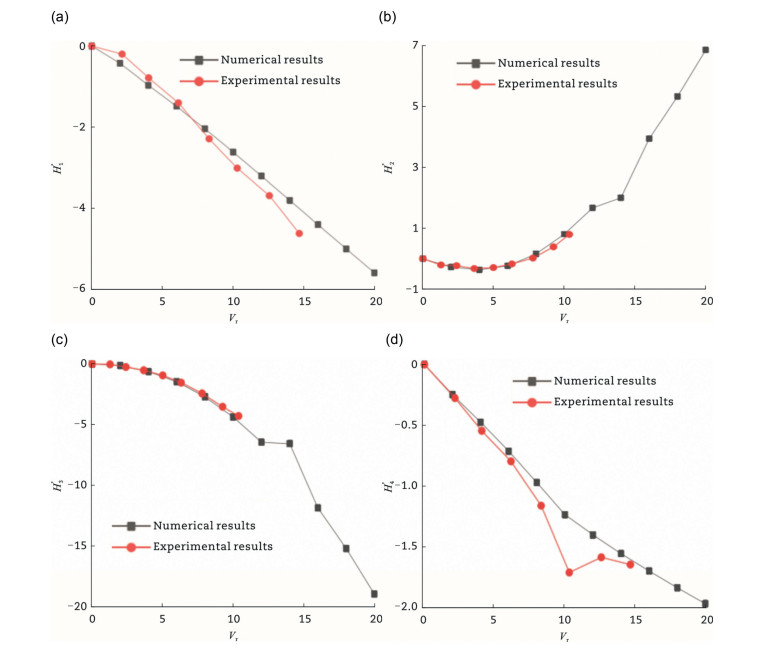

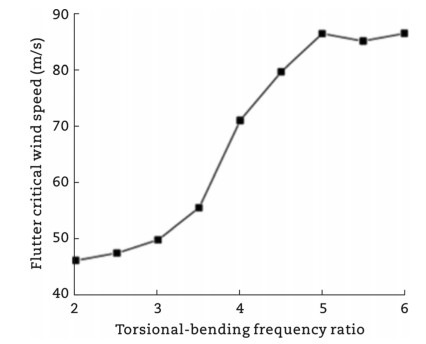

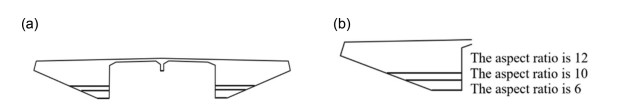
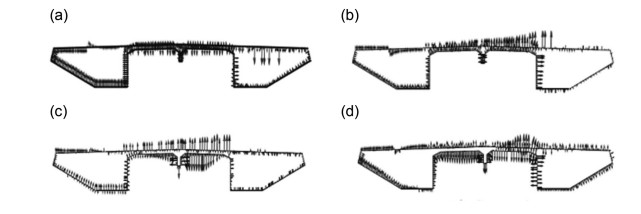
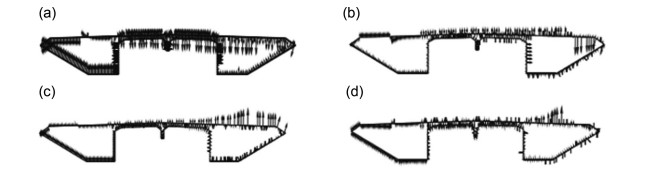

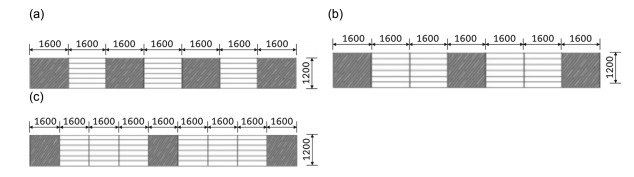


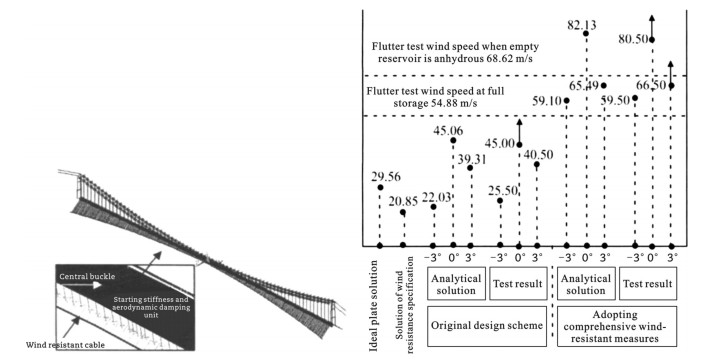
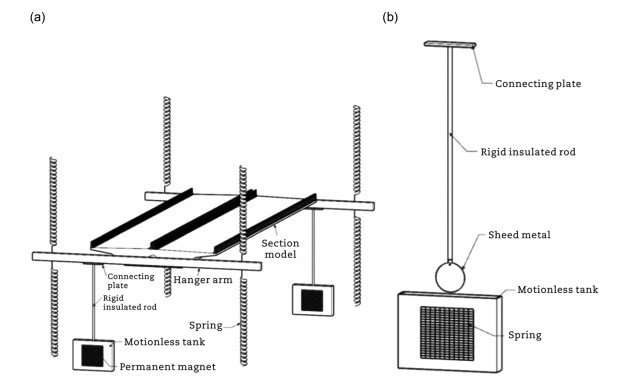
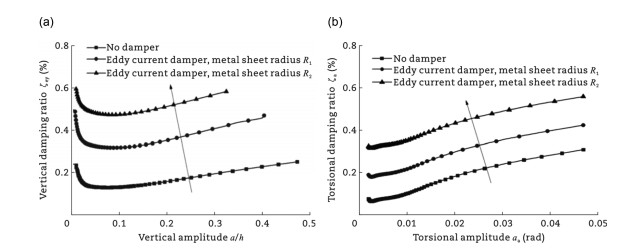
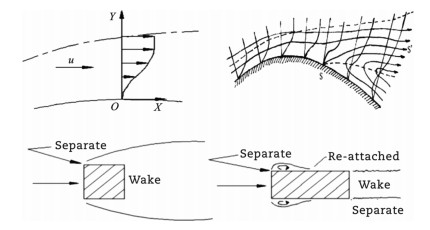


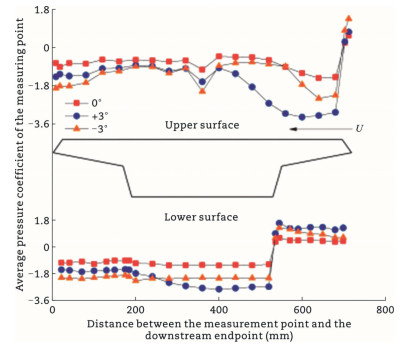
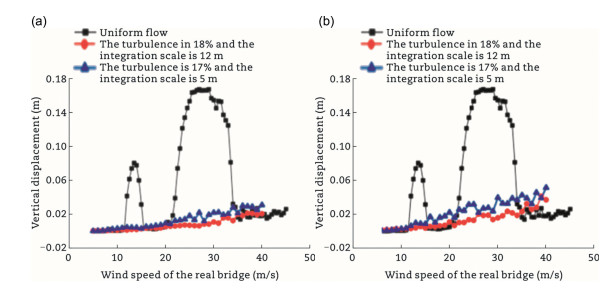


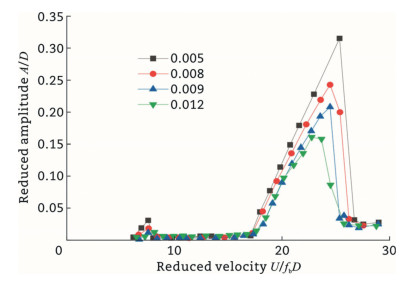


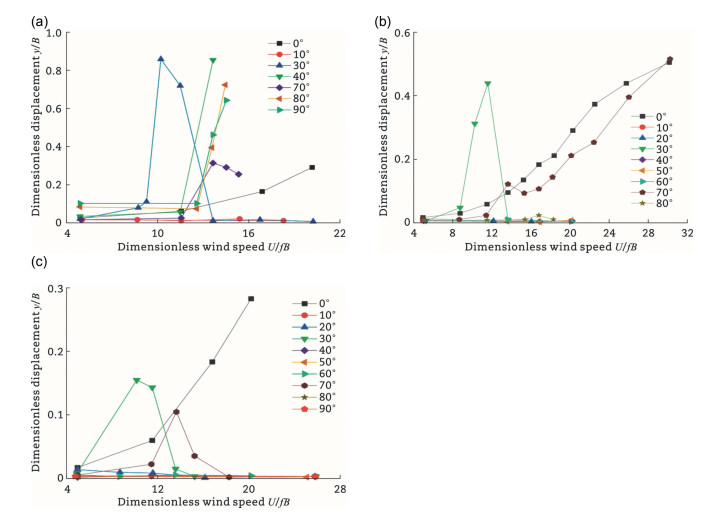
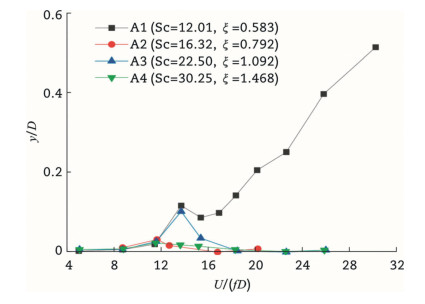

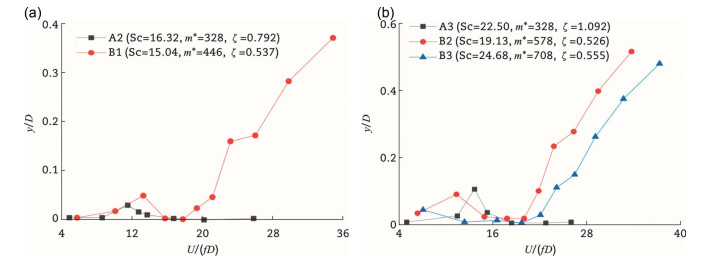
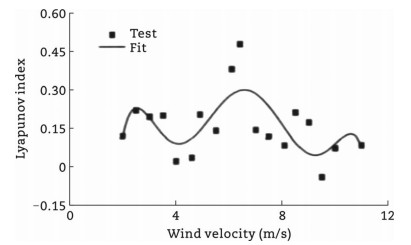

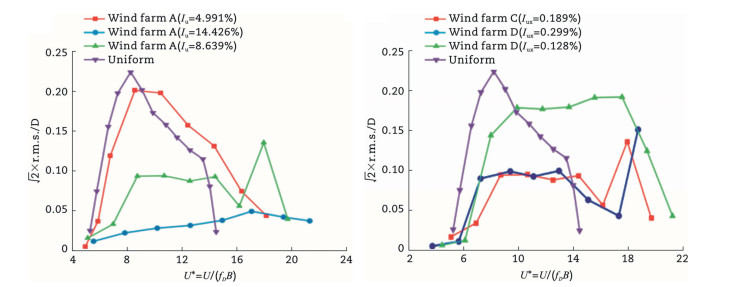

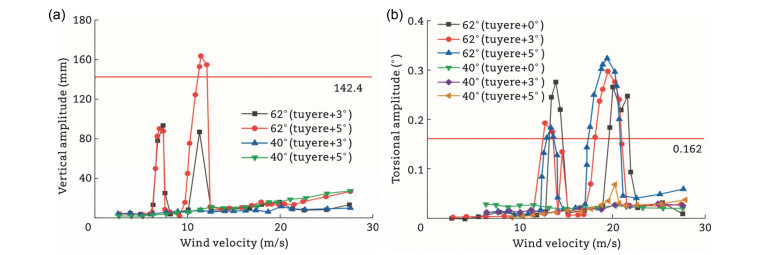
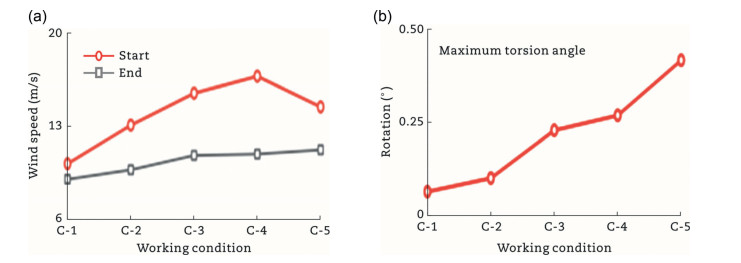


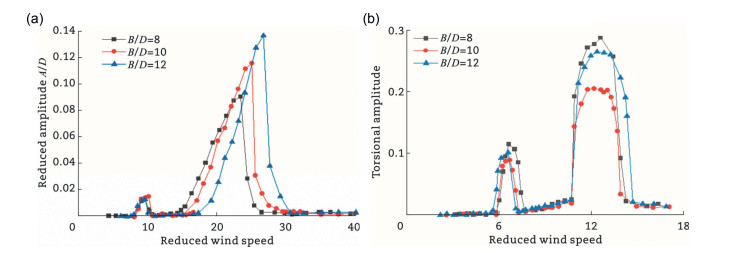
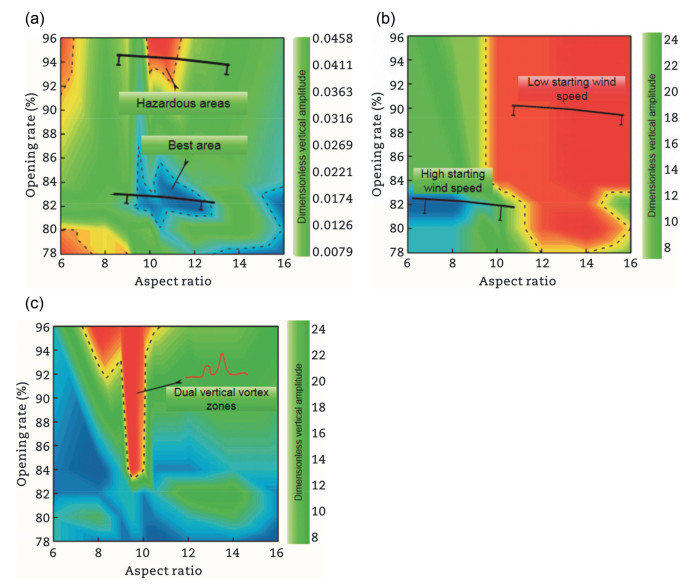


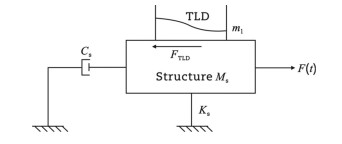


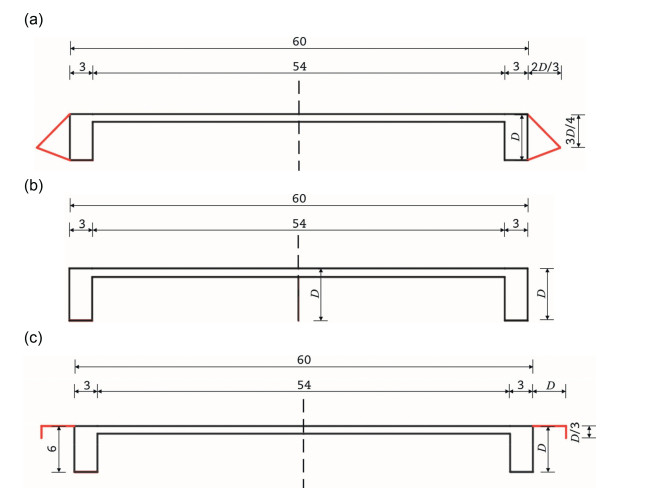
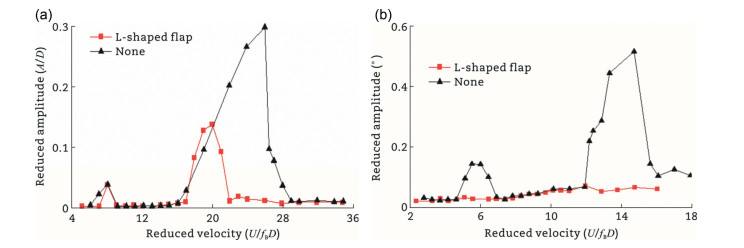

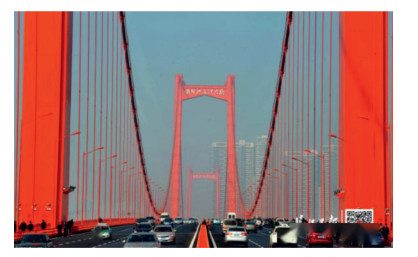
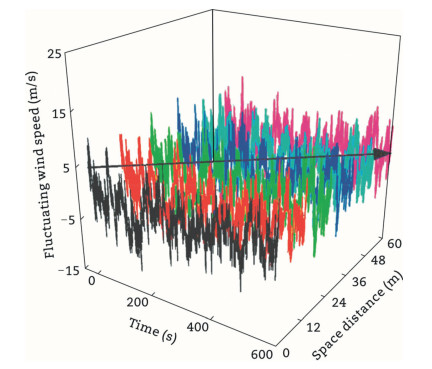


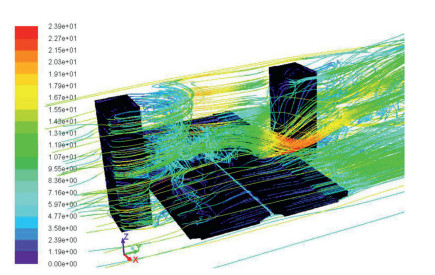


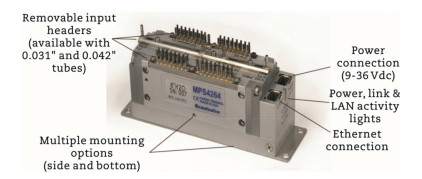
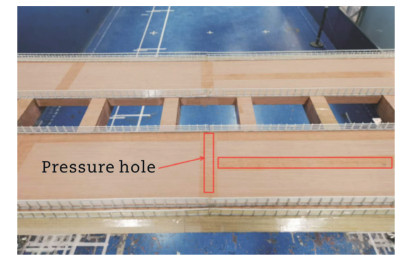
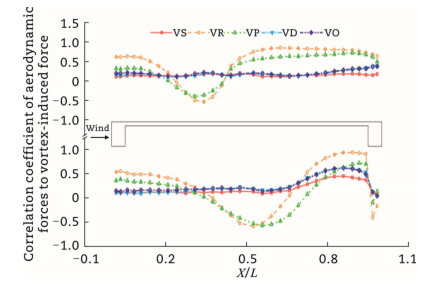
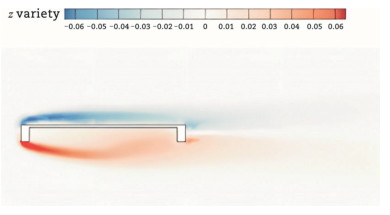


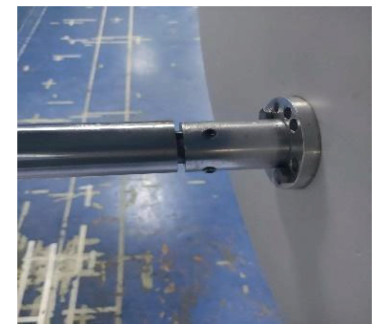

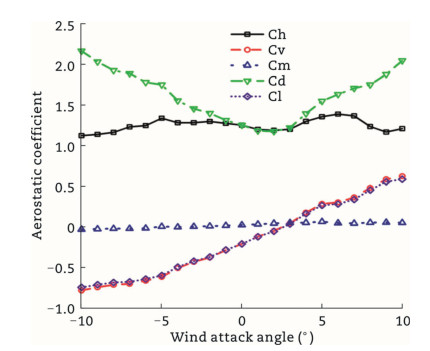
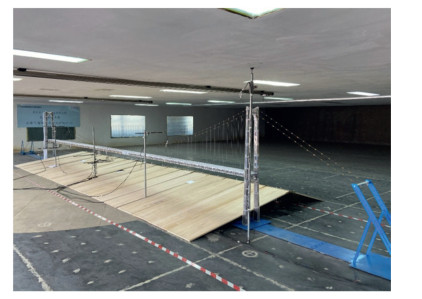

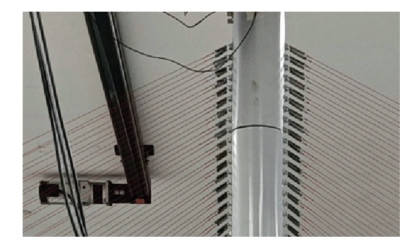
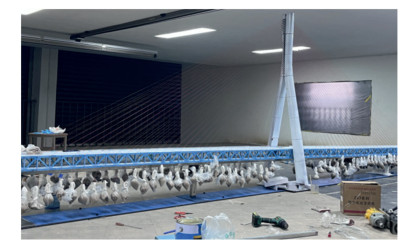
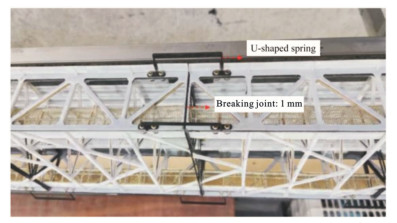
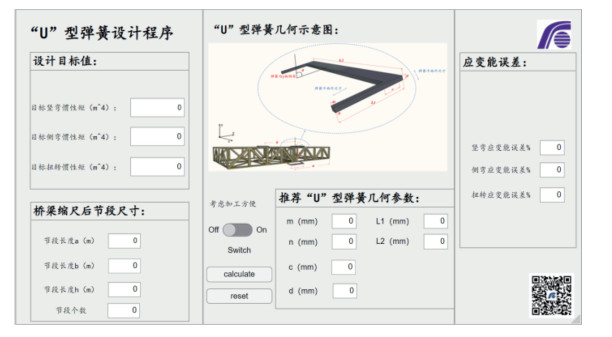


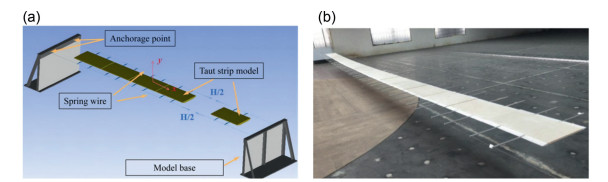
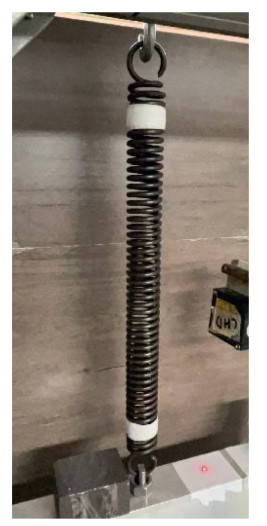

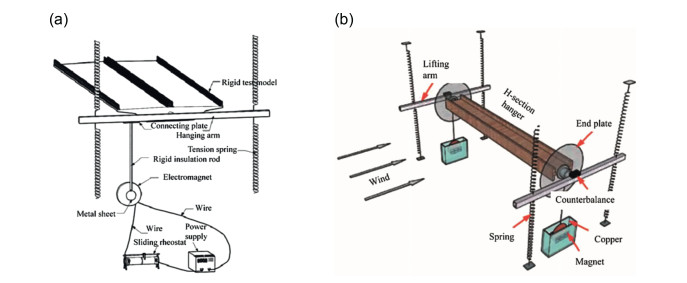

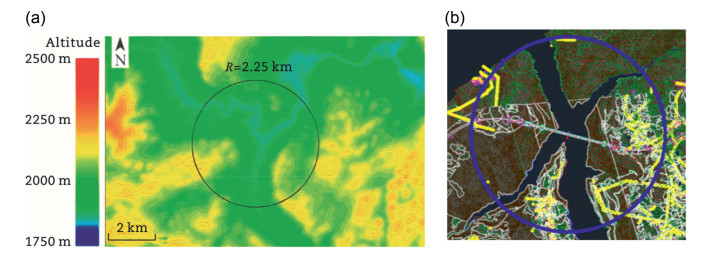
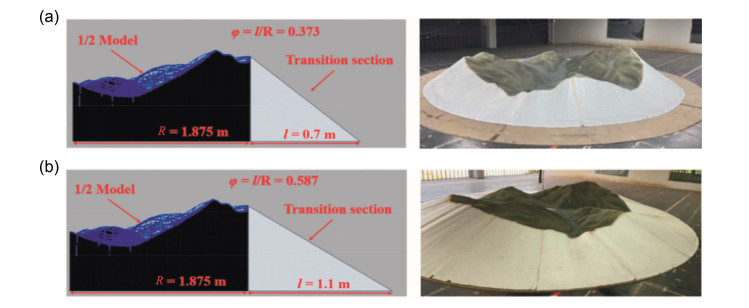


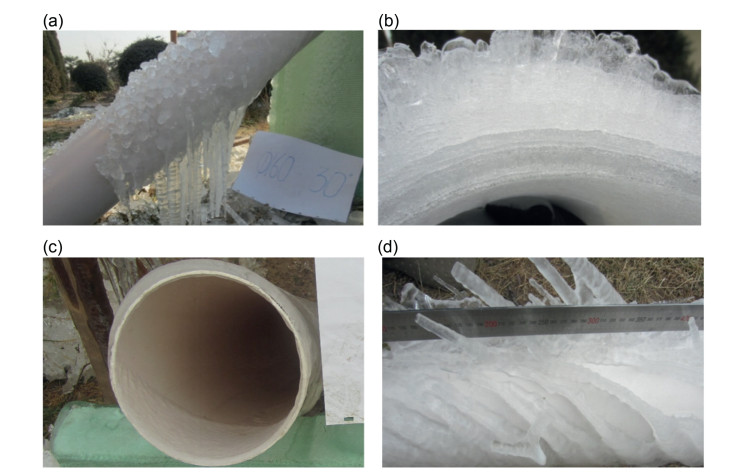
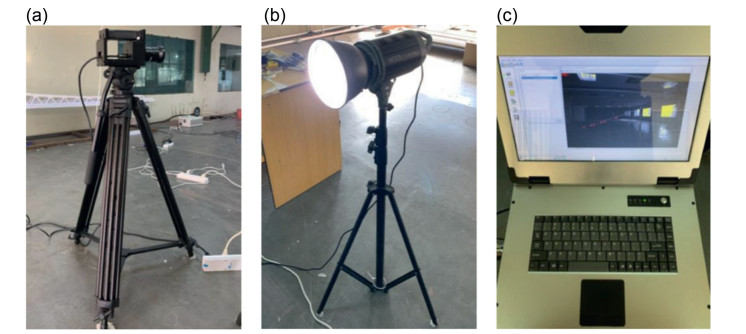

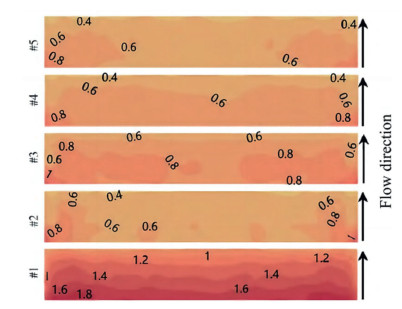

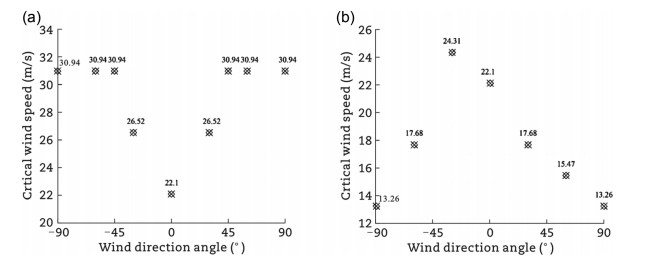

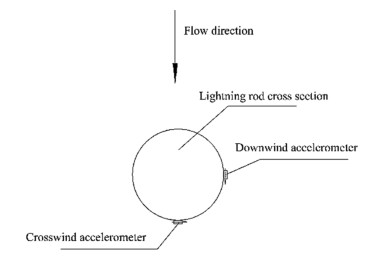


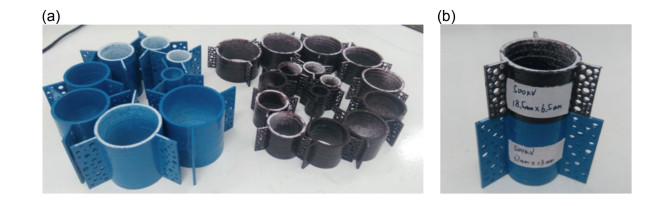
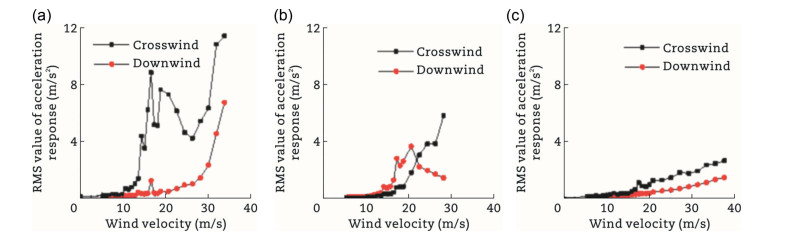
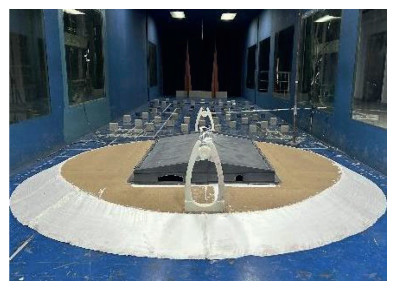
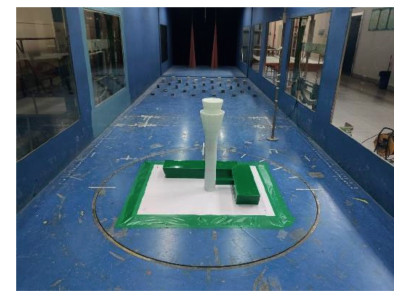
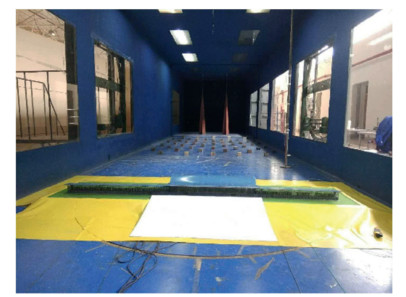
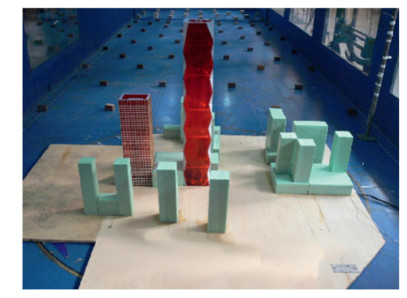

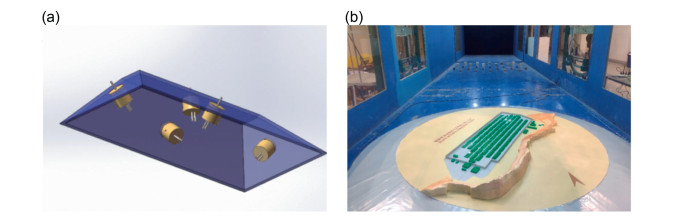

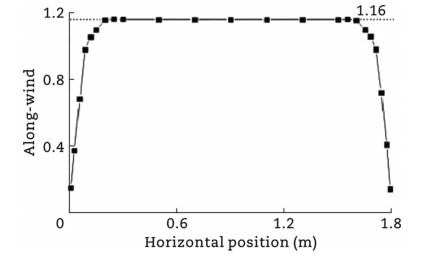
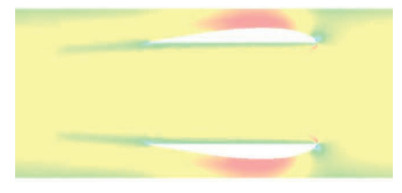

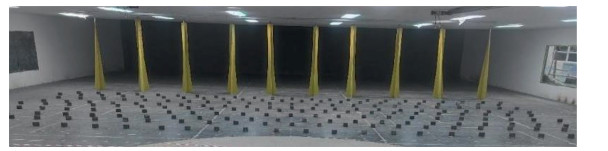
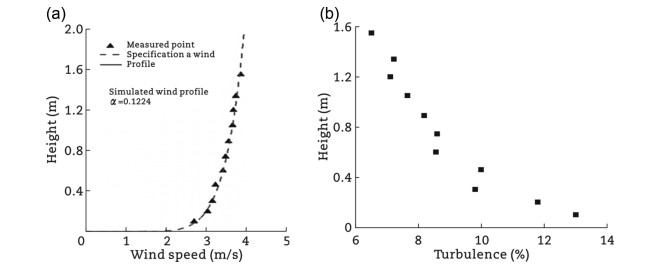


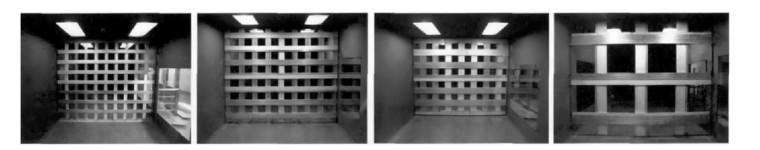

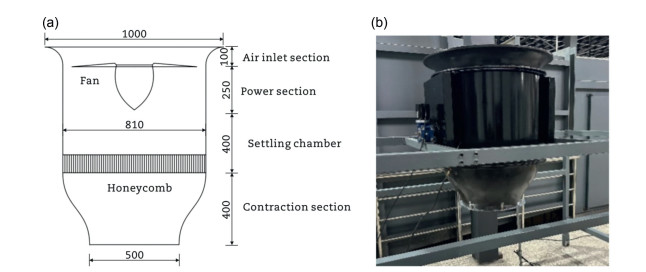


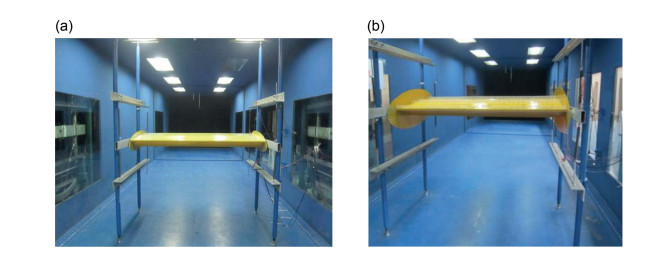


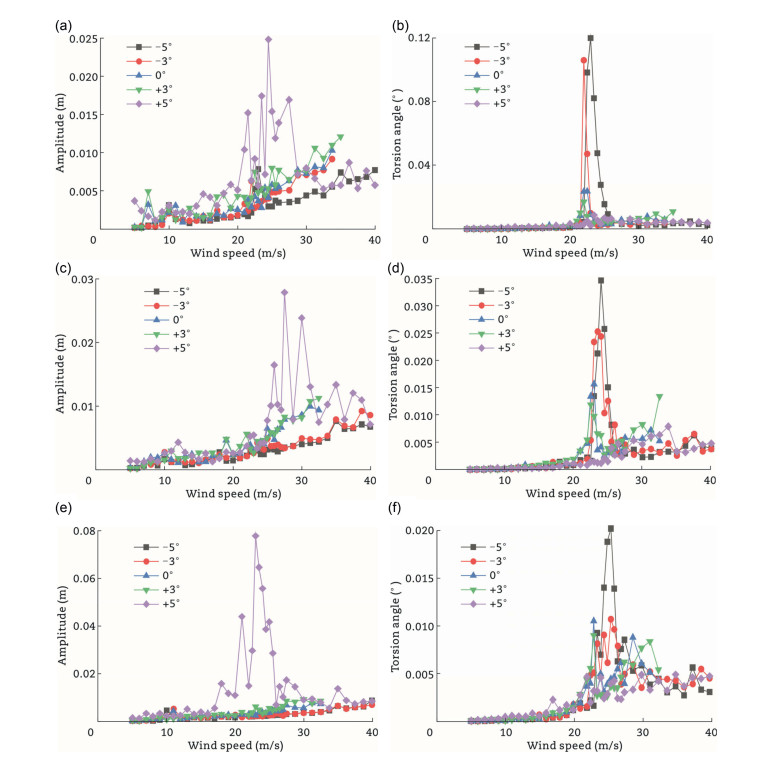


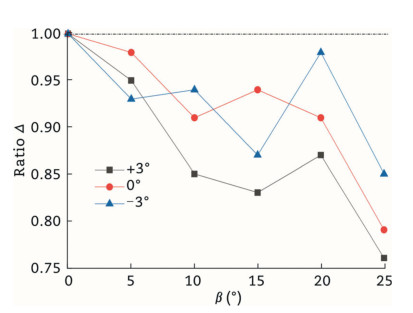
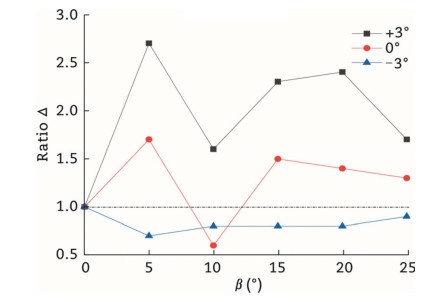
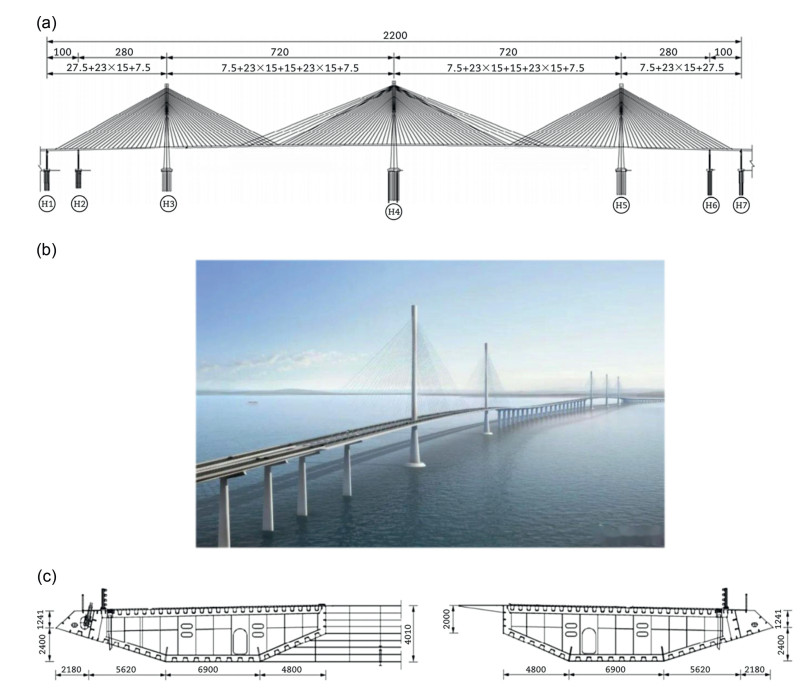


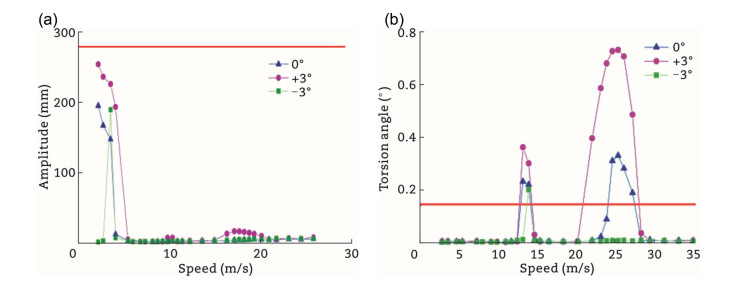

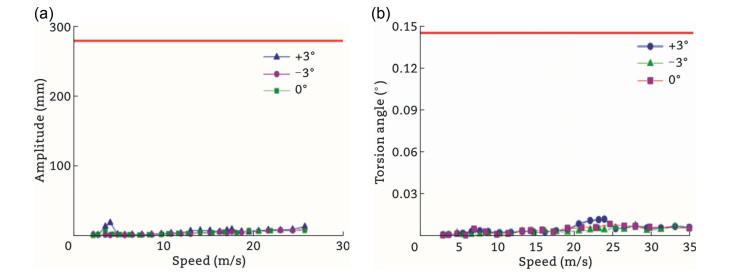
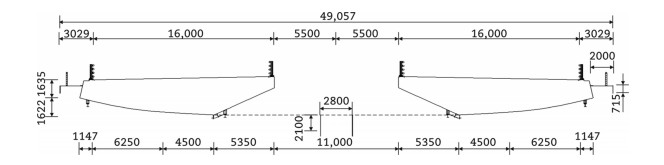


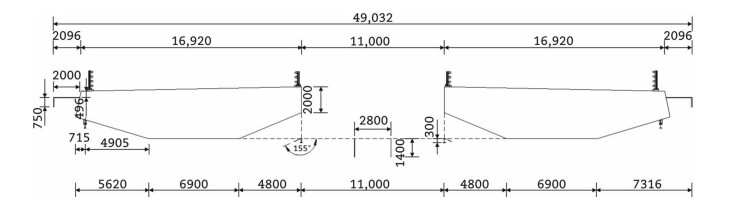
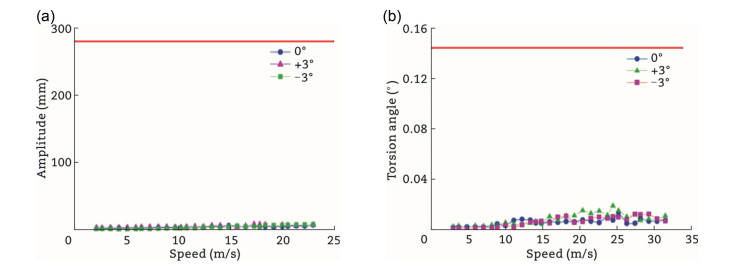


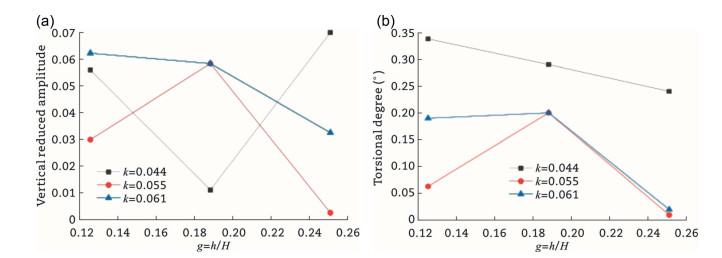

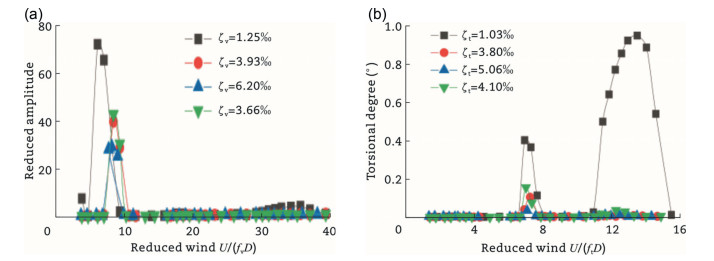


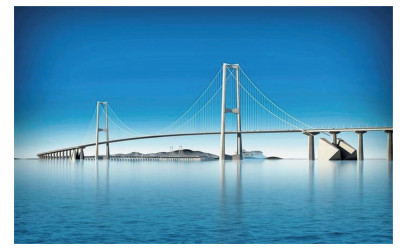
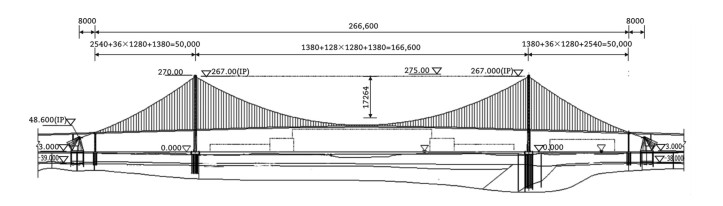


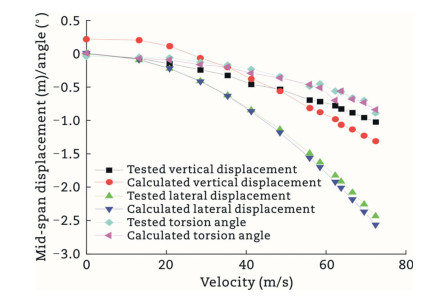
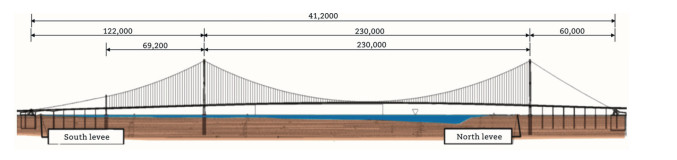


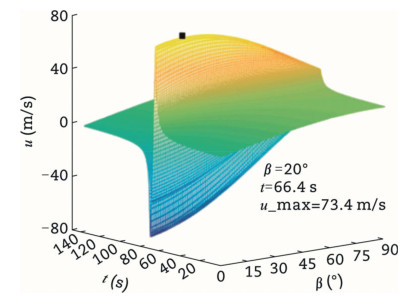


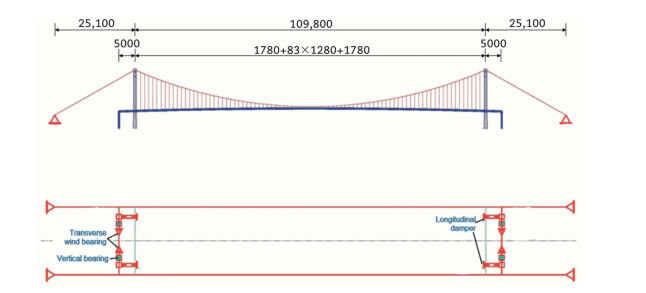
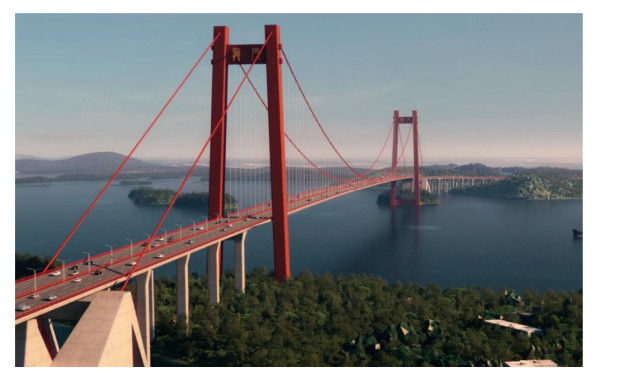


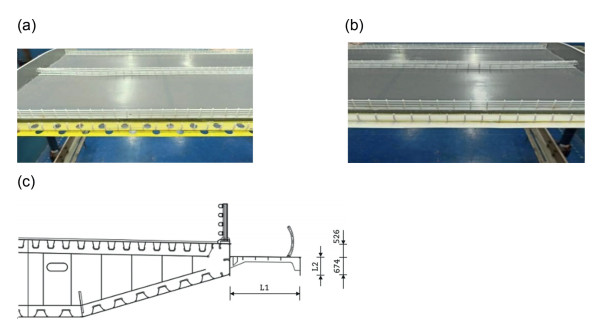
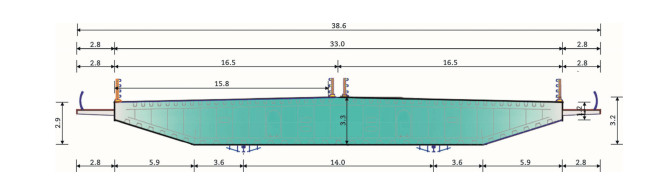
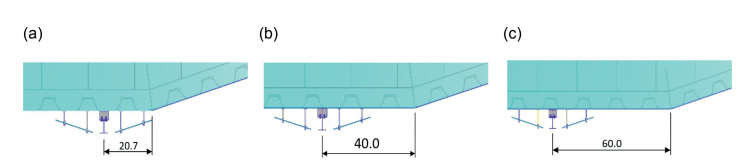
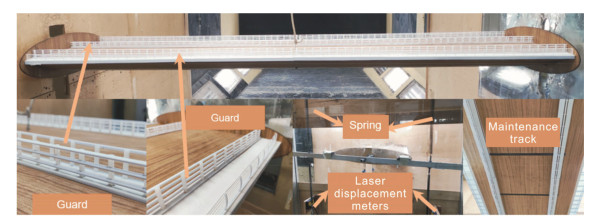


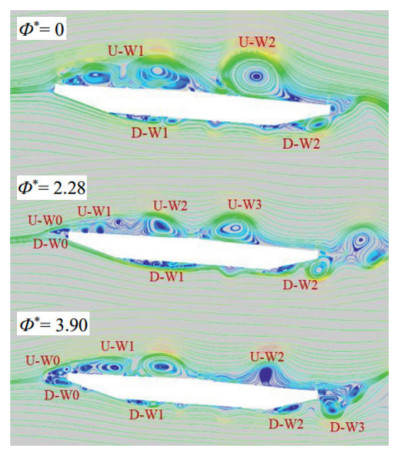


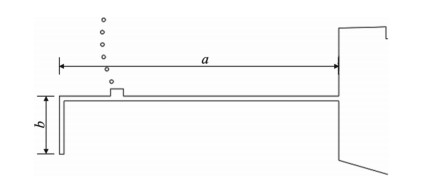


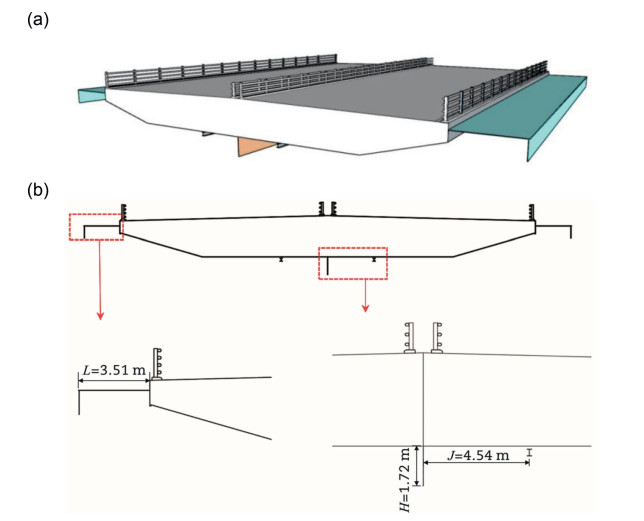
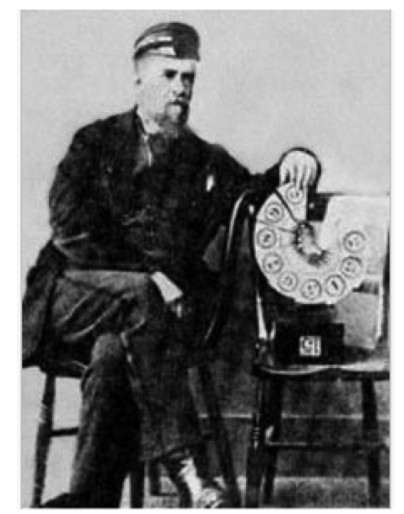
计量
- 文章访问数: 37
- HTML全文浏览量: 0
- PDF下载量: 17

